-
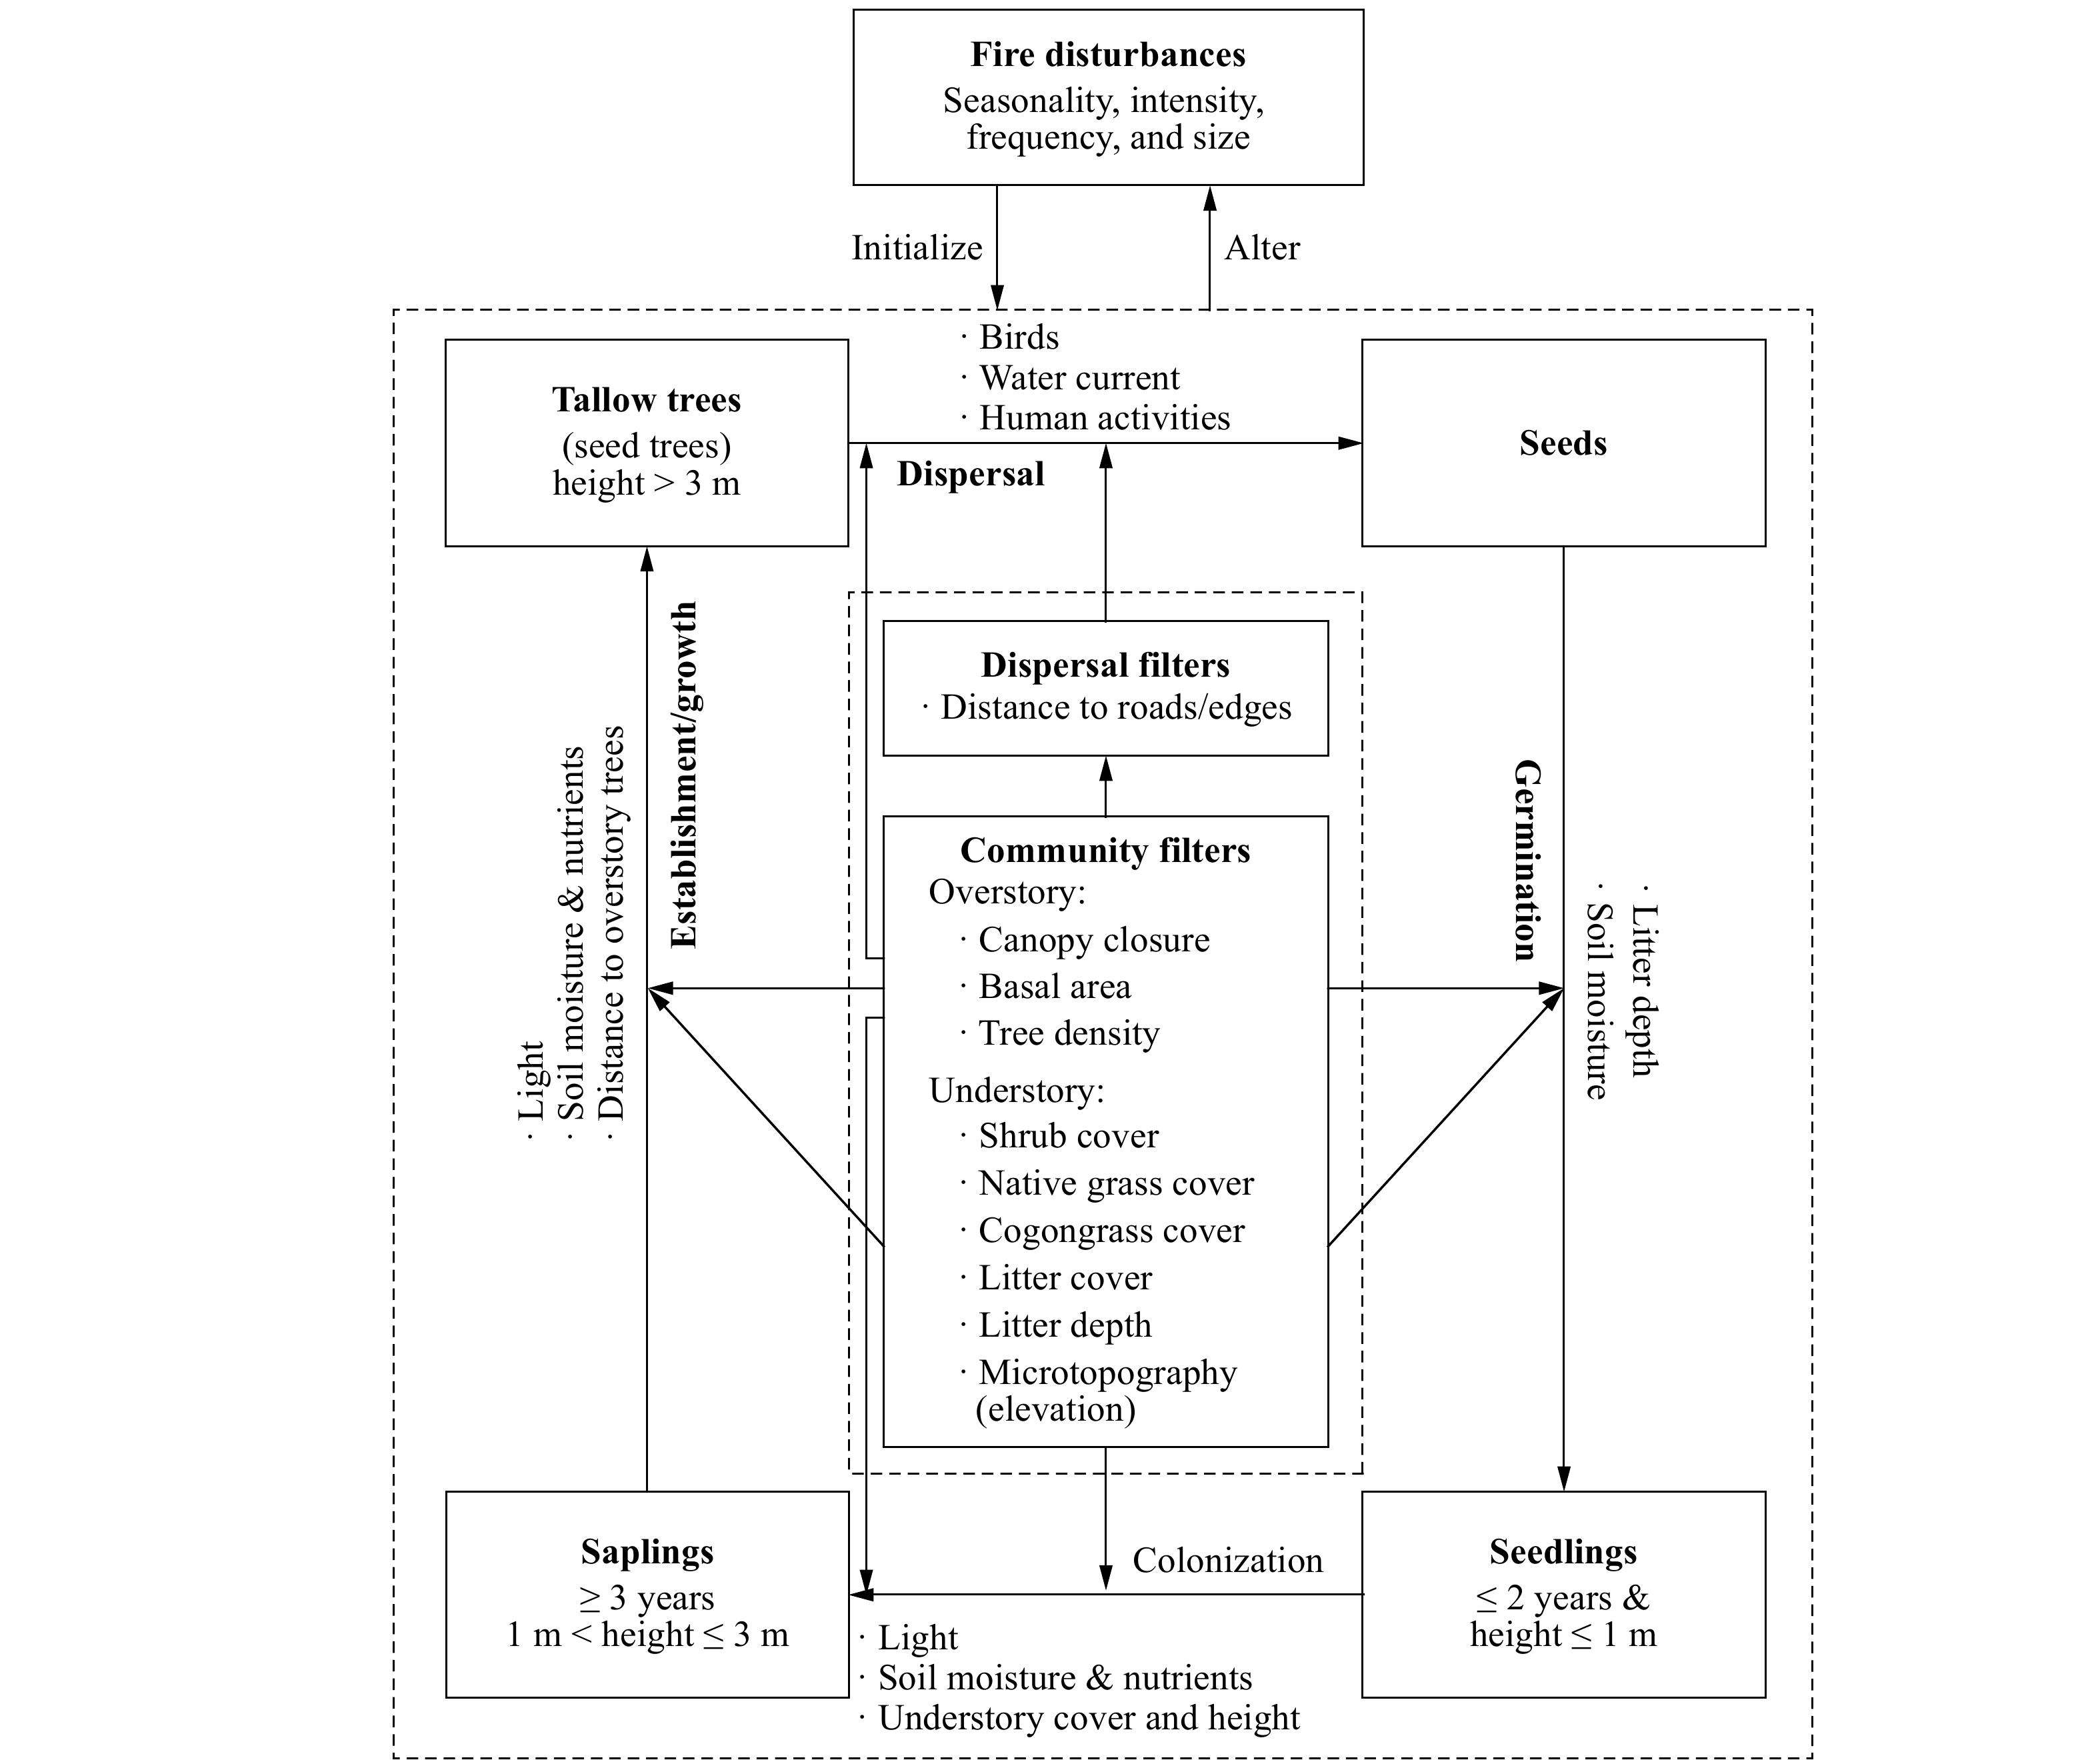
Figure 1. The conceptual diagram of tallow invasion at the community level showing the filters that affect tallow invasion processes. Tallow invasion includes four stages (seed dispersal, seed germination, seedling colonization, and sapling establishment/growth into tallow trees) with major corresponding limiting factors (bulleted) (adapted from Fan et al. 2021[37]).
-
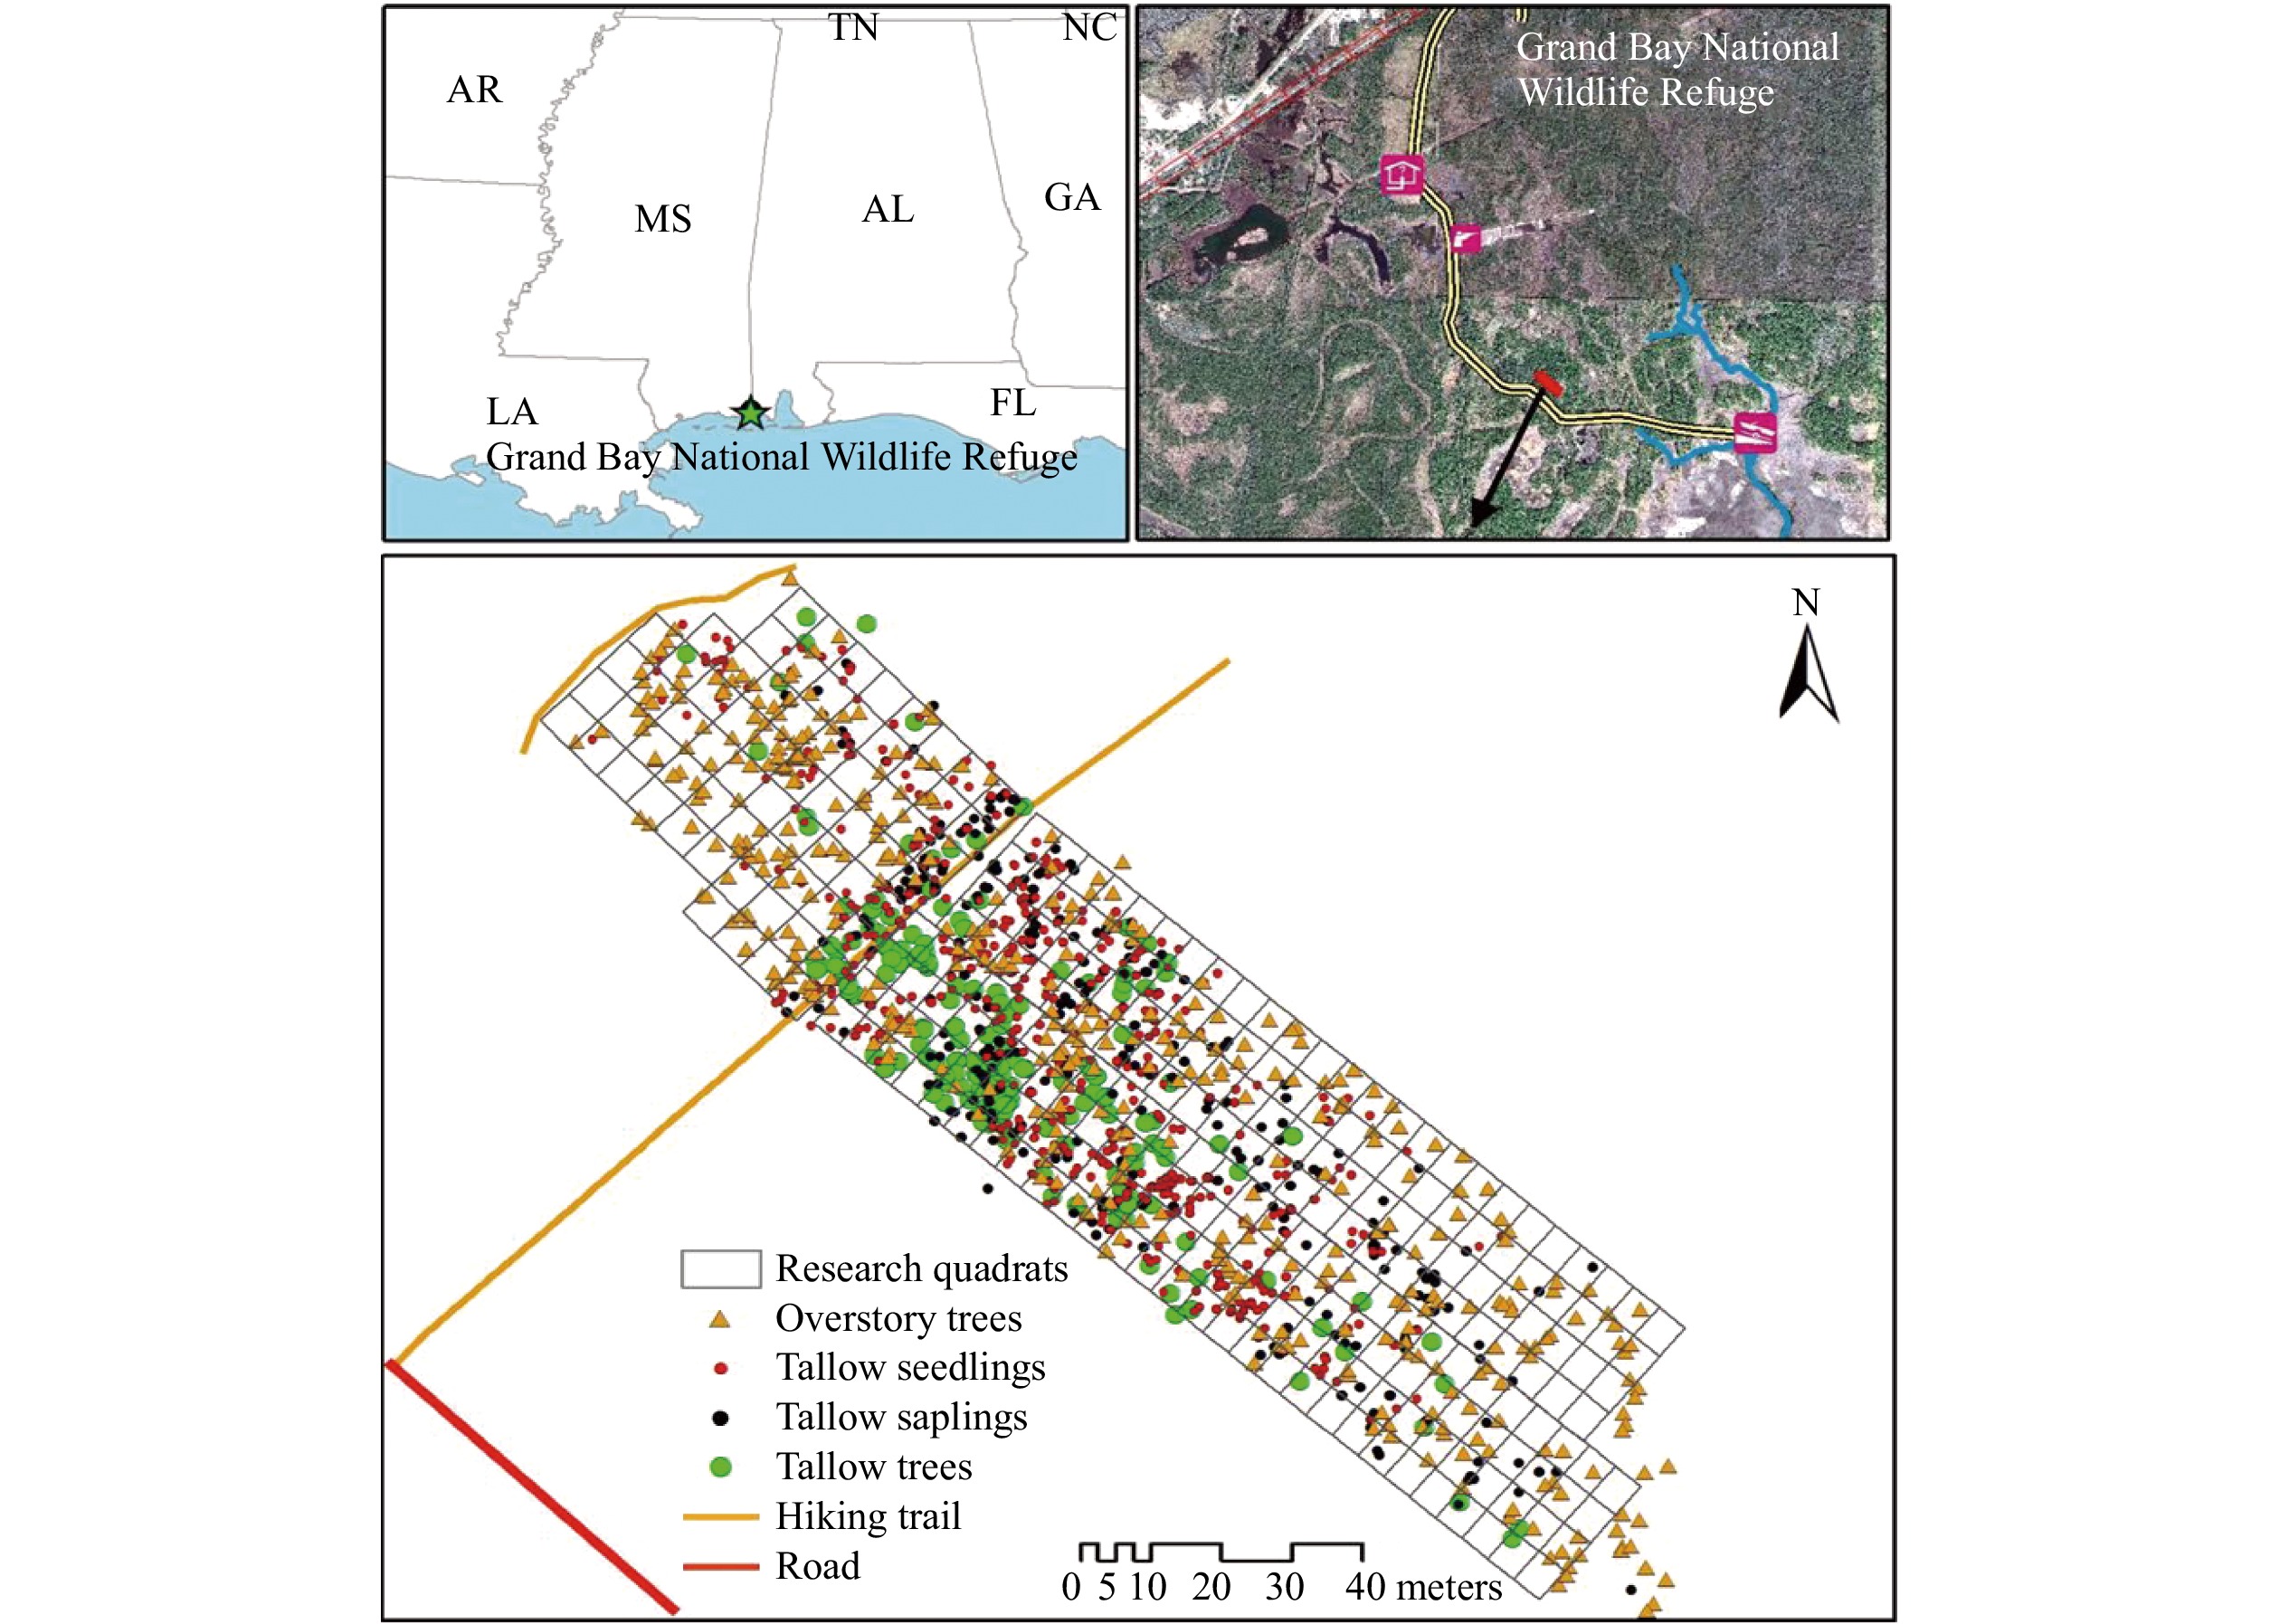
Figure 2. The invasion pattern of tallow populations in the 0.86-ha plot (281 contiguous 30-m2 quadrats) in the slash pine flatwood in the Grand Bay National Wildlife Refuge.
-
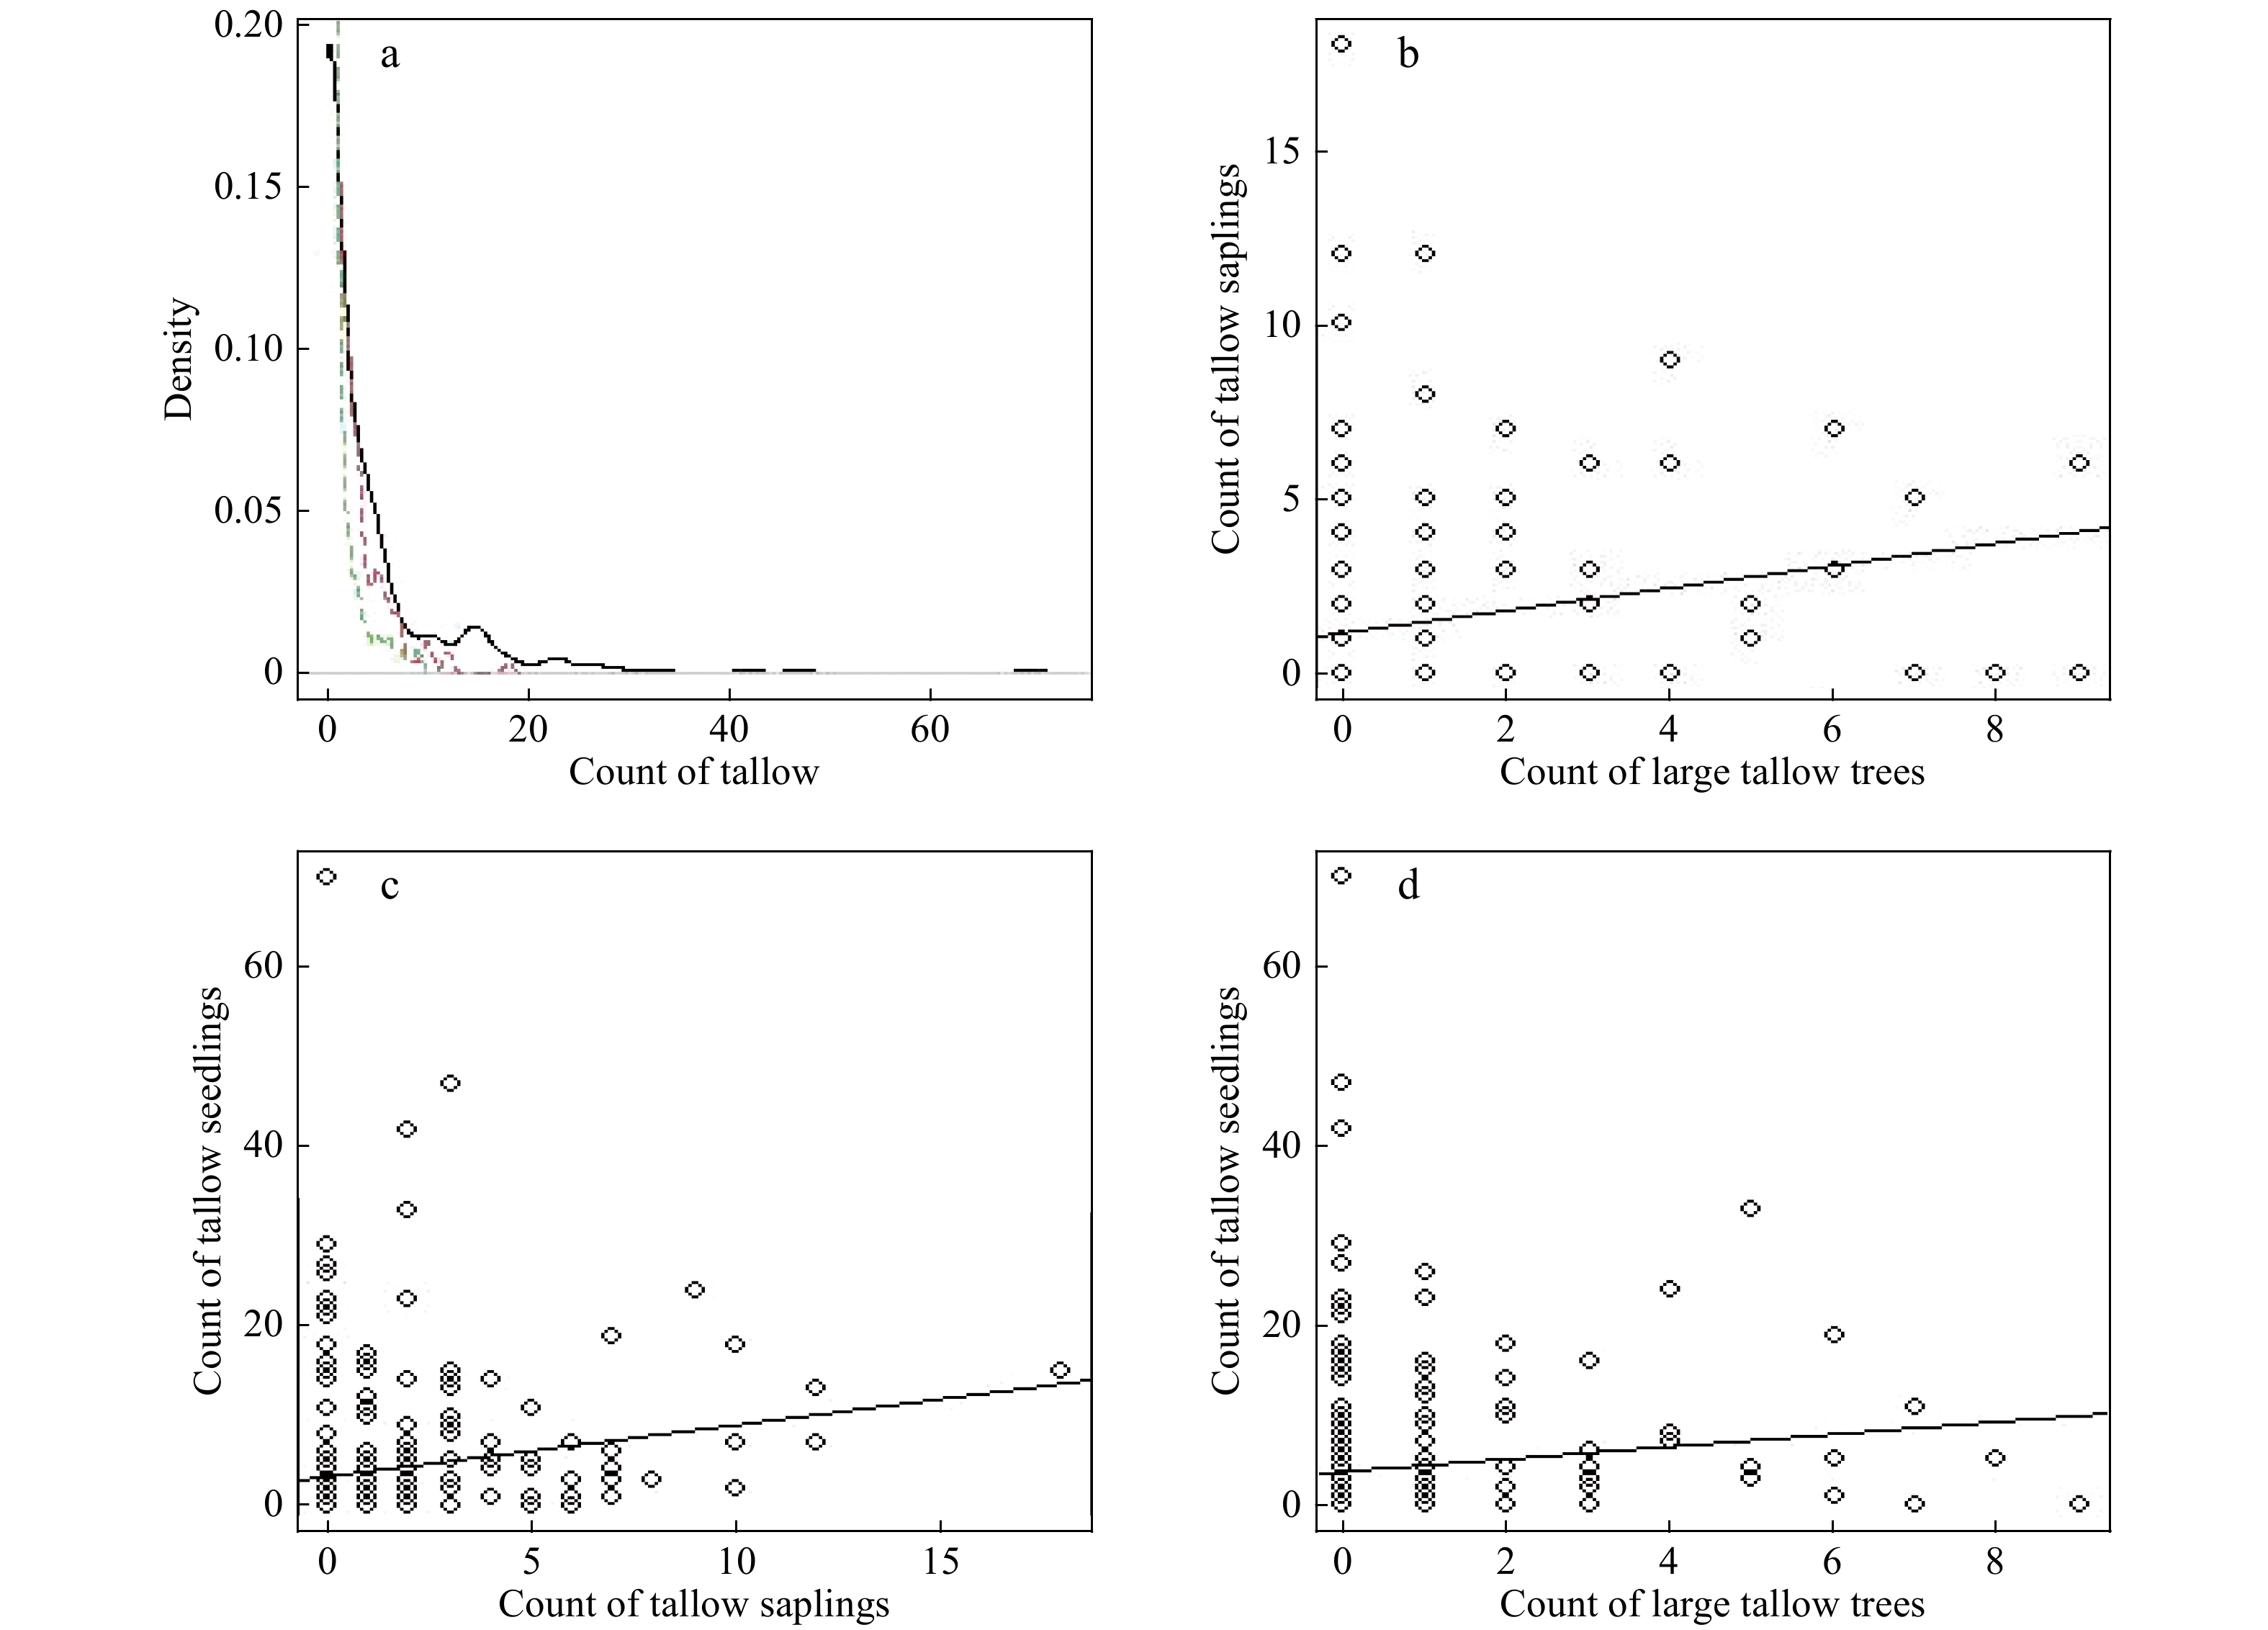
Figure 3. The smoothed probability density function (a, green dashed line: tallow tree, red dashed line: saplings, black line: seedlings) and the scatterplots (b-d) of tallow count in each quadrat by size class. The straight line represents the linear trend line.
-
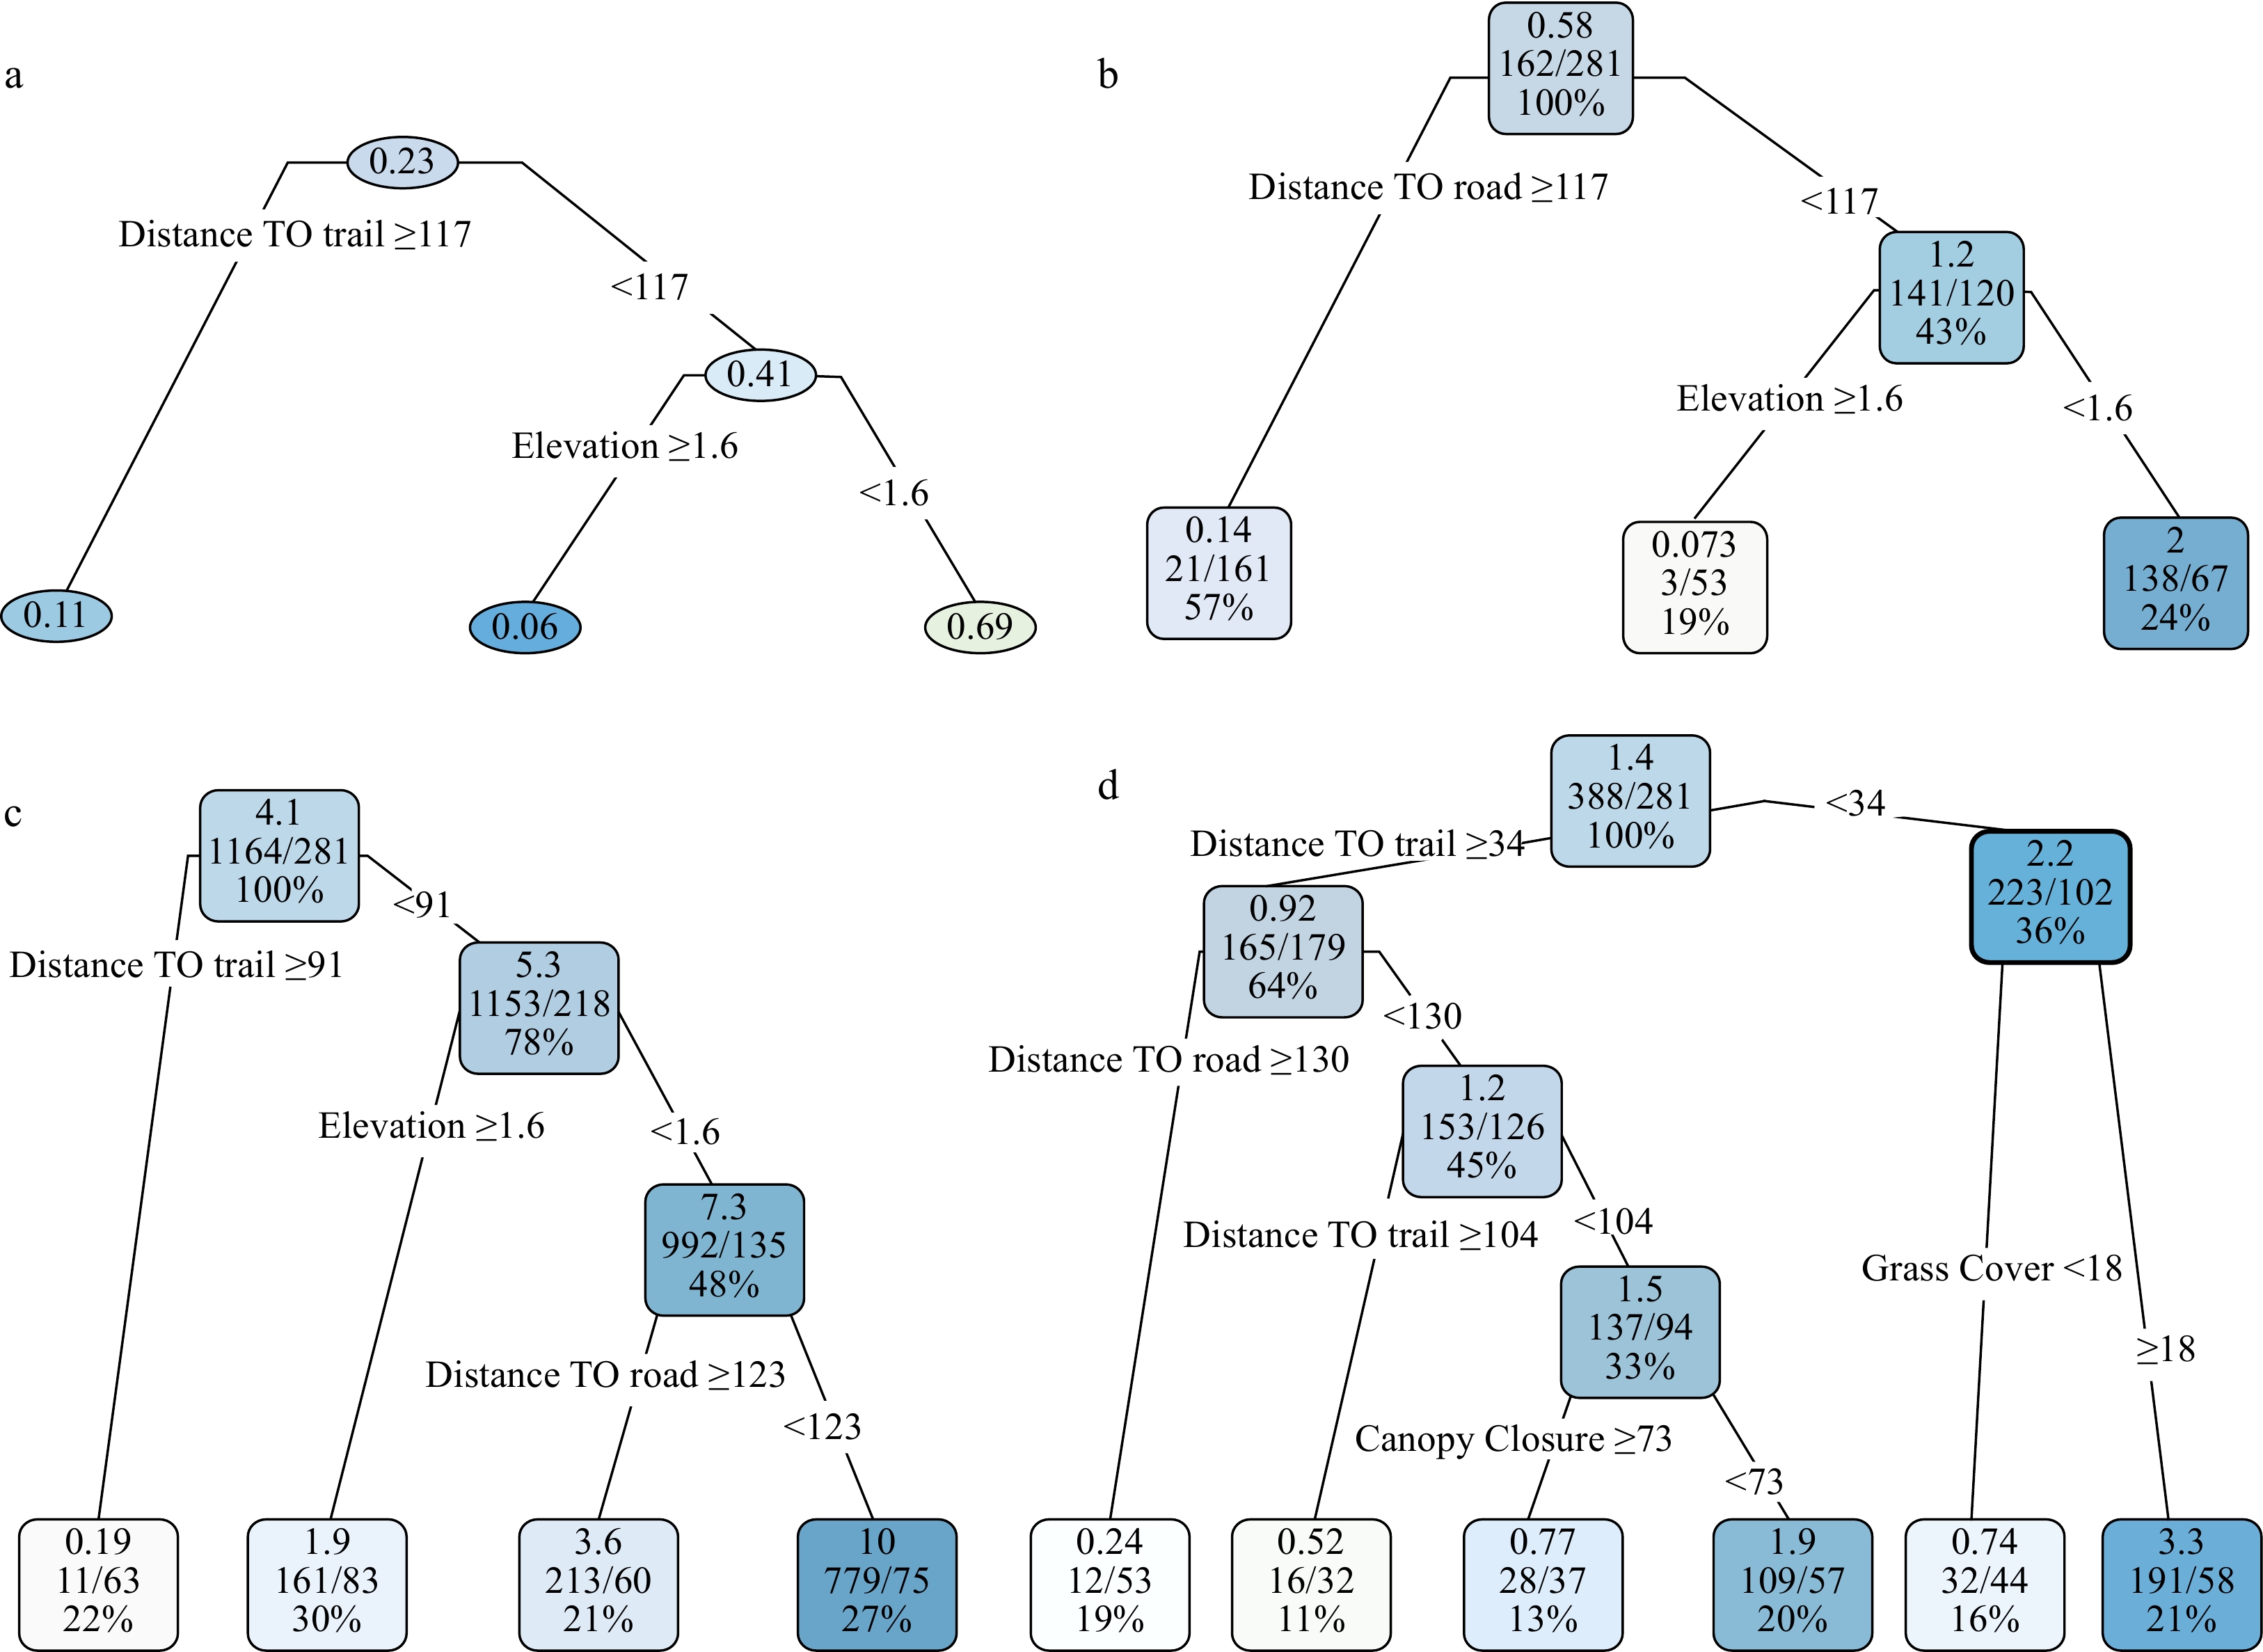
Figure 4. The presence probability (a) and invasion degree CART models (b-d) for tallow by size class (b: large tallow; c: seedling; d: sapling). The number in each node in Fig. a represents invasion probability among the quadrats that meet the splitting criteria. The top, middle and bottom numbers in each node in Fig. b-d represent the average number of tallow trees in a quadrat, total number of tallow trees/total number of quadrats, and the proportion of quadrats falling within a node.
-
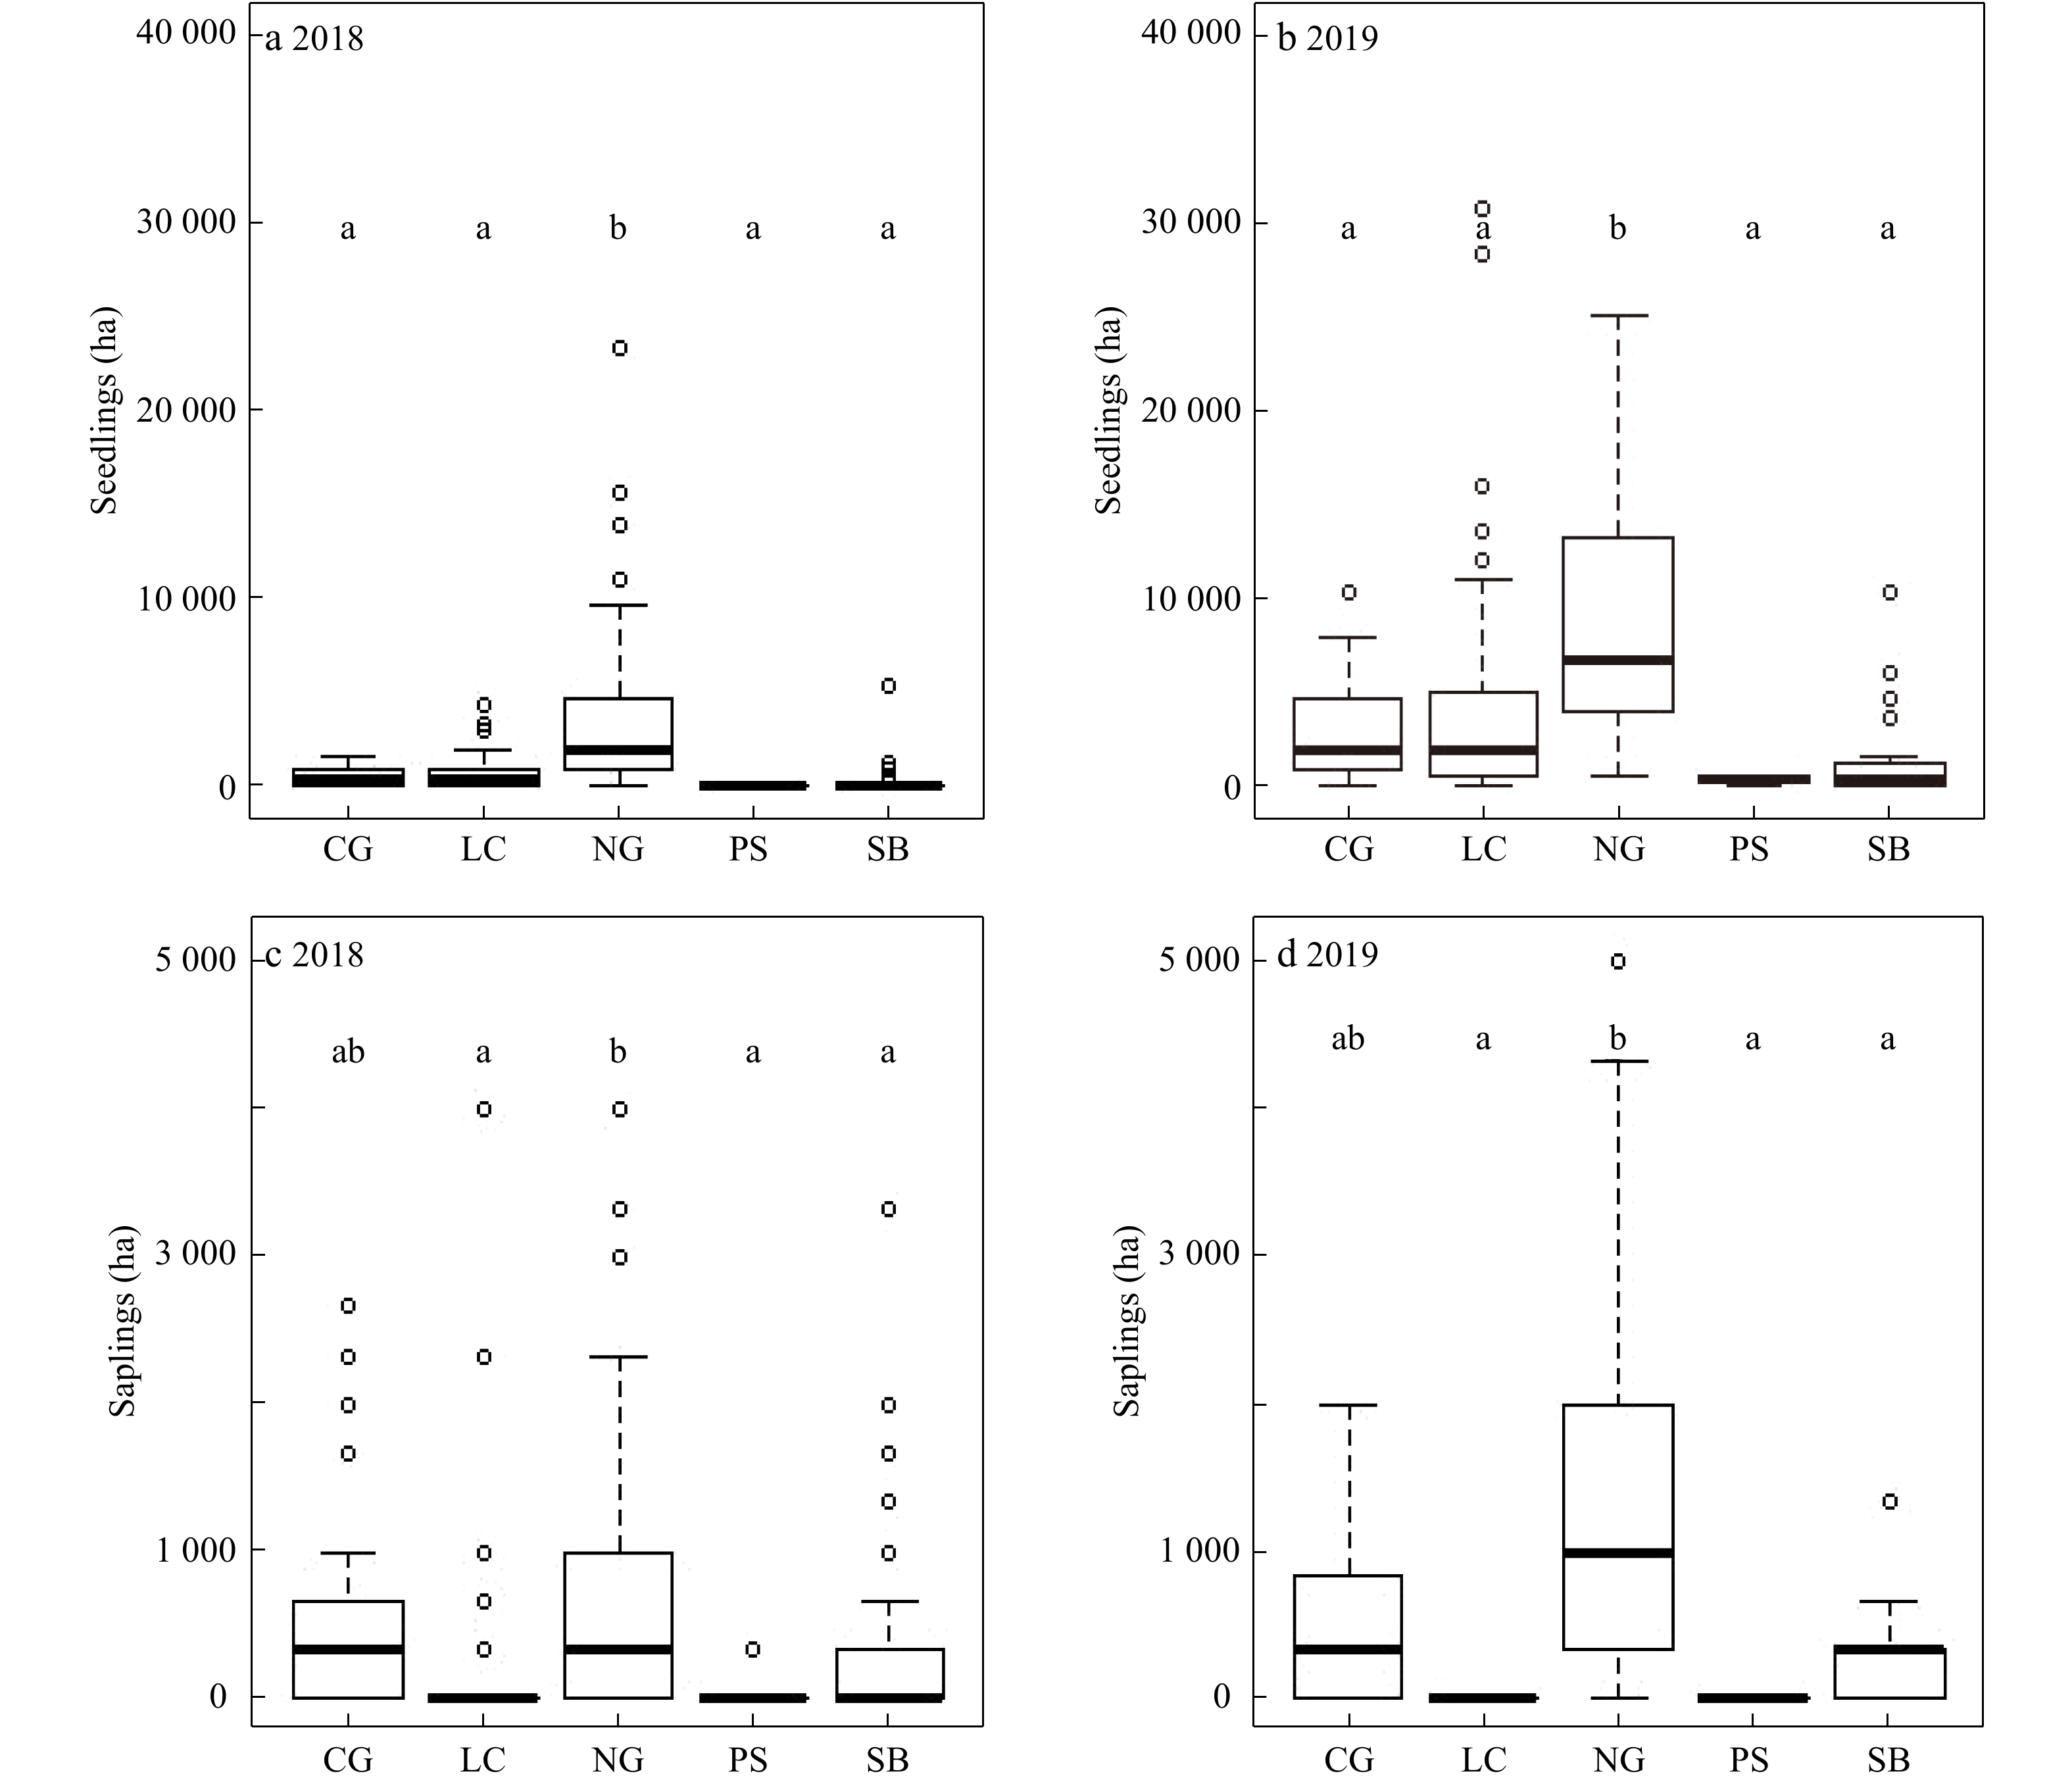
Figure 5. Changes of tallow seedlings and saplings by understory vegetation cover type (CG=cogongrass, LC=litter covered, NG=native grass, PS=pine sapling, and SB=native shrub) before (2018) and after (2019) the prescribed burn in the slash pine flatwood in the Grand Bay National Wildlife Refuge.
-
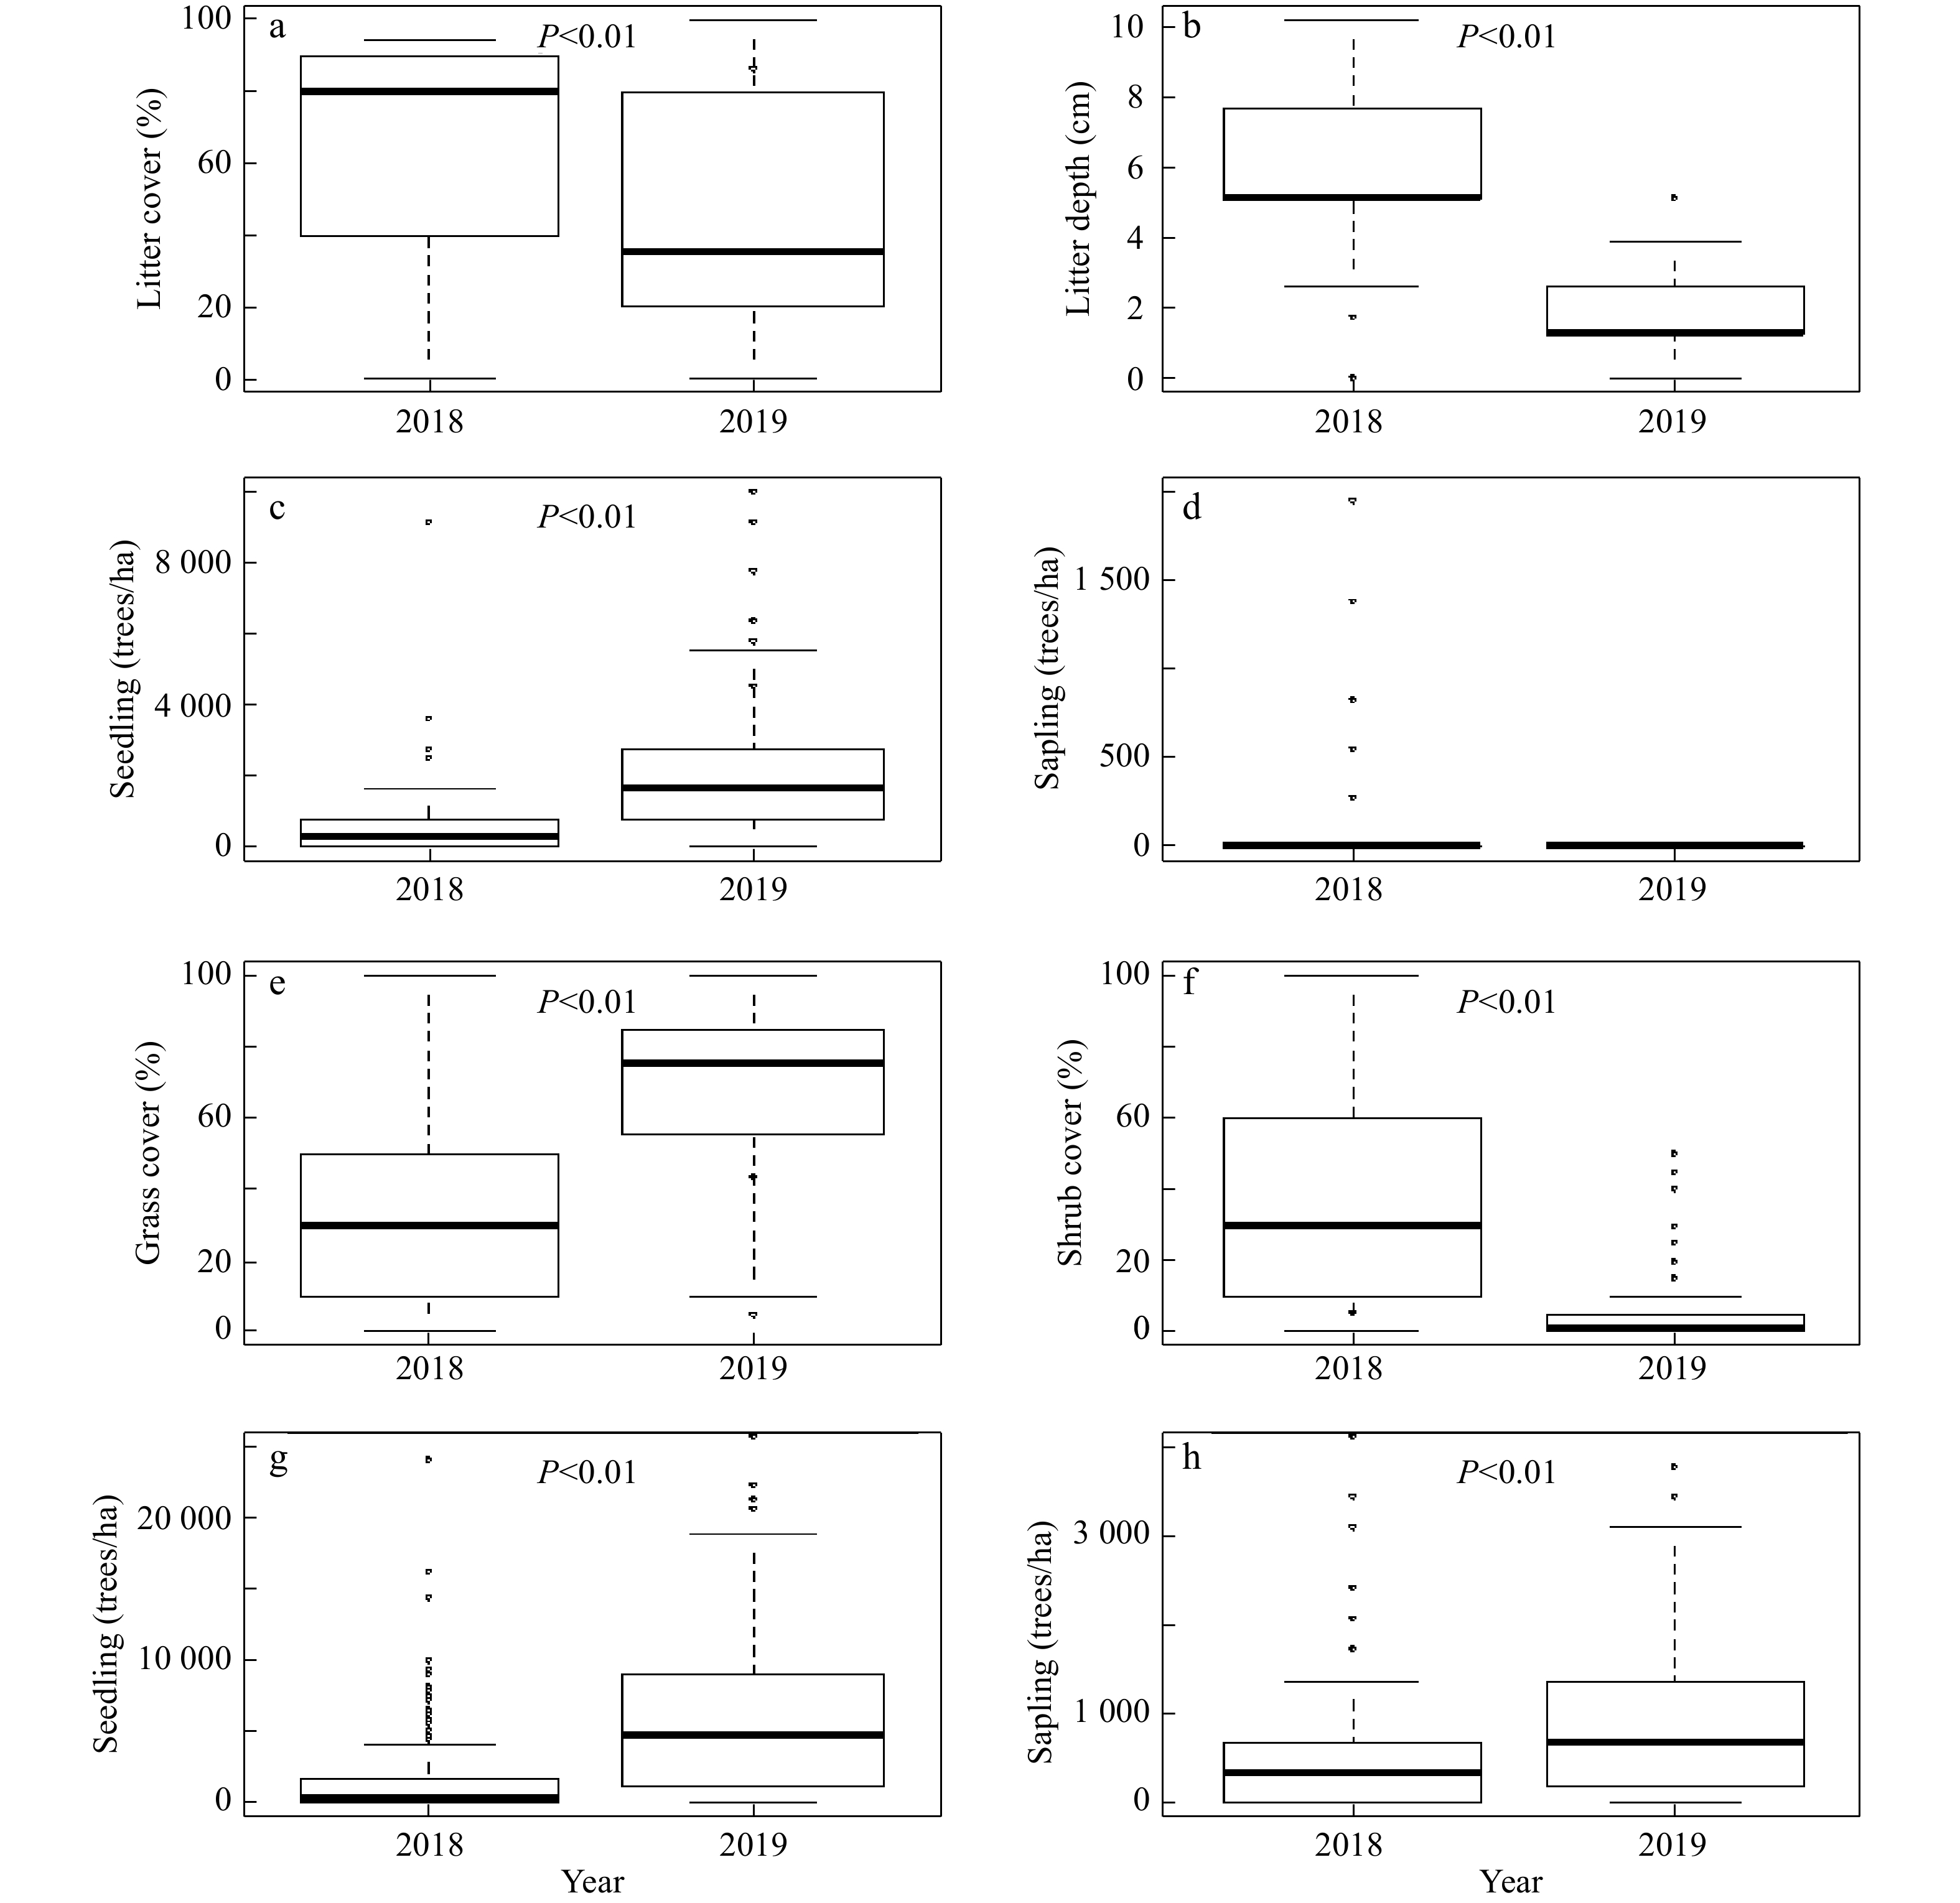
Figure 6. Changes of understory vegetation conditions and tallow seedlings and saplings where hardwoods dominated the overstory (a-d) and where pines dominated the overstory (e-h) before (2018) and after (2019) the prescribed burn in the slash pine flatwood in the Grand Bay National Wildlife Refuge.
Figures
(6)
Tables
(0)