-
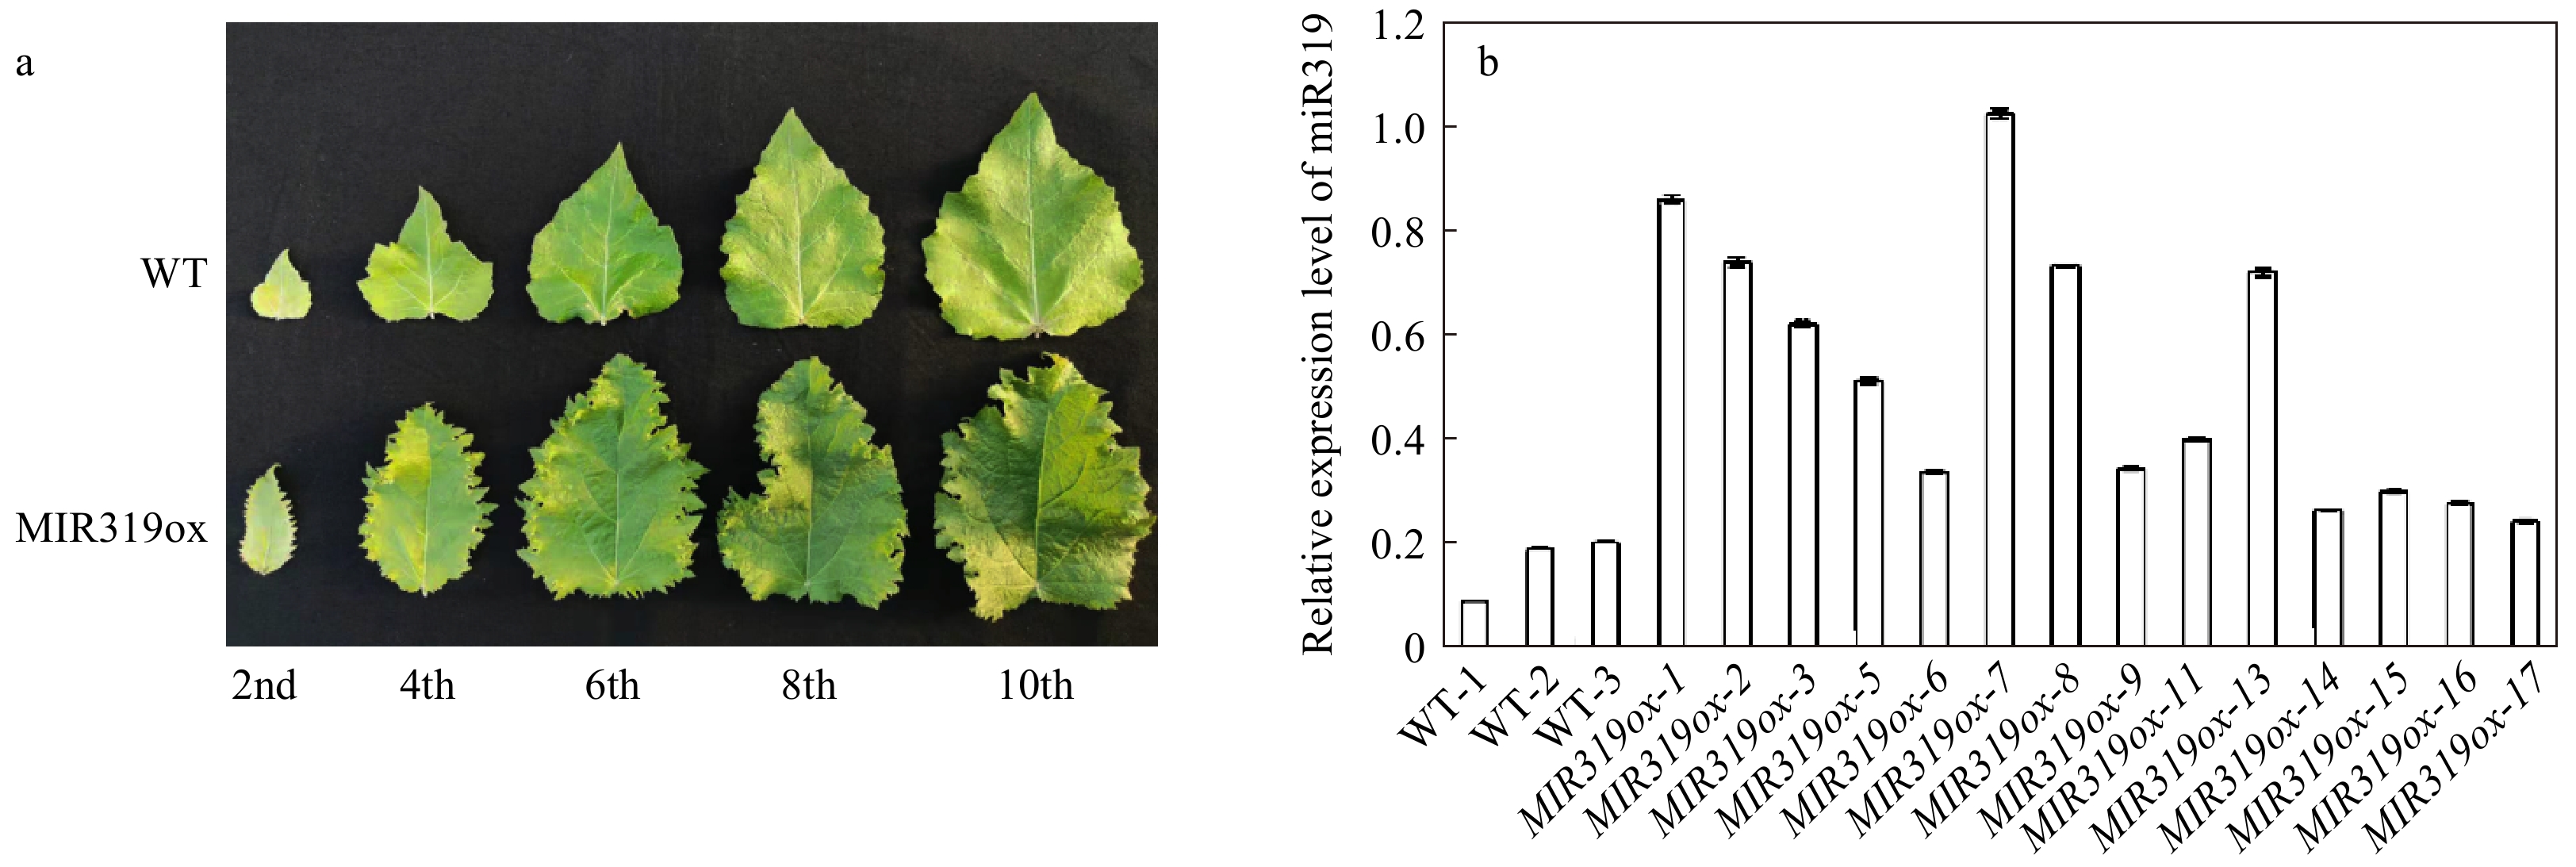
Figure 1. Phenotypic characterizations of MIR319a over-expression transgenic polar lines. (a) Leaves from MIR319a over-expression transgenic lines and WT. The 2nd, 4th, 6th, 8th, and 10th represent the second, fourth, sixth, eighth and tenth leaves counted from the apical bud of MIR319a over-expression transgenic poplar plants, respectively. (b) The expression levels of miR319a in WT and 14 transgenic lines measured by qRT-PCR with three technical replicates.
-
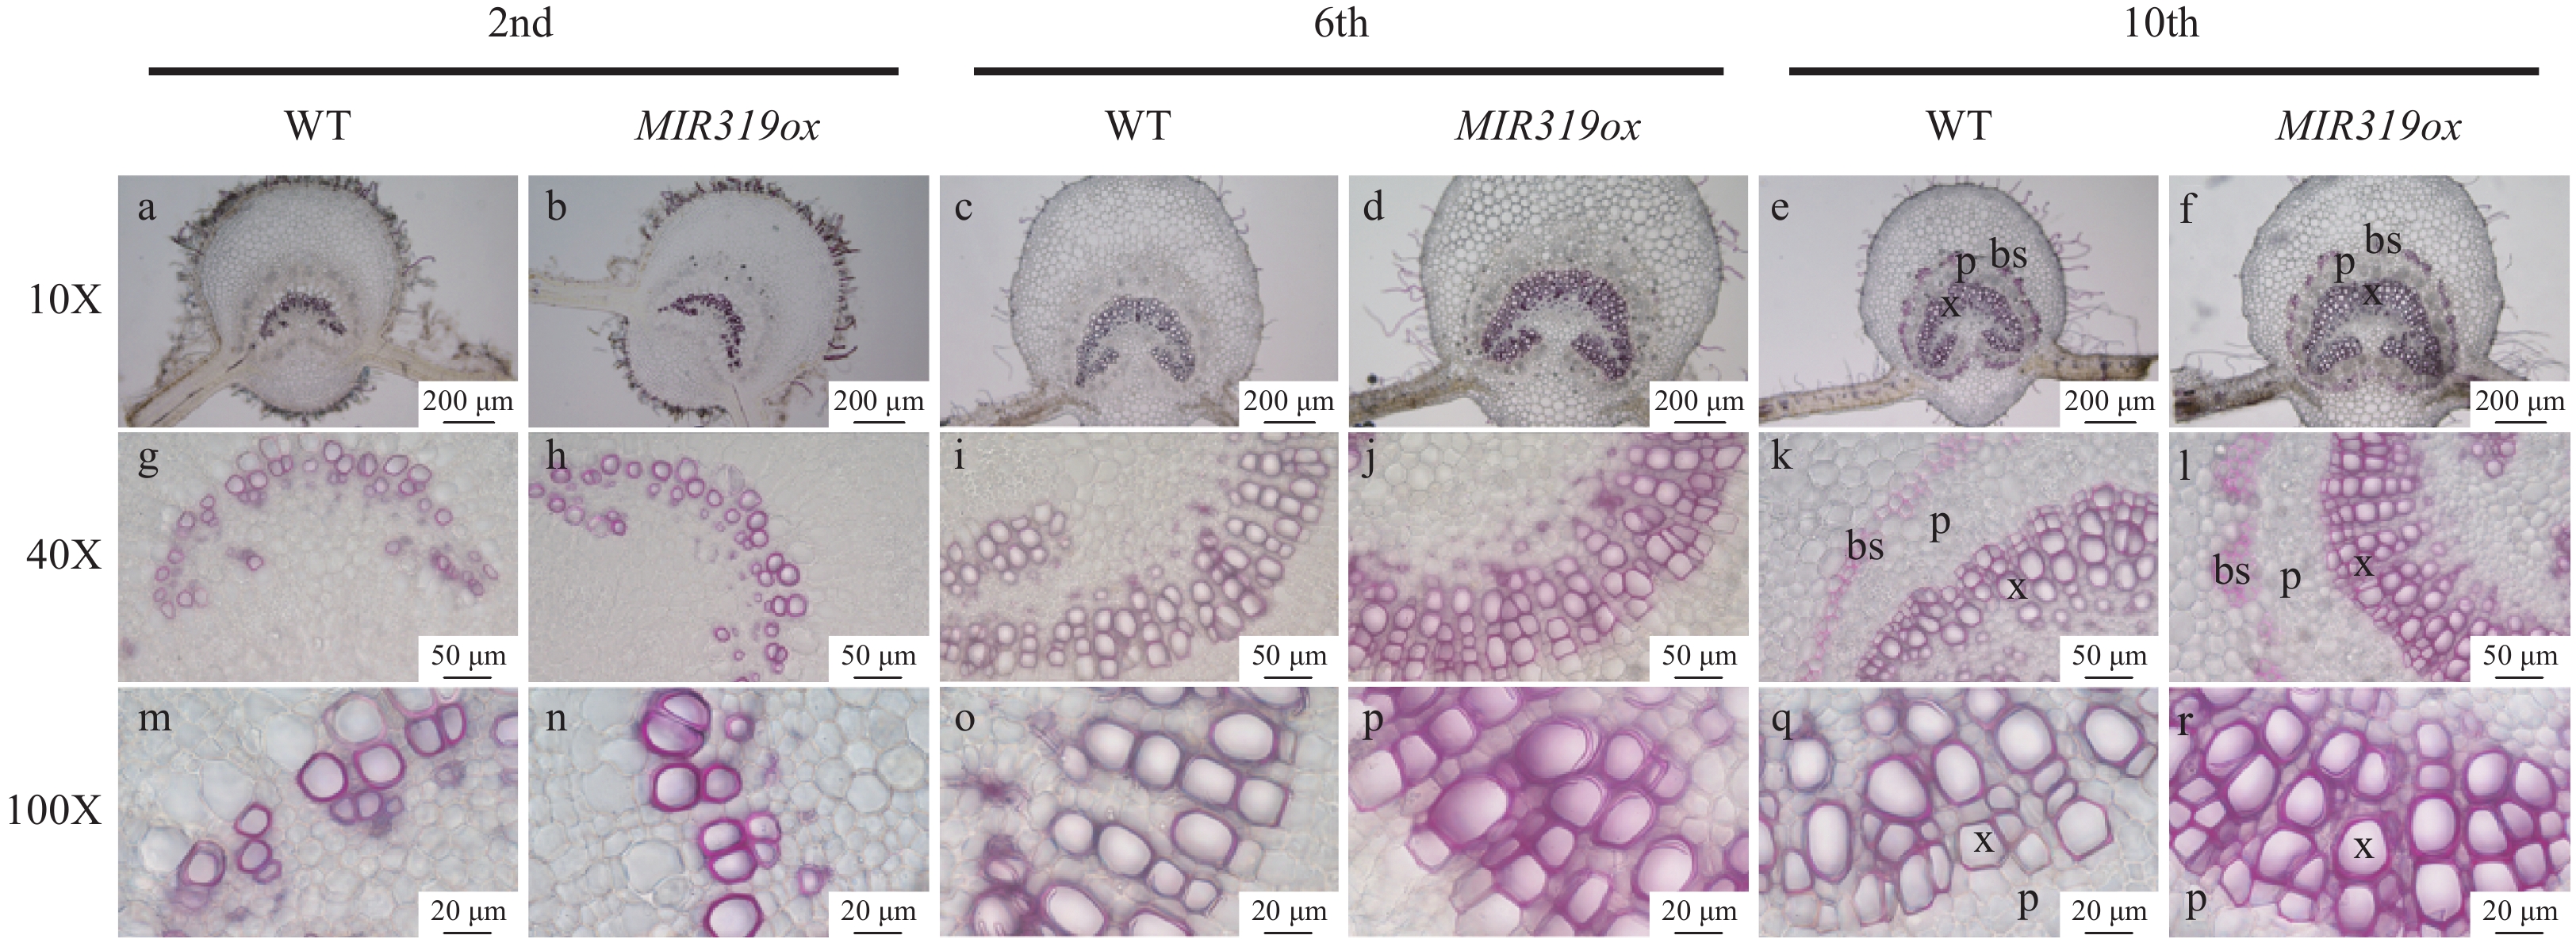
Figure 2. The vascular bundle and bundle sheath cells on microscopic leaf cross sections stained with phloroglucinol HCl in MIR319a over-expression transgenic lines and WT. The leaves were from the second, sixth and tenth stem nodes, respectively. The photos were taken at 10X, 40X and 100X. Bars in a−f: 200 μm, g−l: 50 μm, m−r: 20 μm. x, p and bs represent xylem, phloem and bundle sheath, respectively.
-
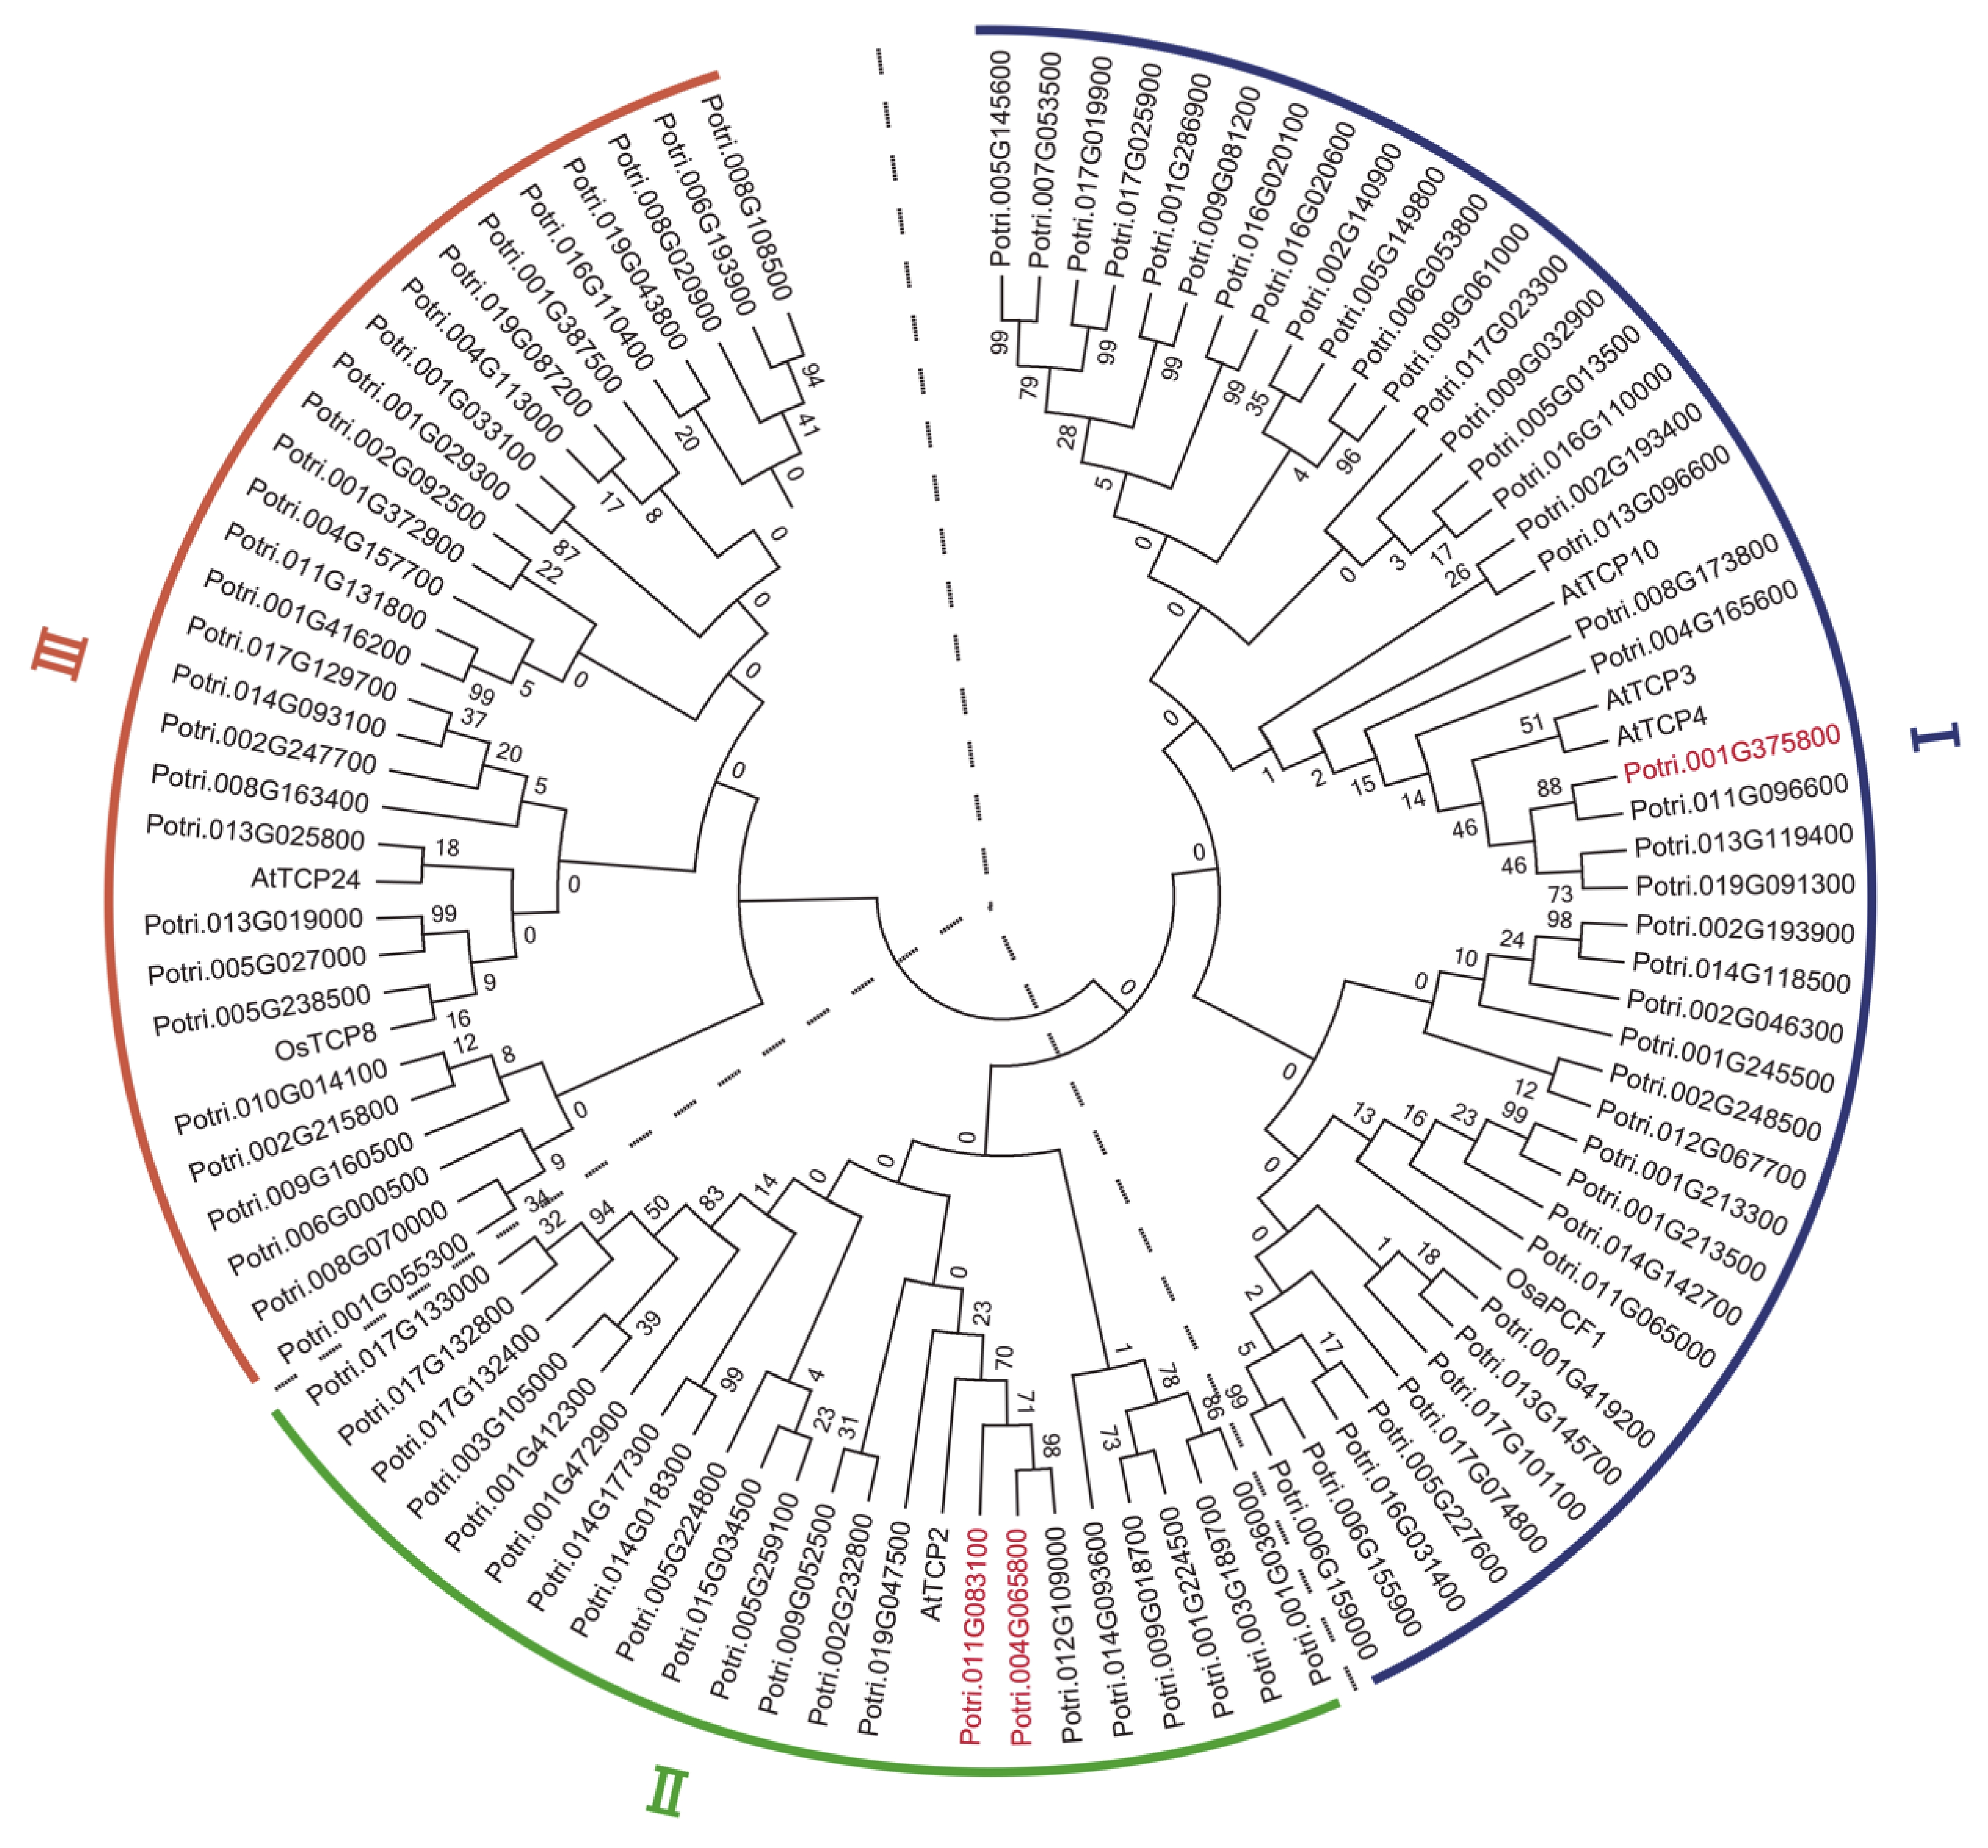
Figure 3. Phylogenetic tree constructed with the protein sequences of 93 putative target genes of miR319a in Populus trichocarpa, 5 from Arabidopsis and 2 from rice. A neighbor-joining (NJ) method in MEGA7.0 was used to generate the tree. The tree consists of 3 distinct clades. The proteins whose genes were differentially expressed genes (DEGs) are highlighted in red.
-
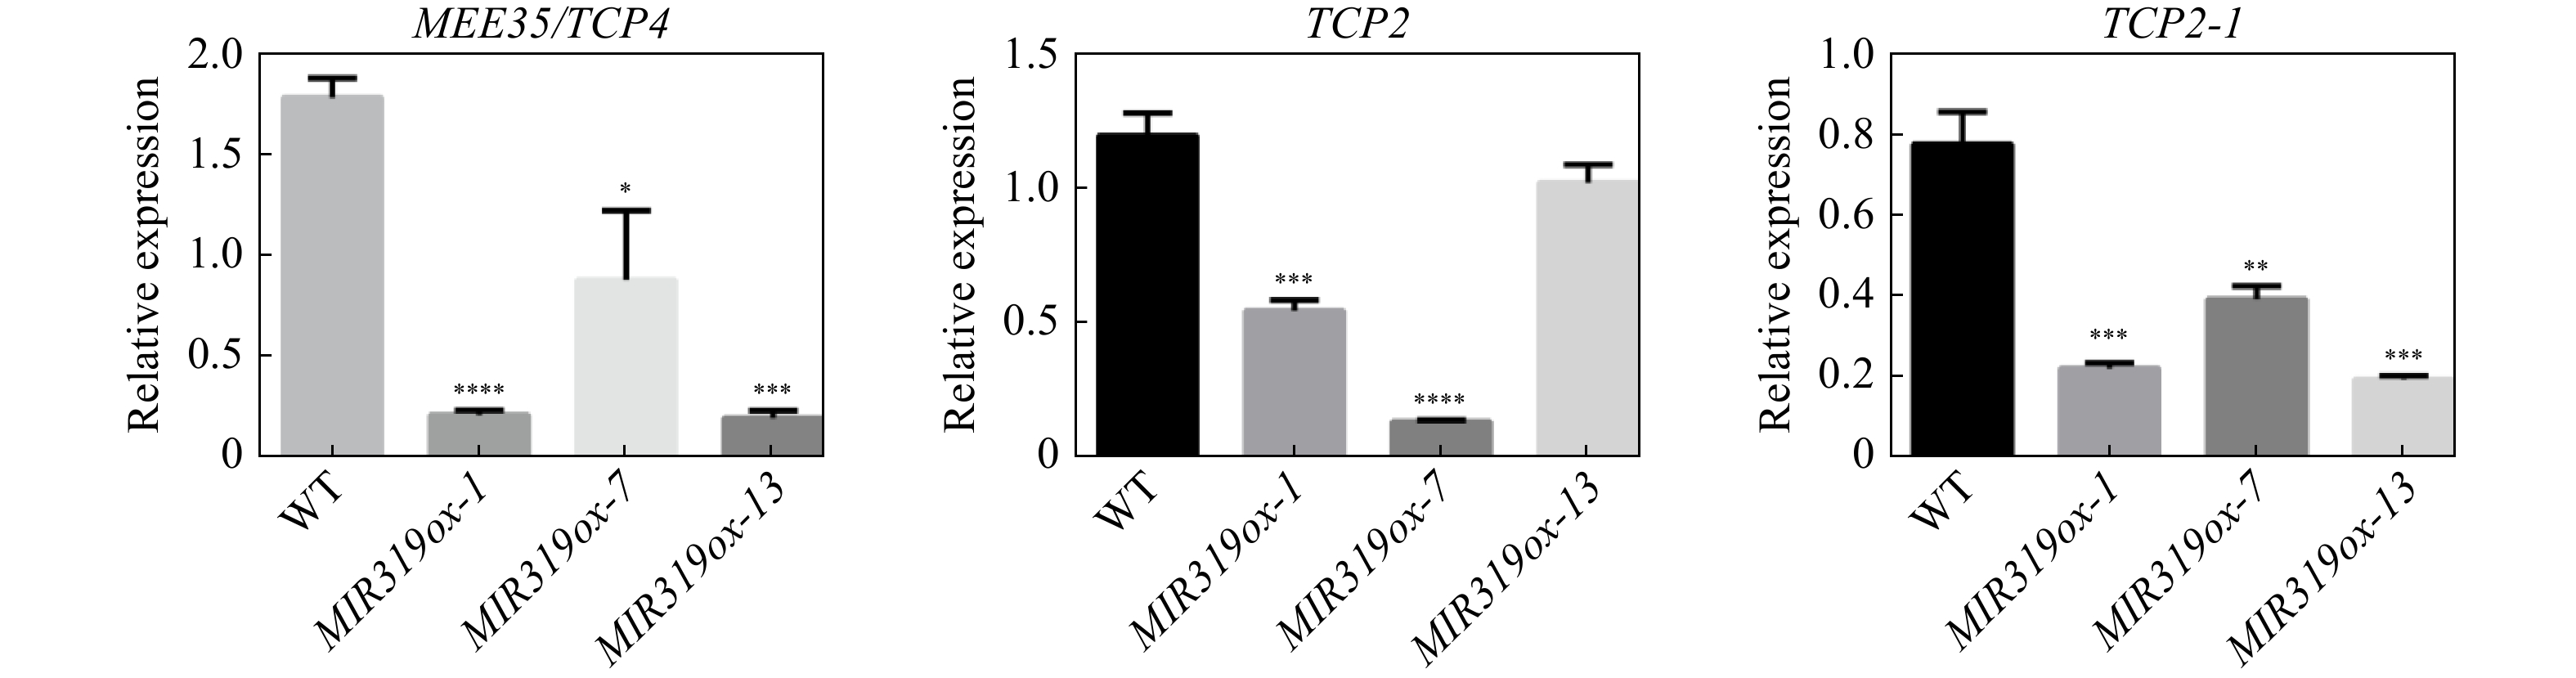
Figure 4. Expression levels of MEE35/TCP4, TCP2 and TCP2-1 determined by qRT-PCR in MIR319a over-expression transgenic leaves and WT.
-
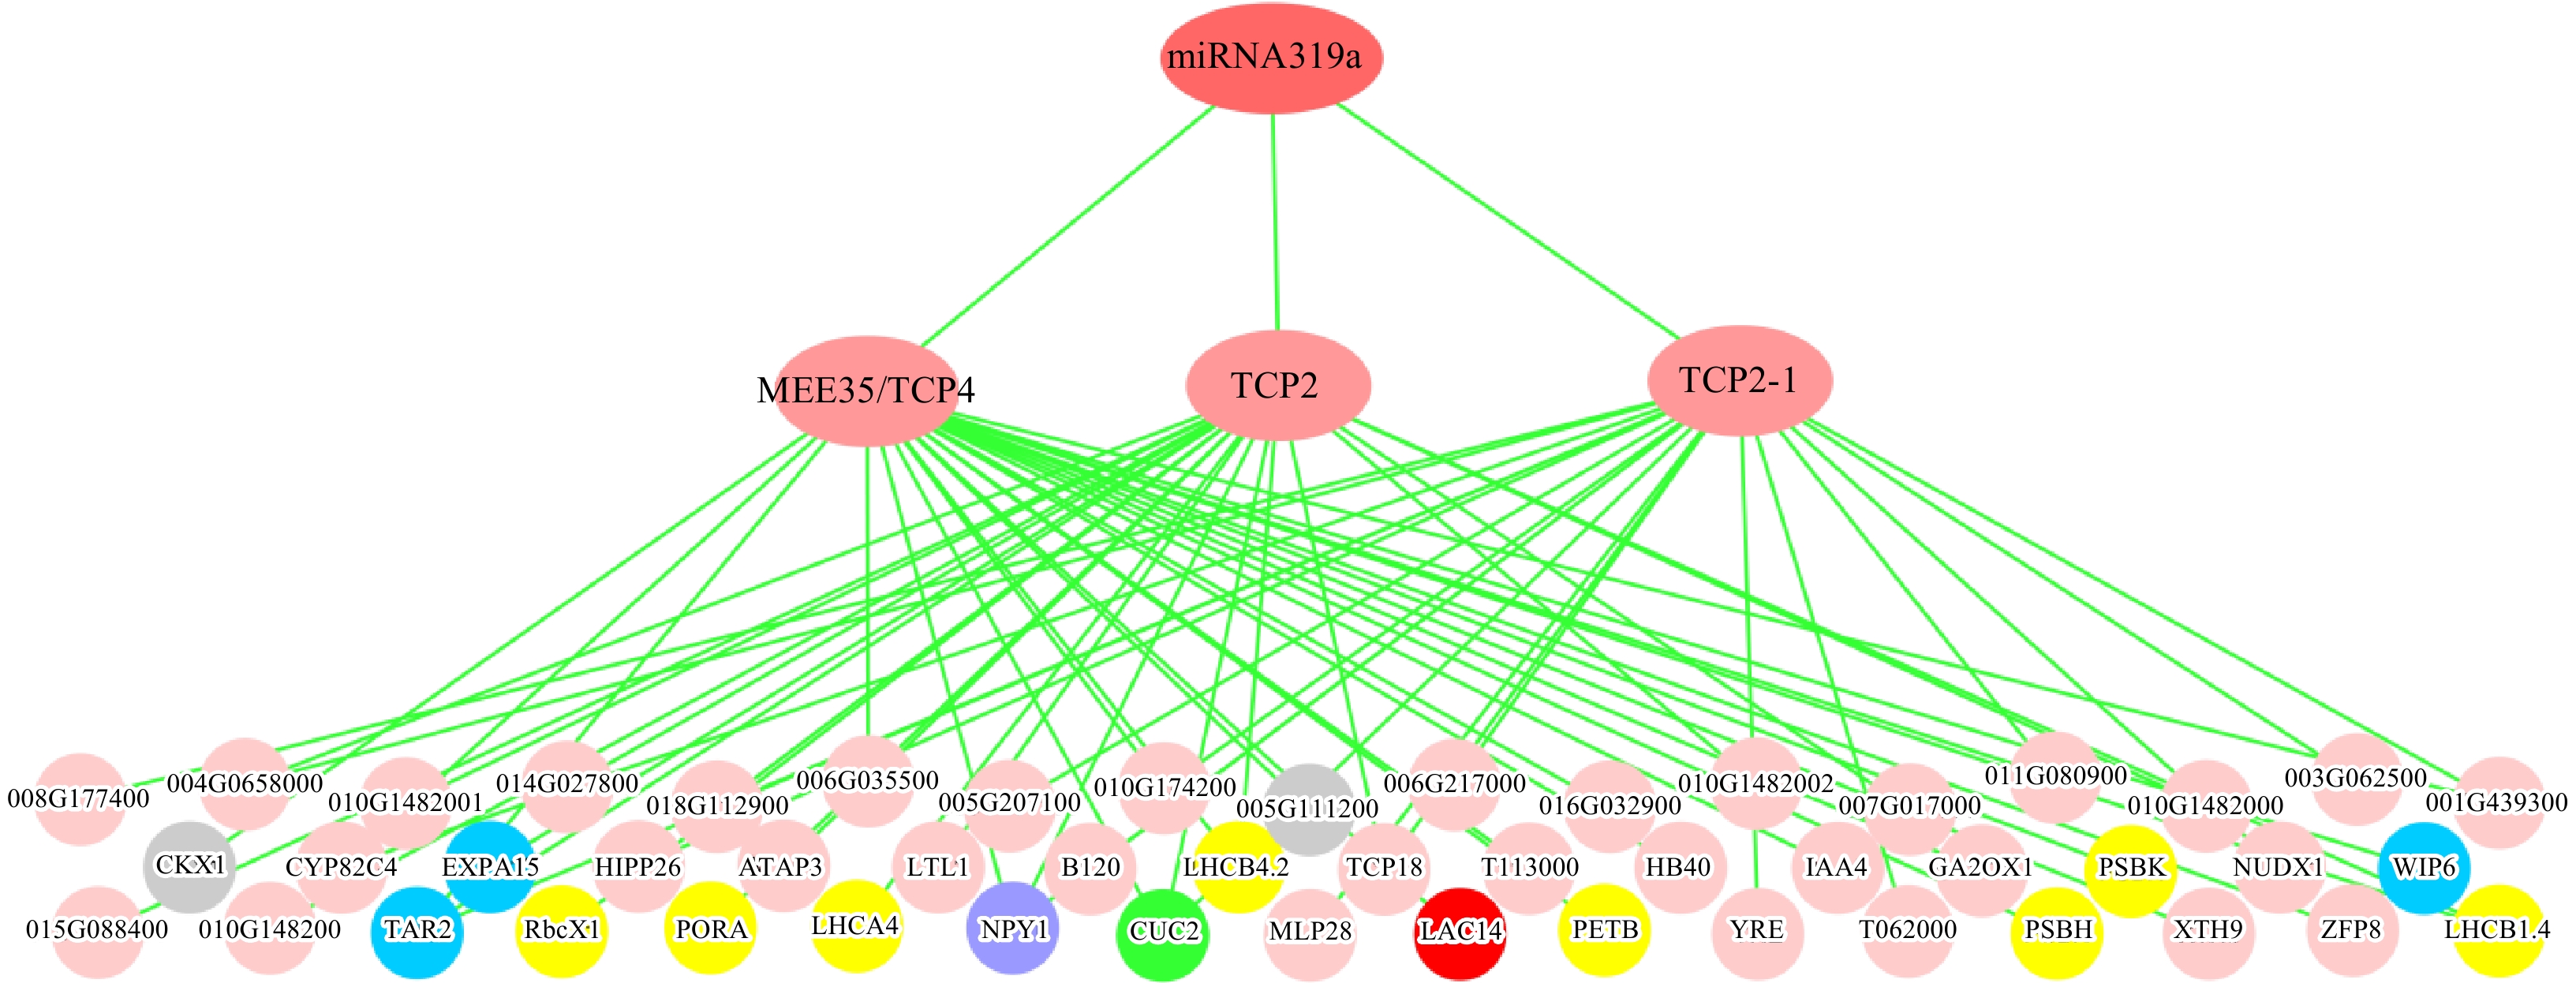
Figure 5. Three-layered hierarchical gene regulatory network under the control of miR319a in the leaves of P. alba × P. glandulosa. The green circle represents the leaf development gene, blue circles represent phloem or xylem histogenesis genes, the purple circle represents the phyllome development gene, gray circles represent xylem development genes, the red circle represents the lignin biosynthesis gene, and yellow circles represent photosynthesis genes. The gene IDs are provided in Supplemental Table 5.
-
GO_Term GO ID p-value Average FC* Chlorophyll biosynthetic process GO:0015995 0.000195 −1.6598 chlorophyll metabolic process GO:0015994 0.000548 −1.1459 Photosynthetic electron transport in photosystem I GO:0009773 5.77E-08 −1.3109 Photosynthetic electron transport in photosystem II GO:0009772 0.000129 −1.4662 Electron transport chain GO:0022900 9.89E-08 1.2090 Leaf development GO:0048366 0.006600 1.1968 Phyllome development GO:0048827 0.001743 −1.4103 Meristem development GO:0048507 0.000969 1.6703 Meristem maintenance GO:0010073 0.002897 1.4769 Regulation of meristem development GO:0048509 0.001992 1.419 Phloem or xylem histogenesis GO:0010087 0.000156 1.1578 Xylem development GO:0010089 0.012376 2.0586 Lignin catabolic process GO:0046274 0.015023 −3.0332 Lignin metabolic process GO:0009808 0.000747 2.1952 Auxin metabolic process GO:0009850 0.000685 1.6071 Tryptophan catabolic process GO:0006569 0.009640 3.3018 Gibberellin metabolic process GO:0009685 0.003229 4.7556 Gibberellin biosynthetic process GO:0009686 0.015585 1.5146 *FC represents an average expression fold change of all DEGs that are involved in a biological process represented by a gene ontology. Table 1. Gene ontology enrichment analysis of differentially expressed genes (DEGs) in MIR319a over-expression transgenics.
-
Domain Description No. of DEGs EnrichScore Average FC* IPR008543 Chloroplast Ycf2 2 0.000295 −3.8012 IPR001344 Chlorophyll A-B binding protein 17 2.27E-16 1.0013 IPR002628 Photosystem II manganese-stabilizing protein PsbO 1 0.005071 1.0415 IPR003375 Photosystem I reaction centre subunit IV/PsaE 2 2.64E-06 1.0408 IPR003685 Photosystem I protein PsaD 2 1.05E-05 1.0476 IPR009806 Photosystem II protein PsbW, class 2 2 2.59E-05 −1.028 IPR001056 Photosystem II phosphoprotein PsbH 3 1.23E-06 −2.2731 IPR003754 Tetrapyrrole biosynthesis, uroporphyrinogen III synthase 1 0.0001913 −1.0524 IPR005150 Cellulose synthase 9 1.38E-06 1.5418 IPR001246 Lipoxygenase, plant 3 0.000962 1.1511 *FC represents average expression fold changes of all DEGs whose protein sequences have a specific protein domain. Table 2. Protein domains that were enriched in DEGs in MIR319a over-expression transgenics.
Figures
(5)
Tables
(2)