-
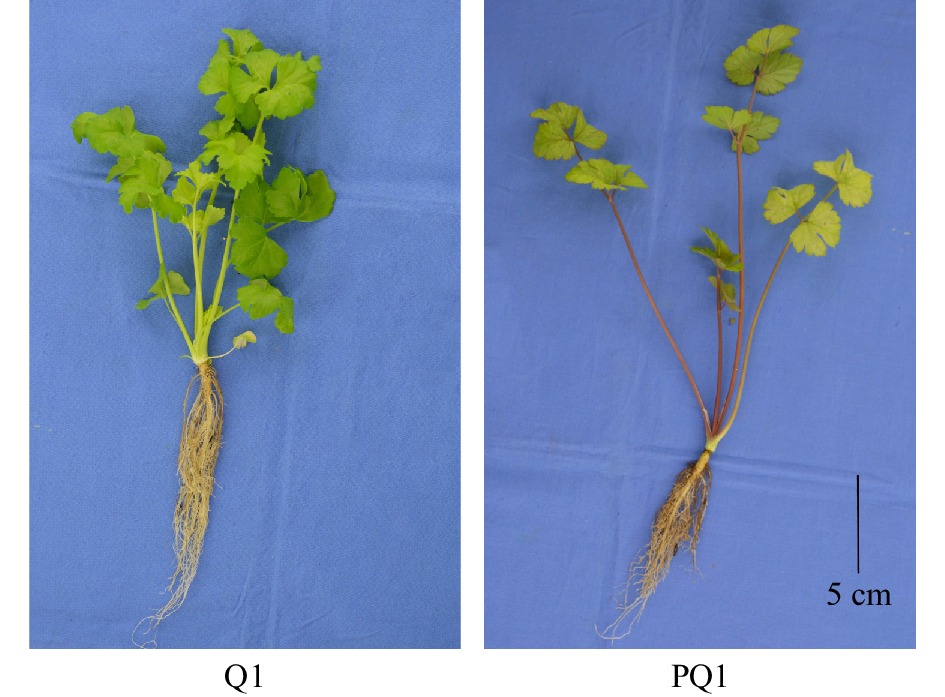
Figure 1. Phenotypes of different celery varieties. The black line at the right corner represents 5 cm in that pixel. Q1, ‘Liuhe huangxin celery’; PQ1, ‘Nanxuan liuhe purple celery’.
-
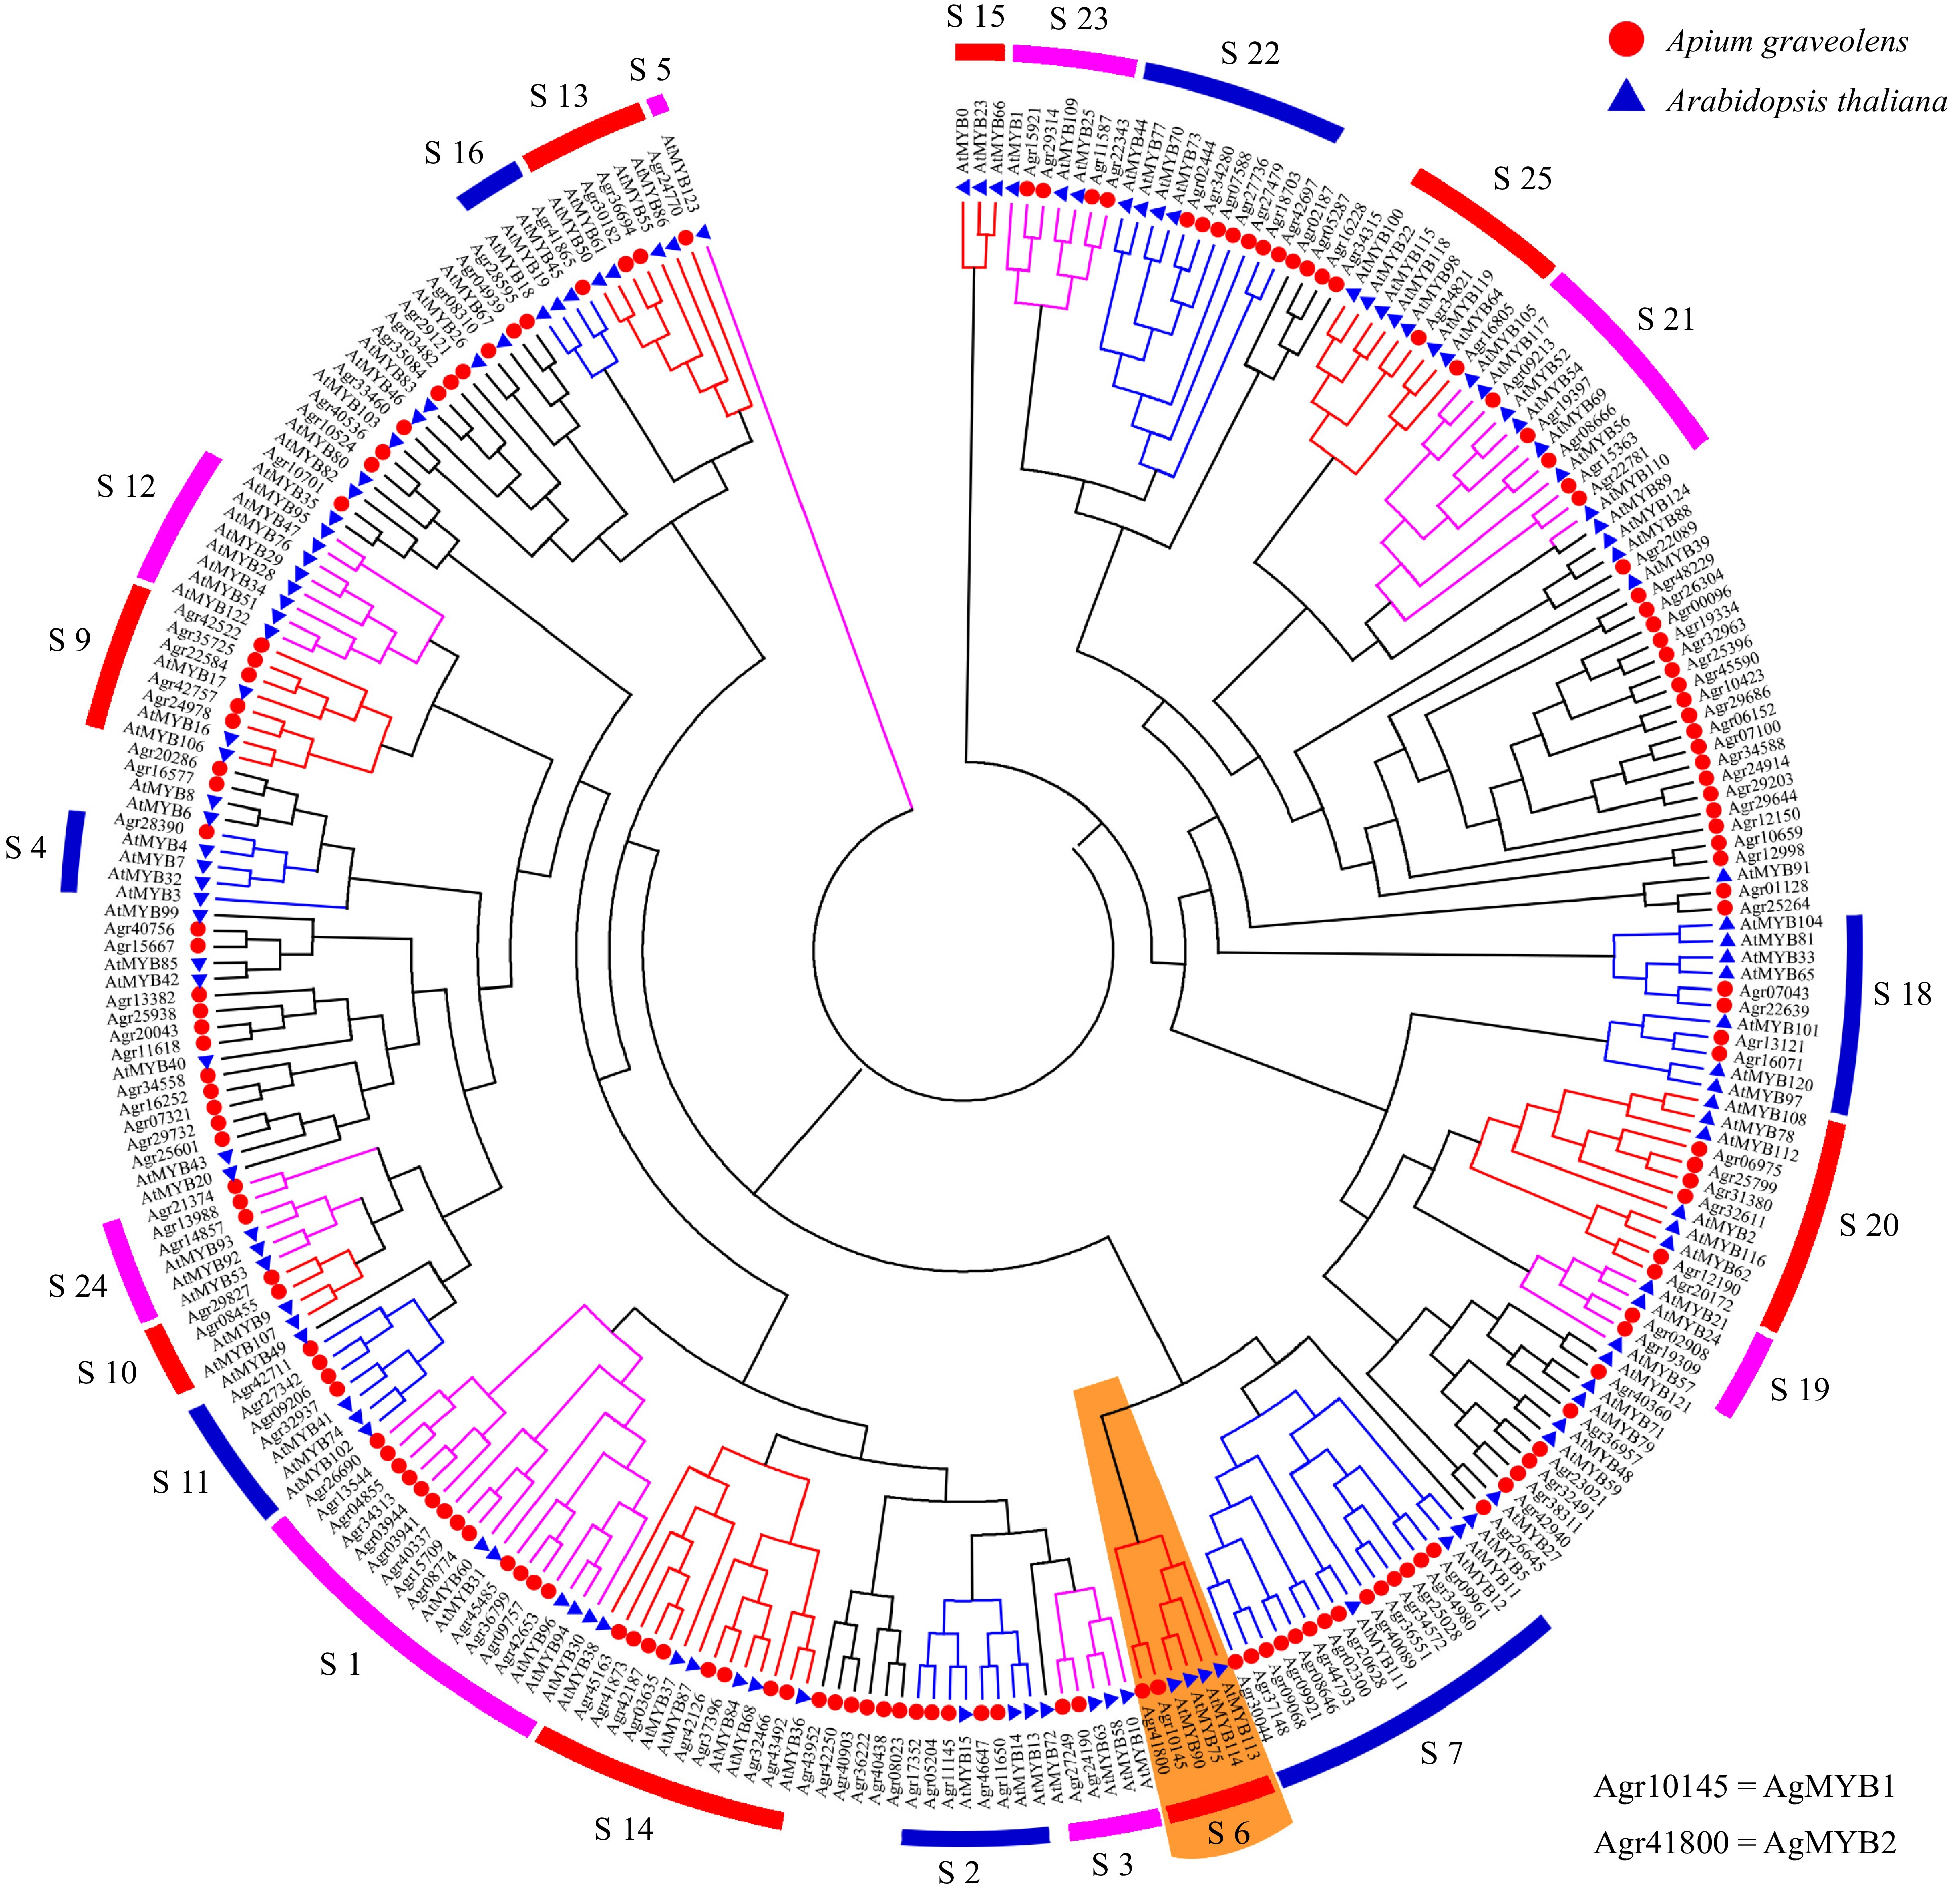
Figure 2. Phylogenetic tree of MYB transcription factors from celery and Arabidopsis. Different subgroups are represented using different colors. The S6 subgroup is shaded orange.
-
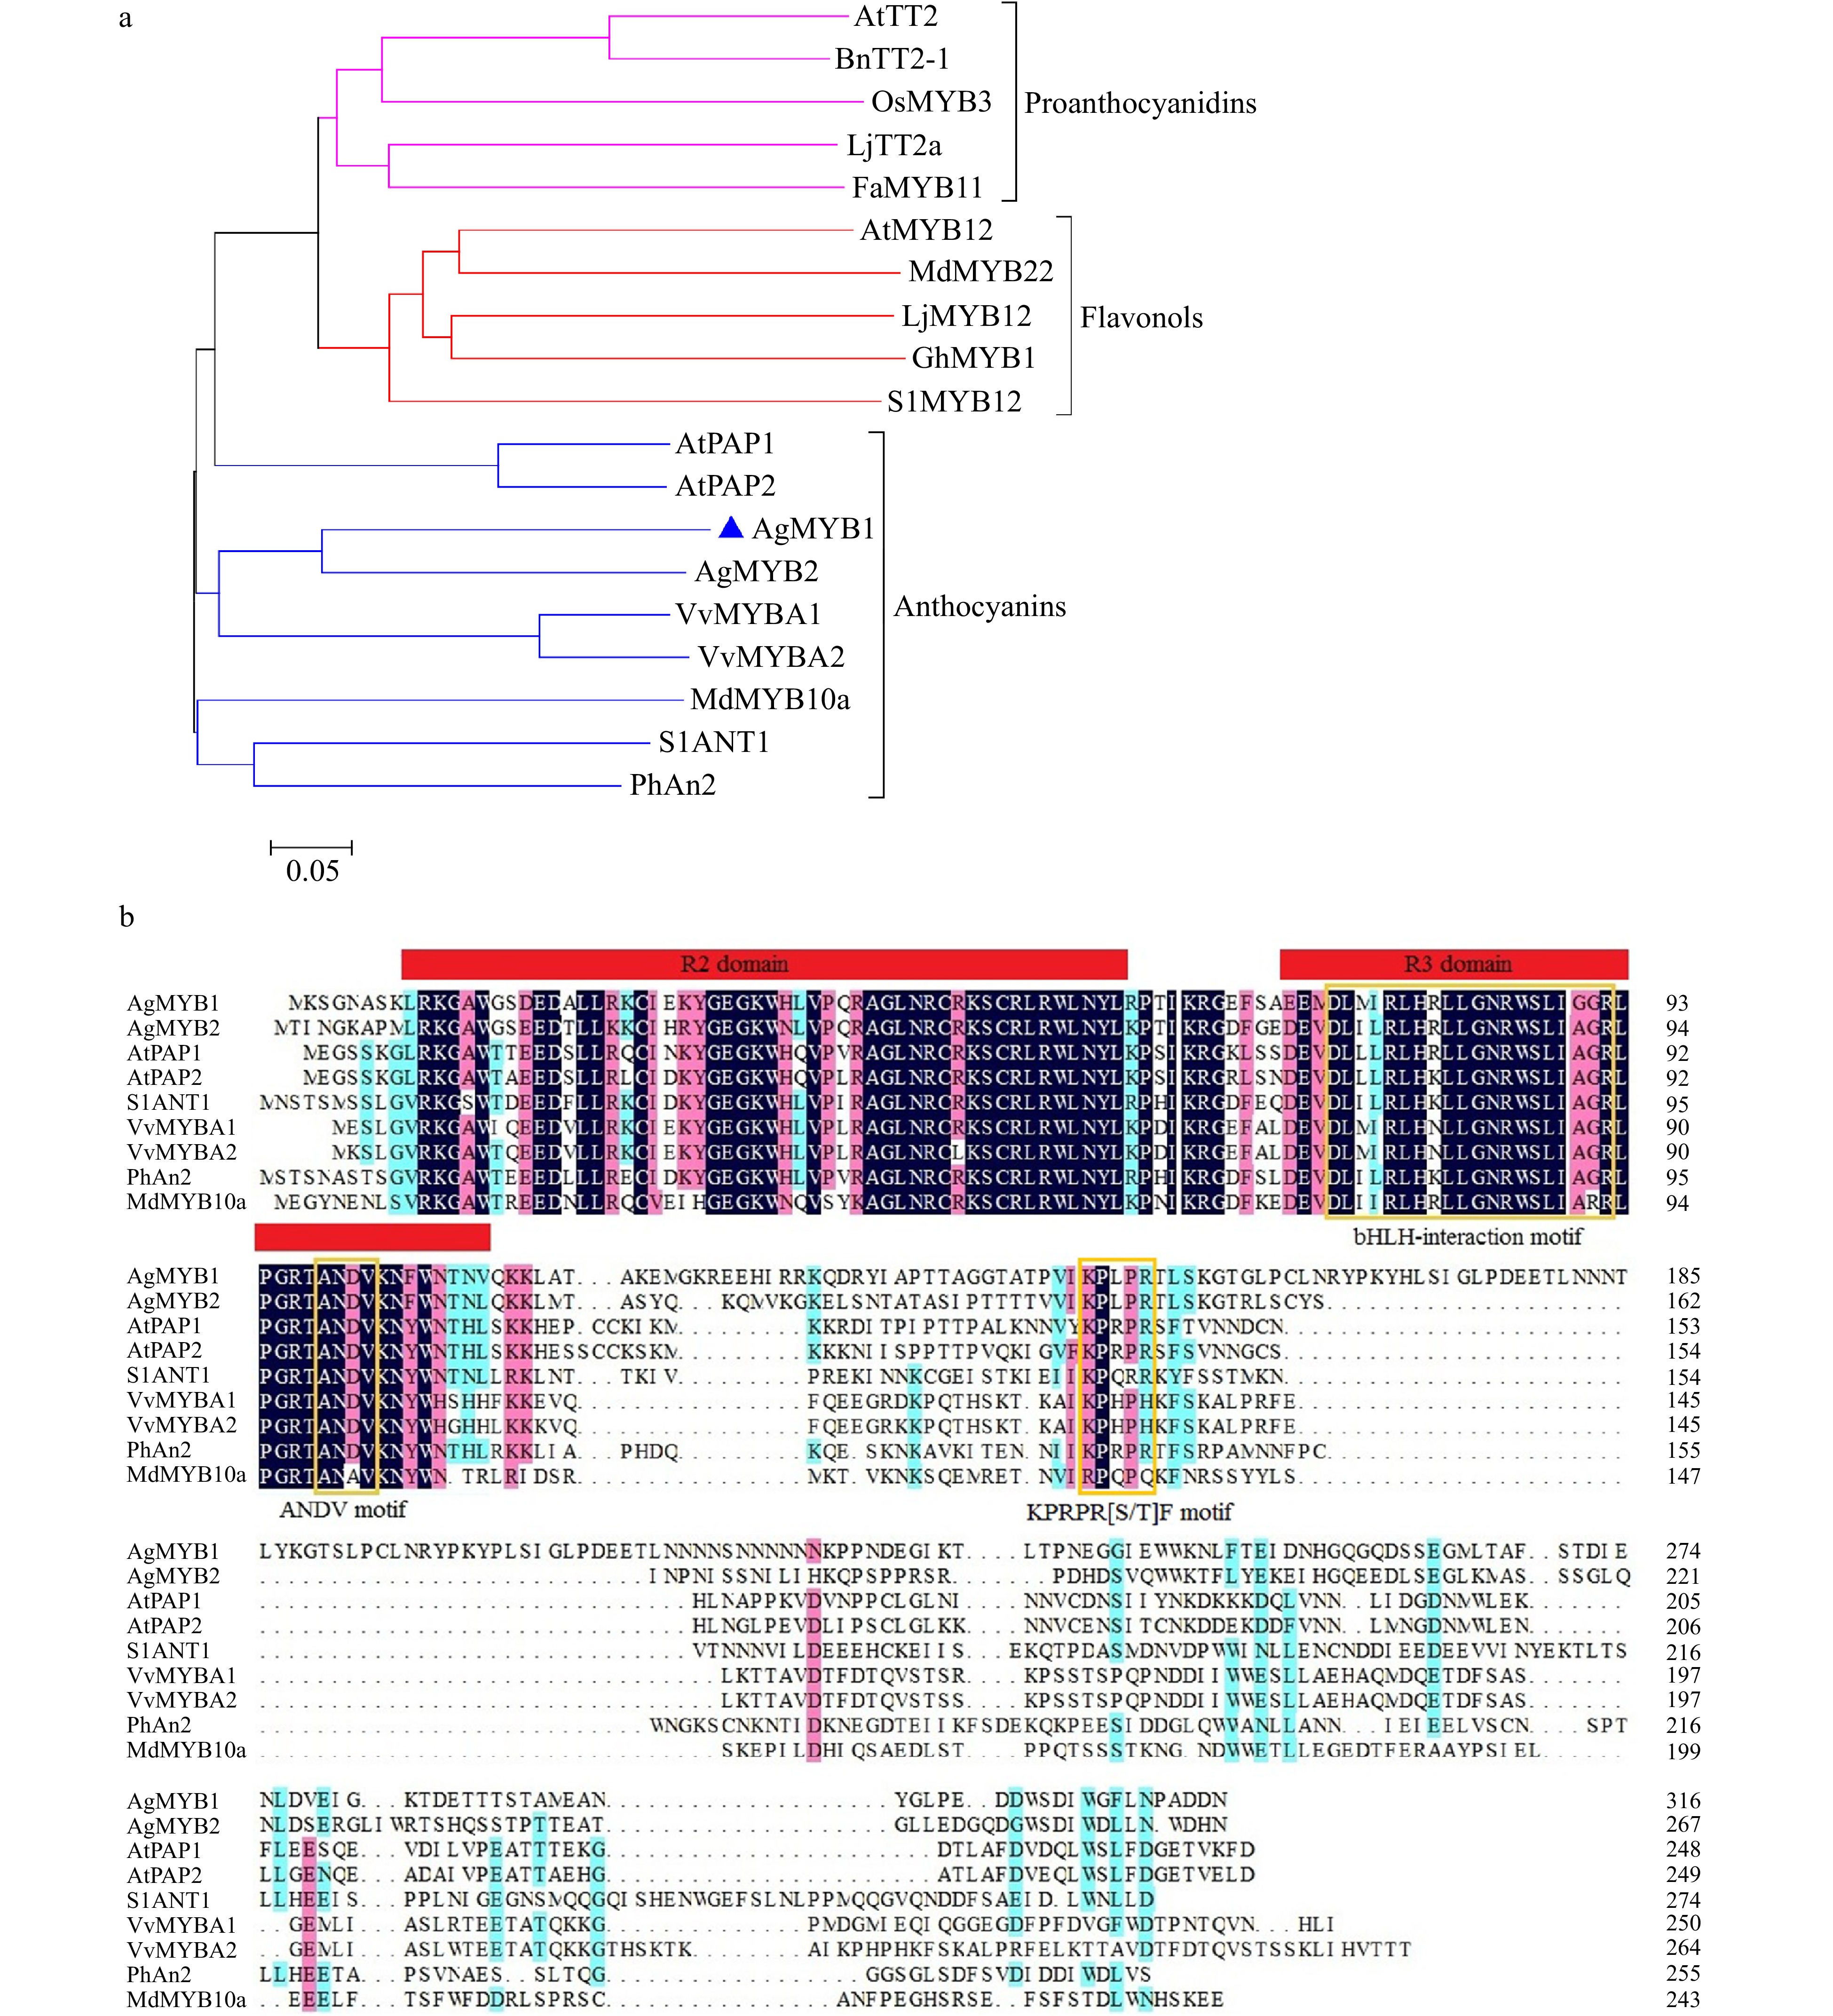
Figure 3. Phylogenetic analysis and sequence alignment of AgMYB1 and other R2R3-MYB proteins. (a) Phylogenetic analysis of AgMYB1 with R2R3-MYB TFs from celery and other plants. (b) Protein sequence alignment of AgMYB1 with other known anthocyanin-related R2R3-MYB TFs. The various motifs are indicated with yellow frames. The R2R3-MYB TFs with similar functions are clustered onto the same branch (anthocyanins, proanthocyanidins, and flavonols). The accession numbers of R2R3-MYB TFs: Arabidopsis thaliana AtPAP1 (AAG42001), AtPAP2 (AAG42002), AtMYB12 (ABB03913), AtTT2 (NP_198405); Solanum lycopersicum SlANT1 (AAQ55181), SlMYB12 (ACB46530); Vitis vinifera VvMYBA1 (BAD18977) and VvMYBA2 (BAD18978); Fragaria×ananassa FaMYB11 (AFL02461.1); Oryza sativa OsMYB3 (BAA23339.1); Gerbera hybrida GhMYB1 (CAD87007.1); Petunia×hybrida PhAn2 (AAF66727); Malus domestica MdMYB10a (ABB84753.1) and MdMYB22 (AAZ20438.1); Lotus japonicus LjMYB12 (BAF74782), LjTT2a (BAG12893); Brassica napus BnTT2-1 (ABI13034).
-
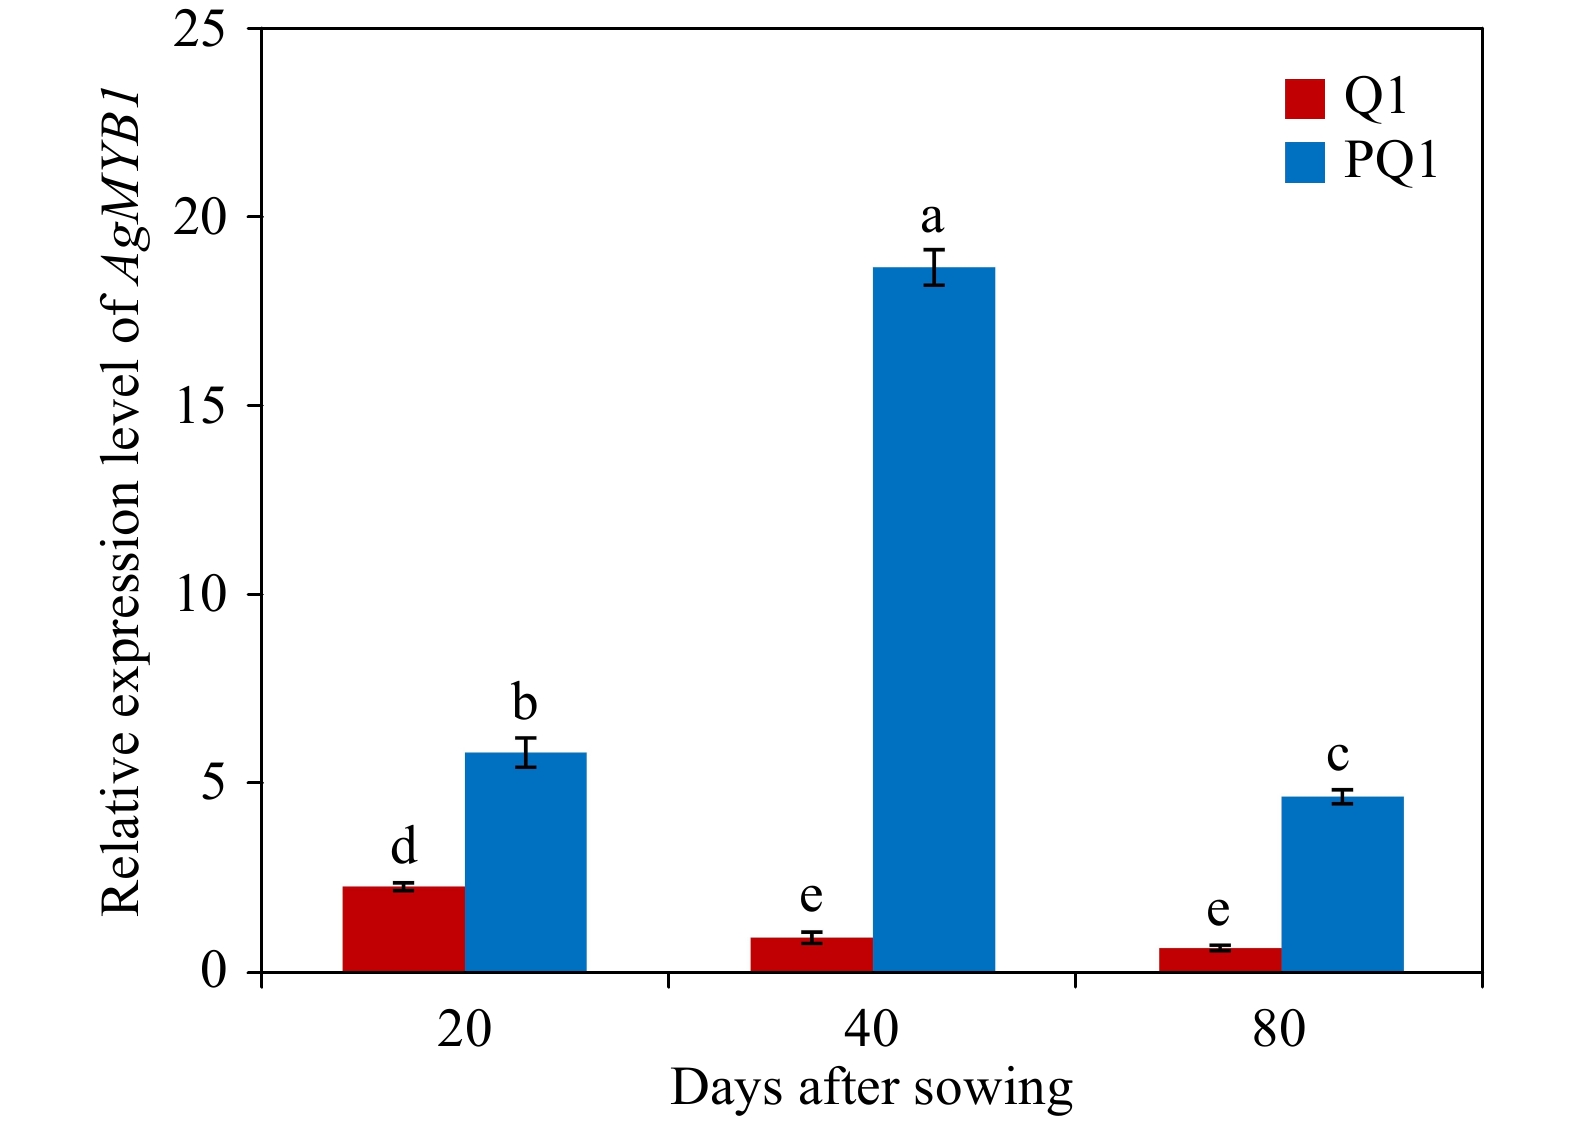
Figure 4. Relative transcript levels in various developmental stages and varieties. Q1, ‘Liuhe huangxin celery’; PQ1, ‘Nanxuan liuhe purple celery’. The values represent the mean of three independent experiments ± SD. The lowercase letters over the columns represent the significant differences at P < 0.05.
-
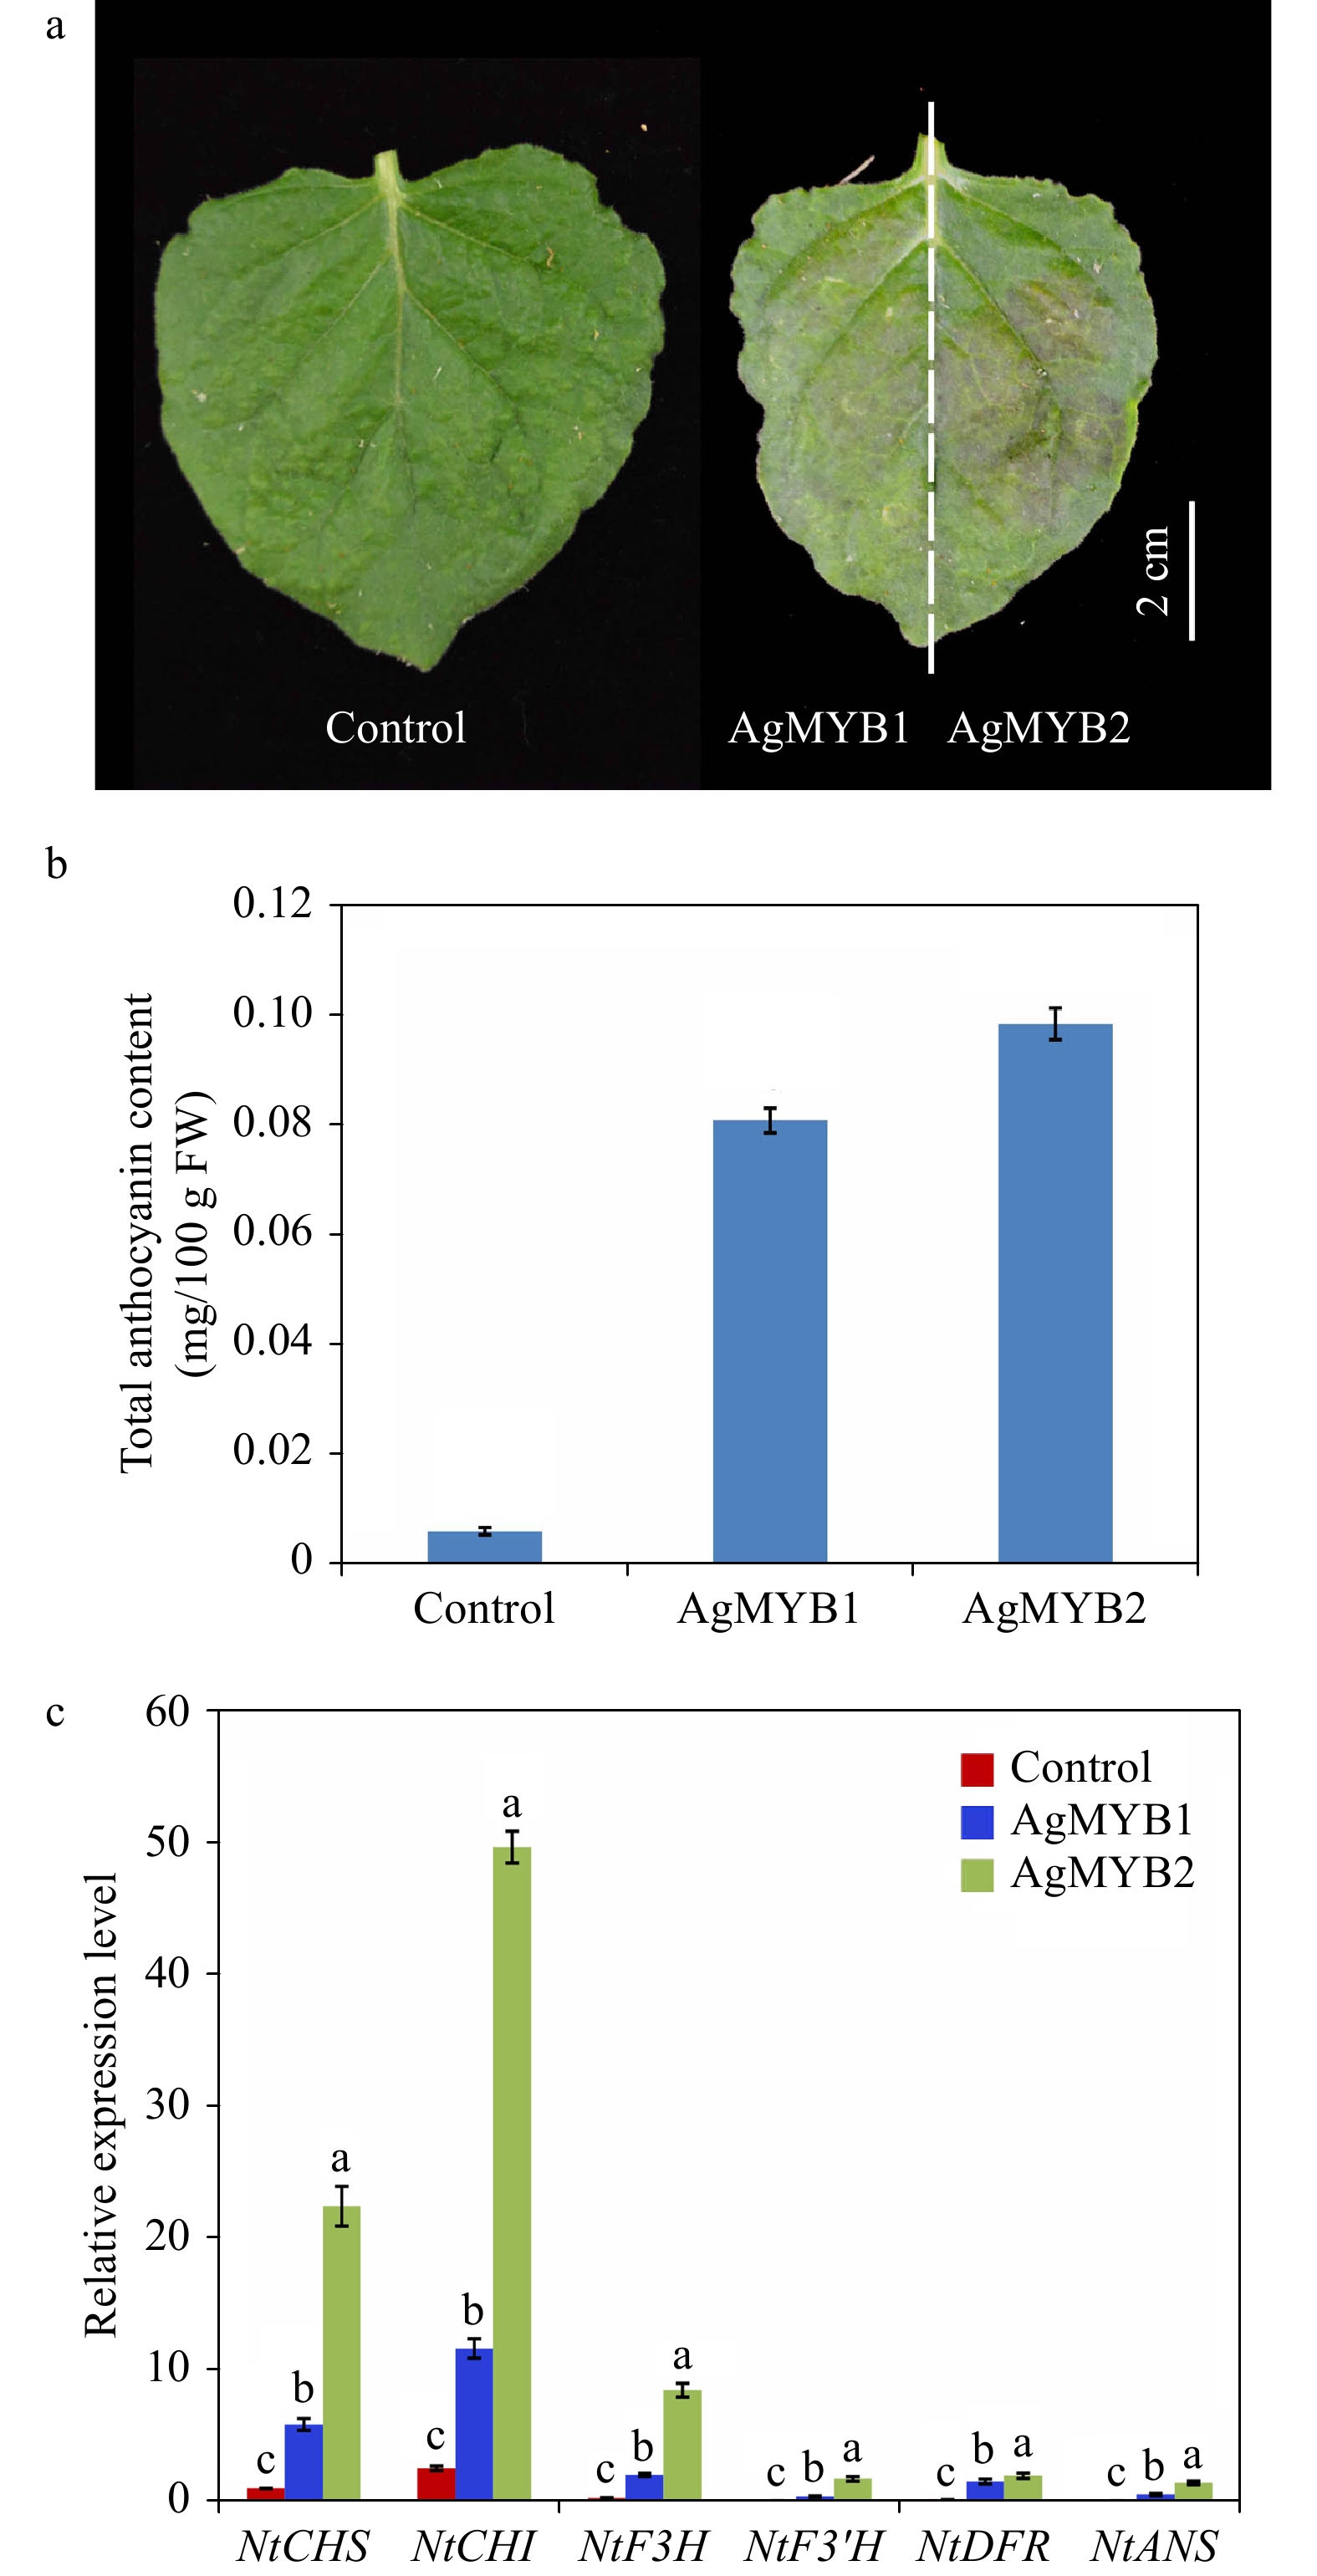
Figure 5. Transient expression of AgMYB1 and AgMYB2 in tobacco leaves. (a) Tobacco leaves infiltrated with Agrobacterium strain harboring AgMYB1 or AgMYB2. (b) Total anthocyanin content of control tobacco and tobacco transient expressing AgMYB1 or AgMYB2. (c) The relative transcript levels of anthocyanin biosynthetic genes in tobacco leaves. The AgMYB1 and AgMYB2 genes were transiently expressed in the left and right halves of tobacco leaves, respectively. The values represent the mean of three independent experiments ± SD. The lowercase letters over the columns represent the significant differences at P < 0.05.
-
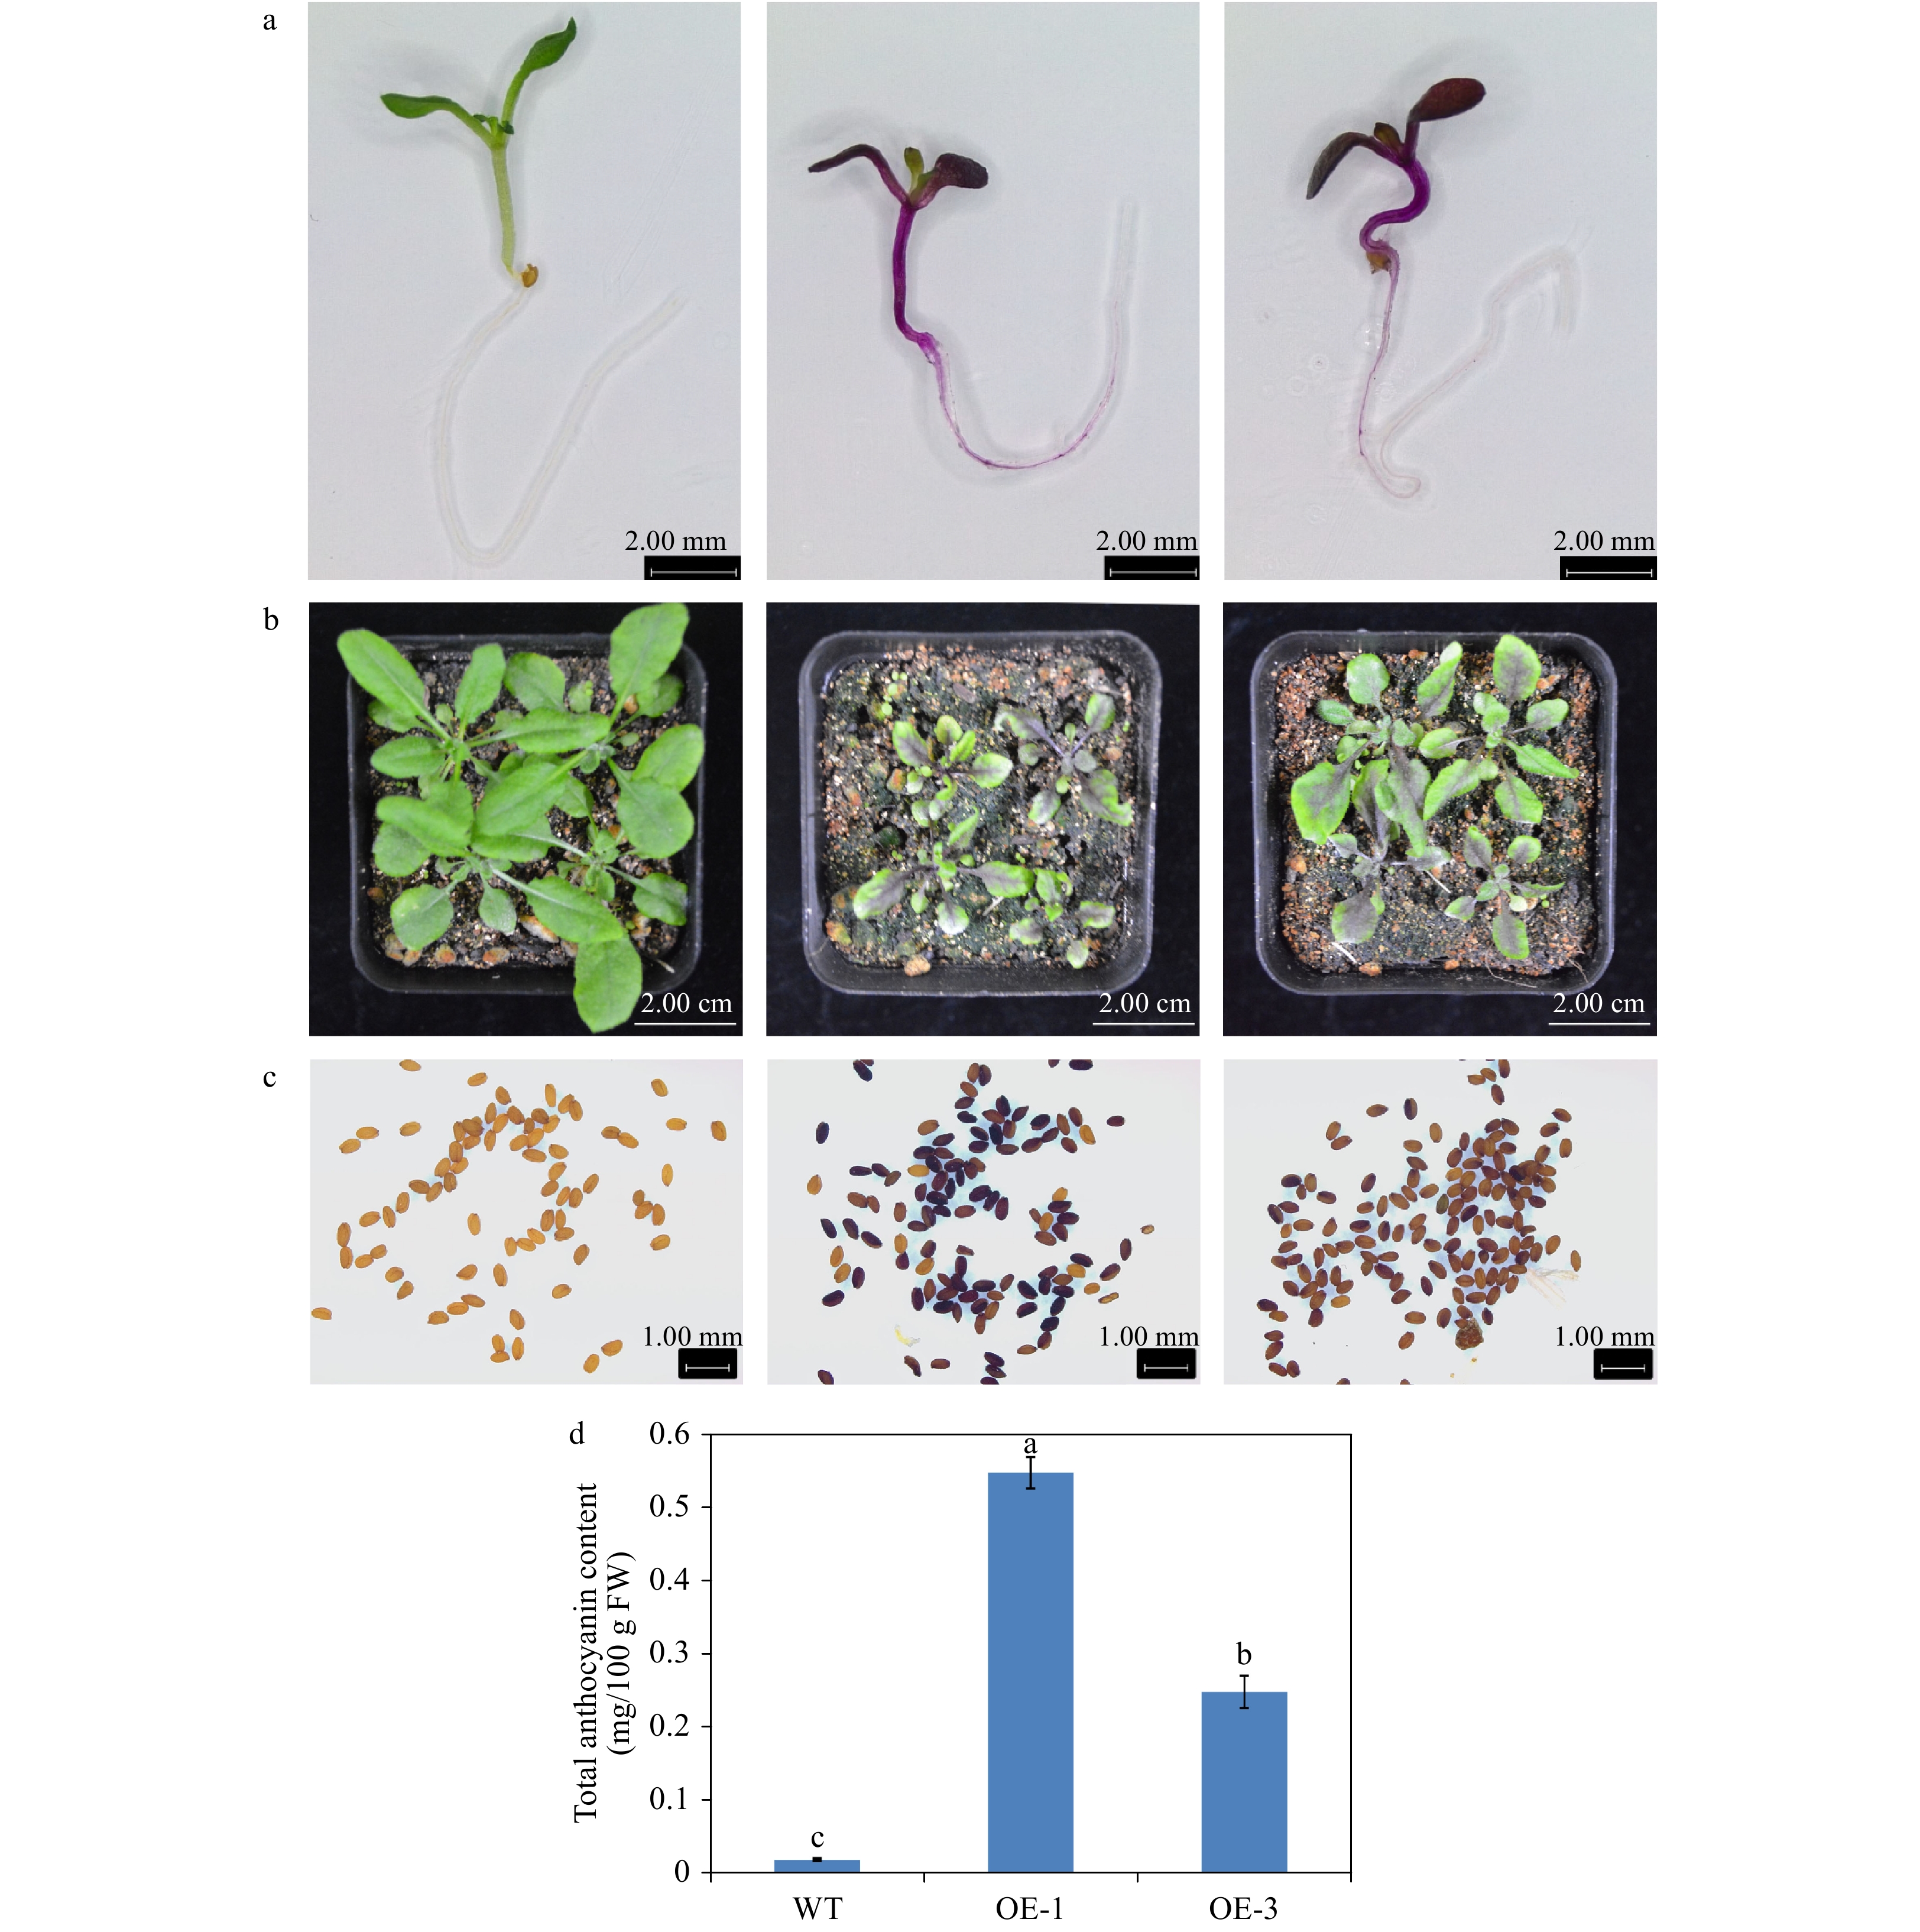
Figure 6. Overexpression of AgMYB1 in Arabidopsis. (a) Seedlings of WT and transgenic Arabidopsis grown on medium plate. (b) Seedlings of WT and transgenic Arabidopsis grown in soil. (c) Seeds of WT and transgenic Arabidopsis plants. (d) Total anthocyanin content of whole plants of WT and transgenic Arabidopsis. The values represent the mean of three independent experiments ± SD. The lowercase letters over the columns represent the significant differences at P < 0.05.
-
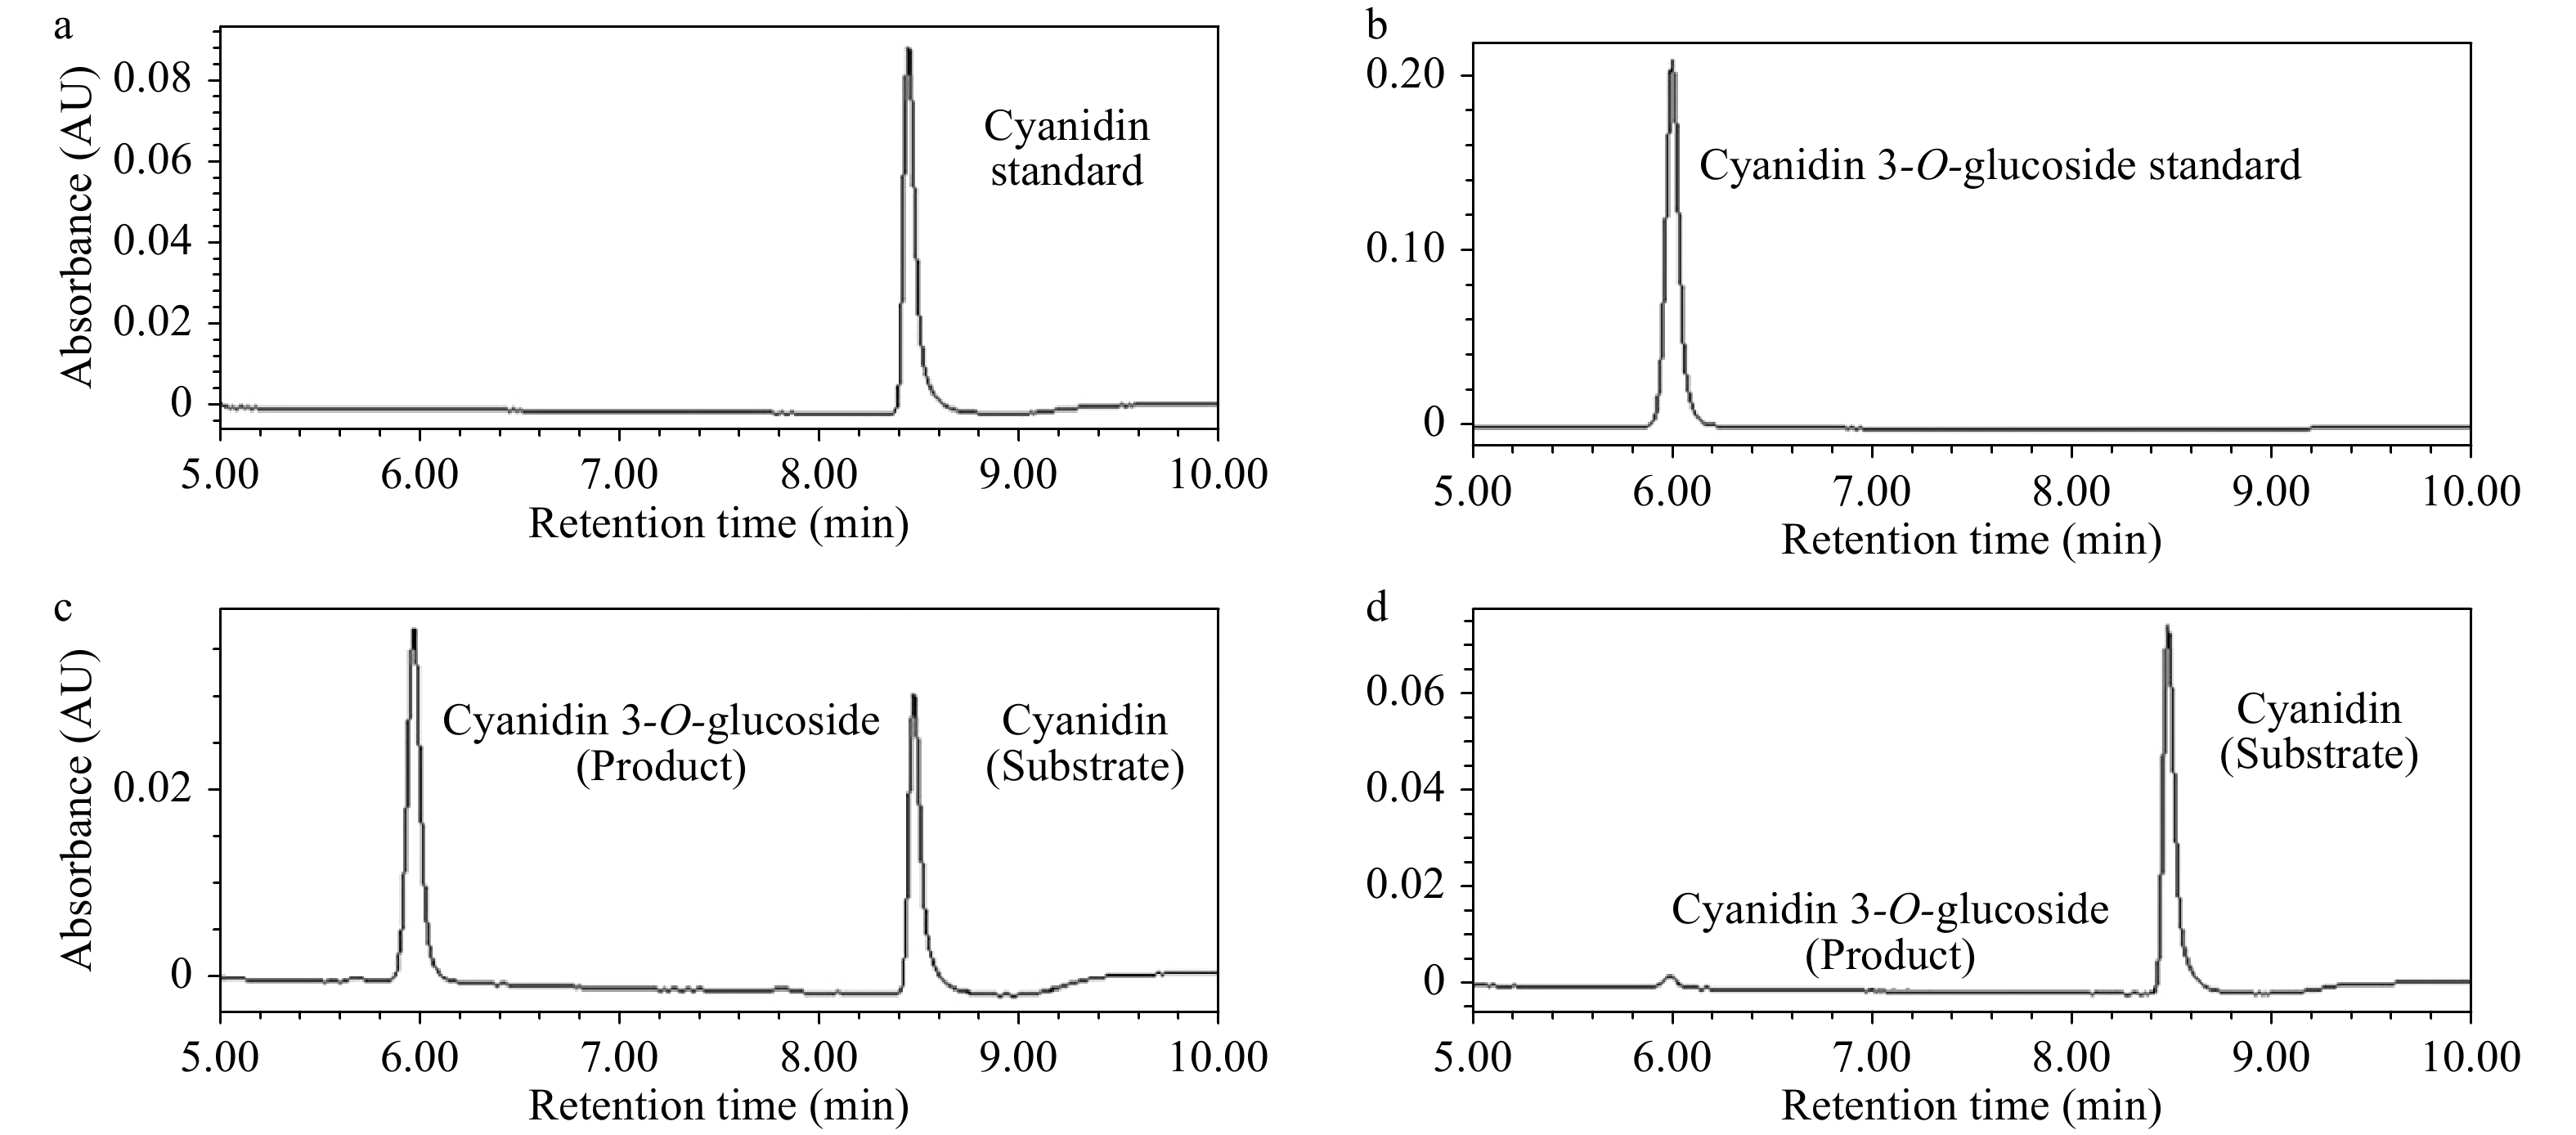
Figure 7. UPLC chromatograms of enzyme activity reactions. (a) Cyanidin standard sample. (b) Cyanidin 3-O-glucoside standard sample. (c) Enzyme activity reaction of crude enzyme extracted from OE-1 Arabidopsis. (d) Enzyme activity reaction of crude enzyme extracted WT Arabidopsis.
-
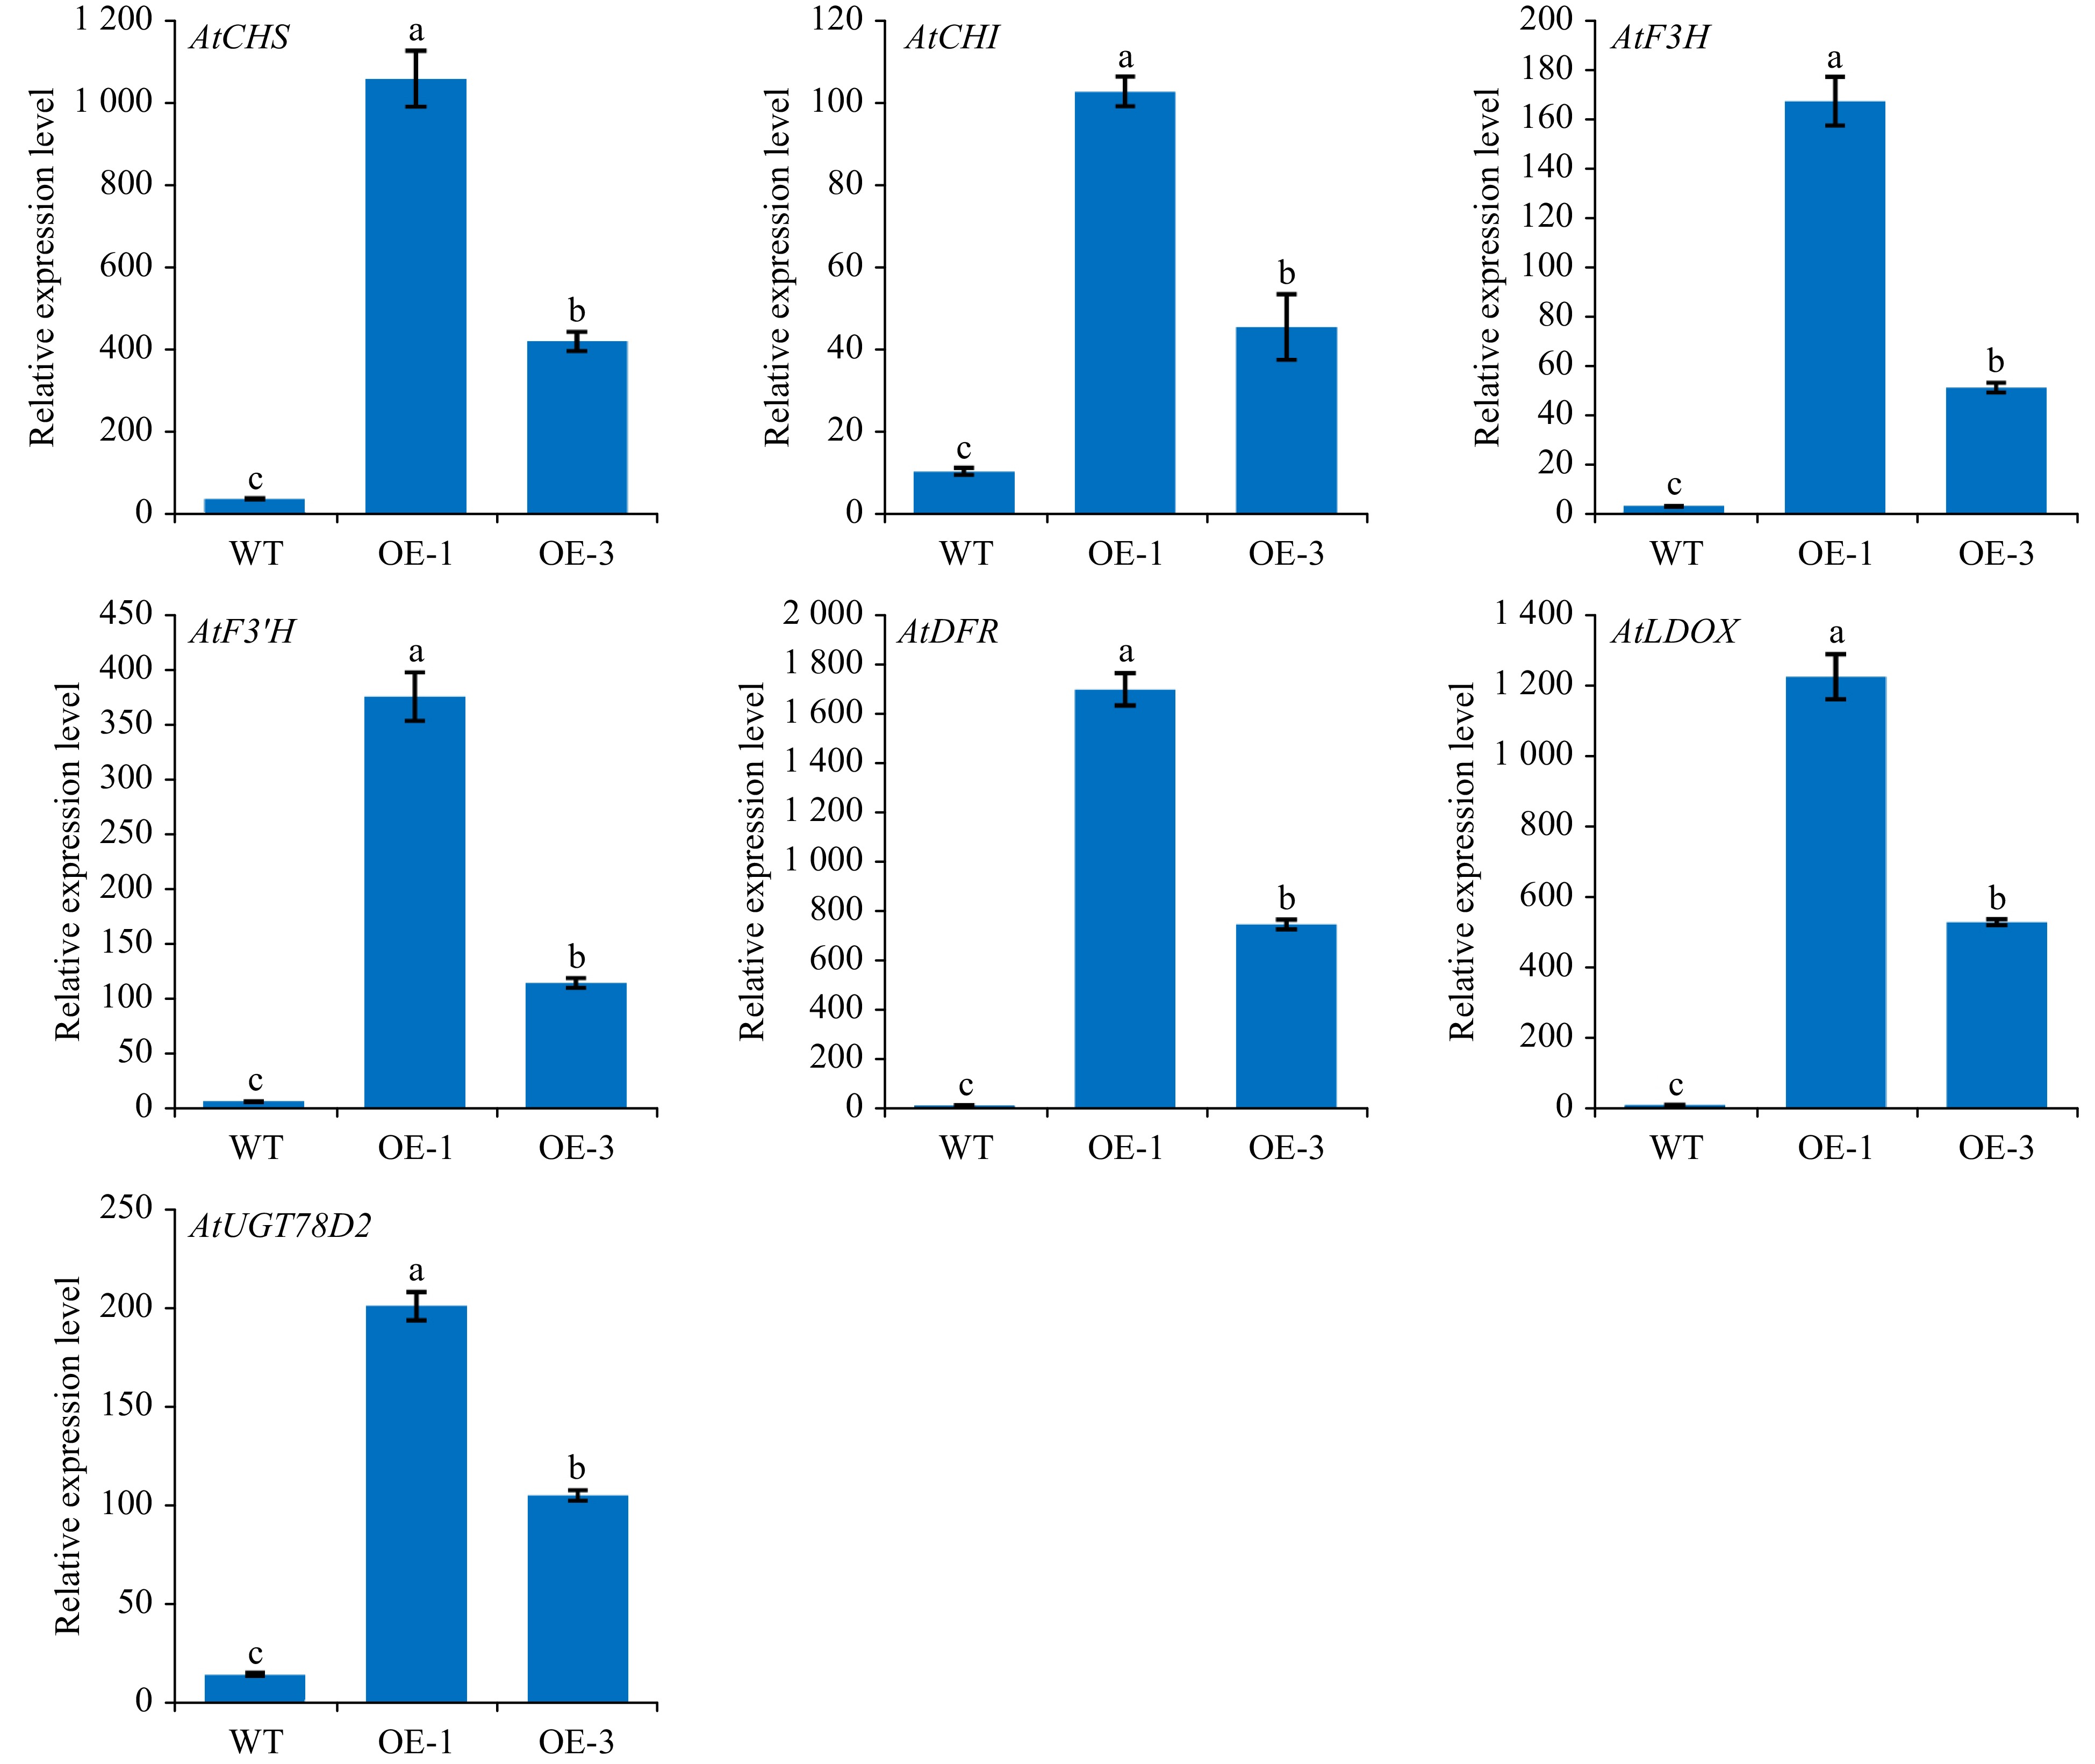
Figure 8. The relative transcripts of structural genes involved in anthocyanin biosynthesis in WT and transgenic Arabidopsis. The values represent the mean of three independent experiments ± SD. The lowercase letters over the columns represent the significant differences at P < 0.05.
-
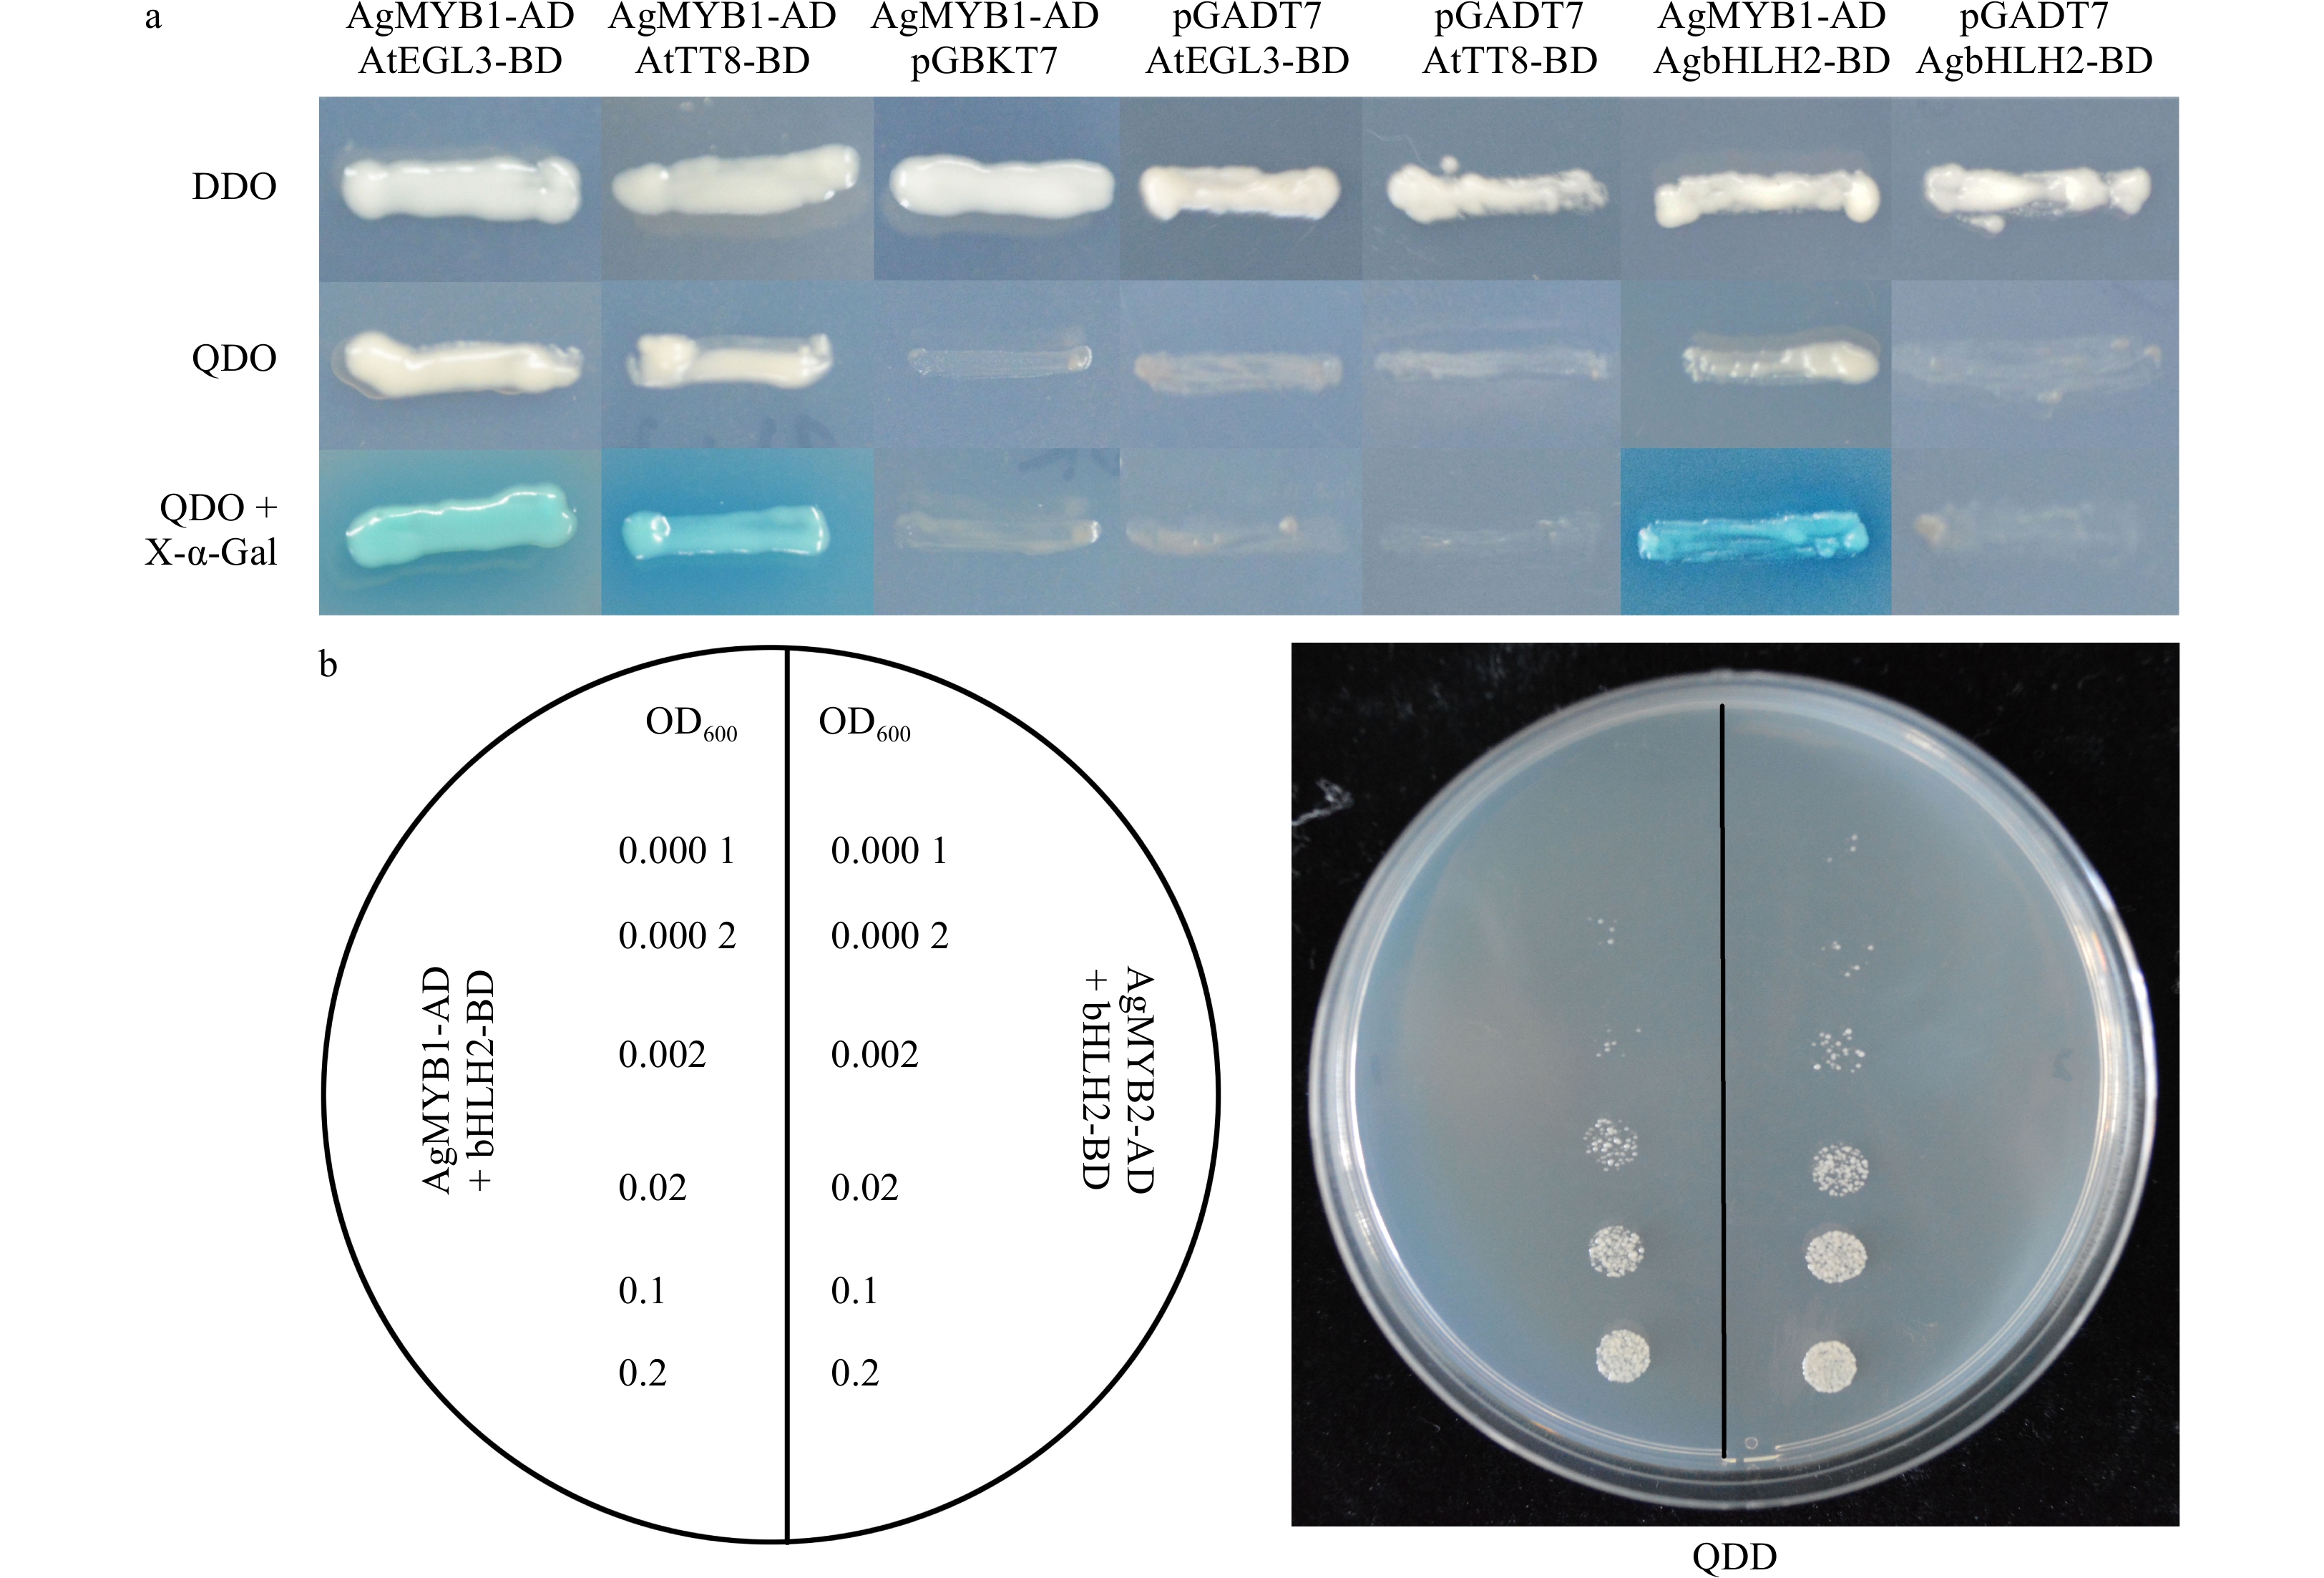
Figure 9. Yeast two-hybrid of celery R2R3-MYB and bHLH TFs. (a) Yeast two-hybrid of AgMYB1 with AtEGL3, AtTT8, and AgbHLH2 proteins. (b) Growth status of yeast cells harboring AgMYB1 and AgMYB2 with different OD600 values. DDO: SD/-Trp/-Leu; QDO: SD/-Leu/-Trp/-His/-Ade; QDO+X-α-Gal: SD/-Leu/-Trp/-His/-Ade/+X-α-Gal.
-
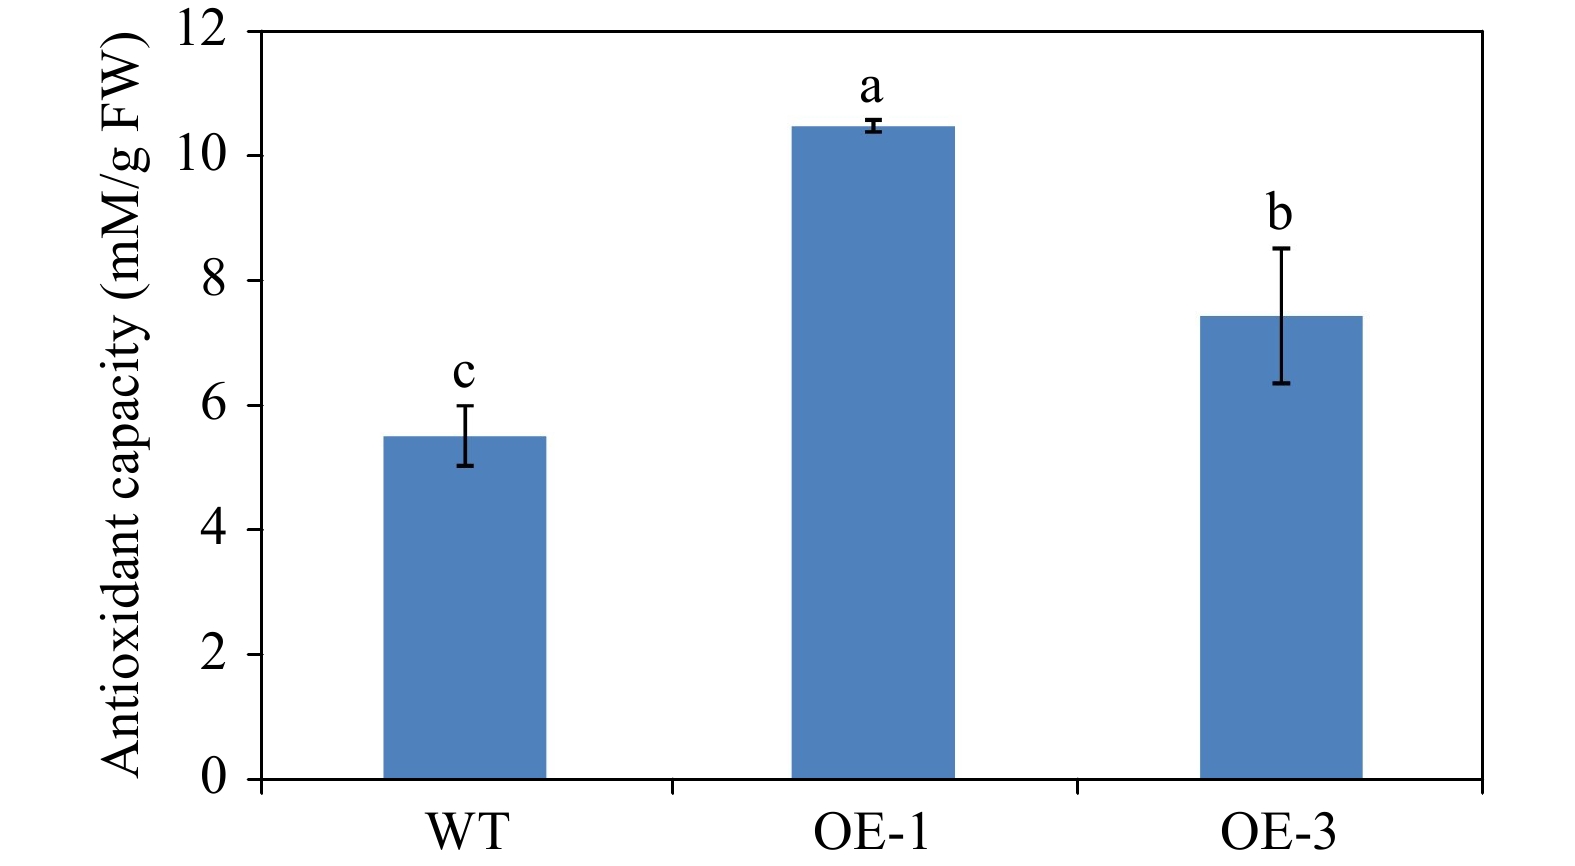
Figure 10. Antioxidant activity measurement of WT and transgenic Arabidopsis plants using FRAP method. The values represent the mean of three independent experiments ± SD. The lowercase letters over the columns represent the significant differences at P < 0.05.
-
Arabidopsis category Relative glycosylation ability (%) WT Arabidopsis 3.59 ± 1.61 OE-1 Arabidopsis 100 ± 3.99 Table 1. Relative glycosylation abilities of WT and transgenic Arabidopsis.The glycosylation ability of OE-1 Line of Arabidopsis was set as 100%. The values represent the mean of three independent experiments ± SD.
Figures
(10)
Tables
(1)