-
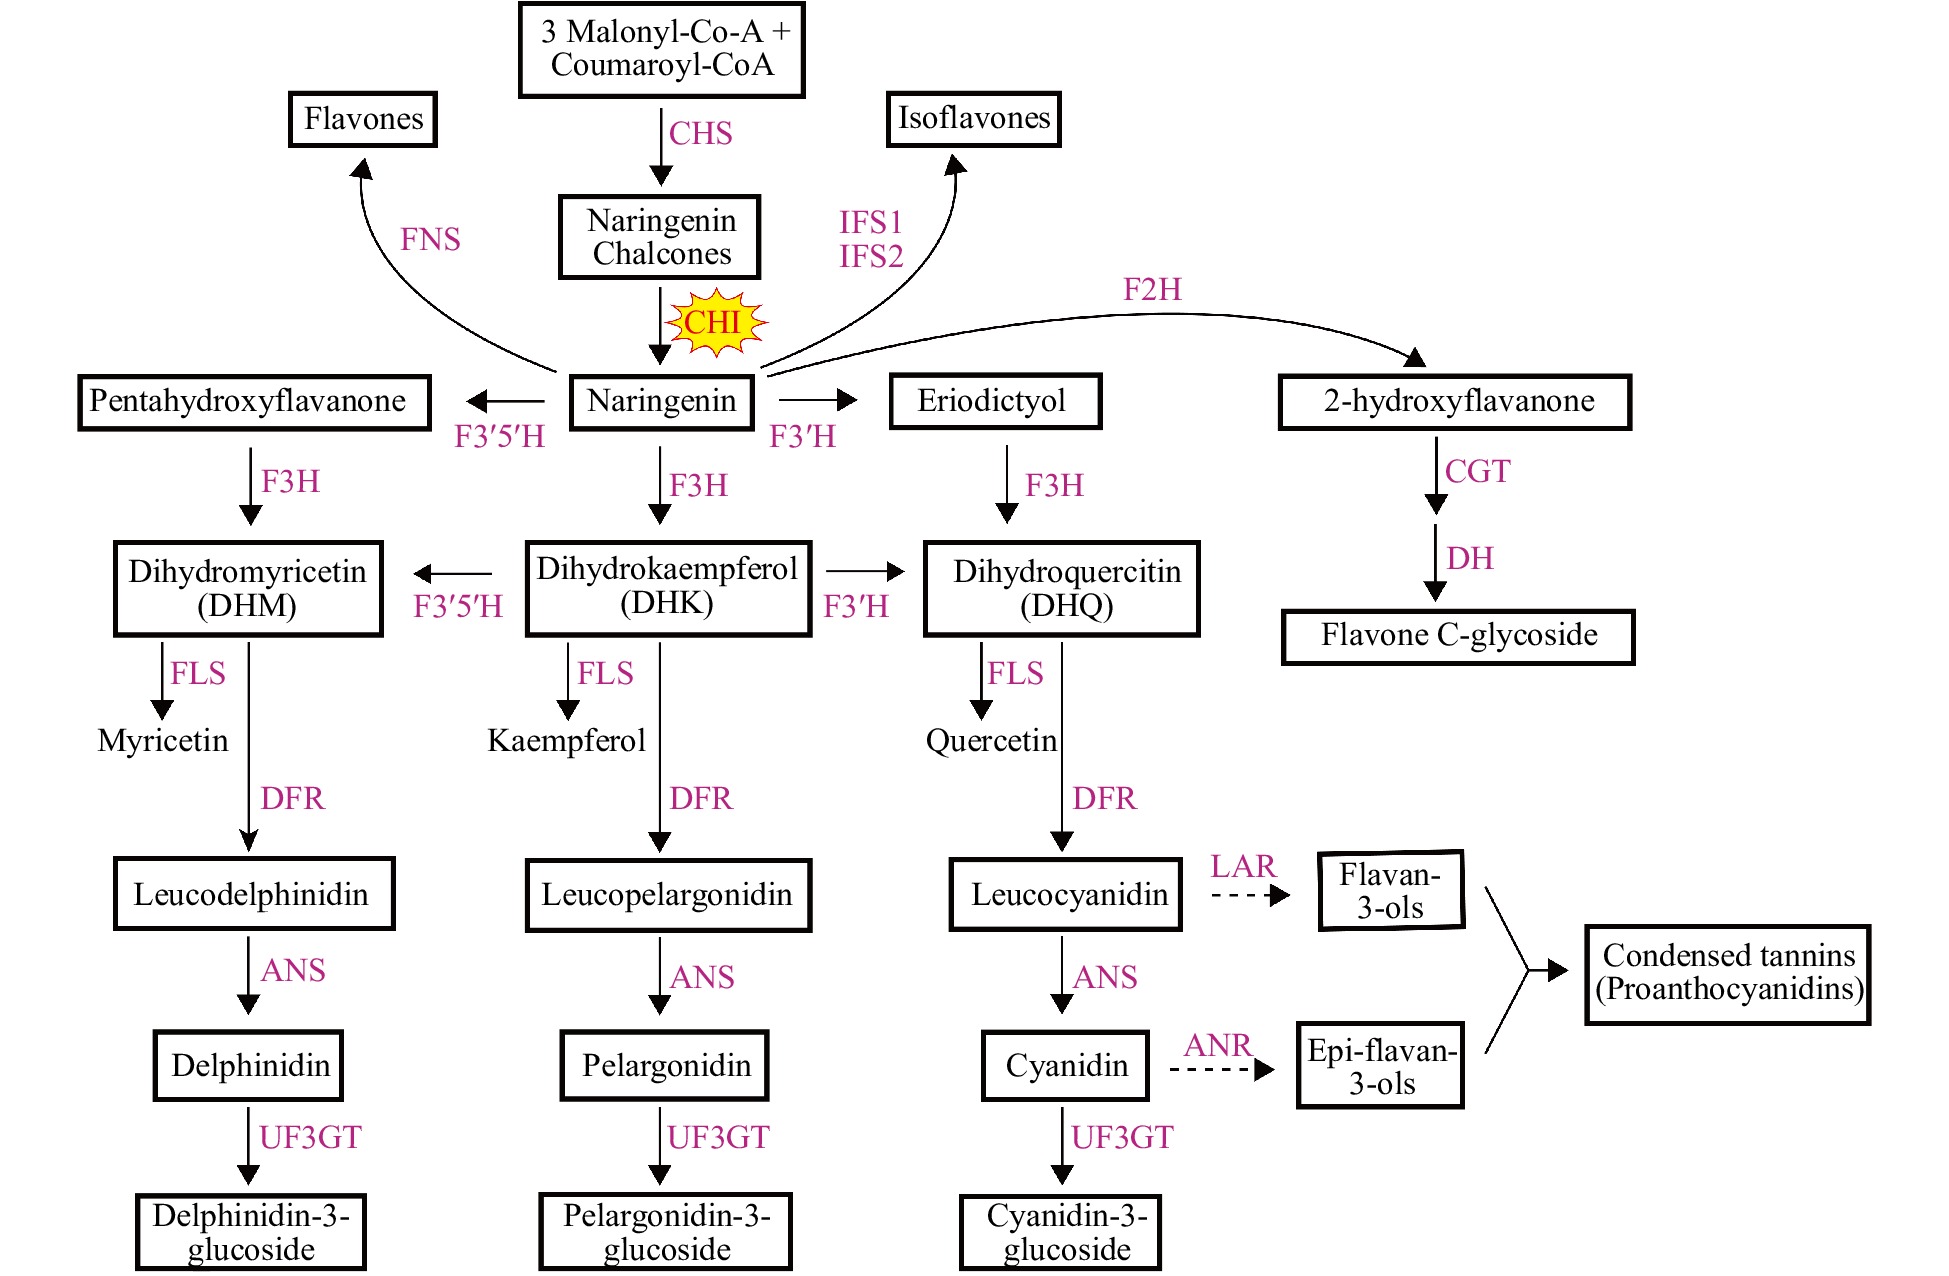
Figure 1. Flavonoid biosynthetic pathway. The two dotted lines represent the flavan-3,4-diols (including leucodelphinidin, leucopelargonidin and leucocyanidin) which are catalyzed by LAR to generate flavan-3-ols and the 3-OH-anthocyanidins (including delphinidin, pelargonidin and cyanidin) and also catalyzed by ANR to generate epi-flavan-3-ols, respectively. Enzymes are indicated as capitals in red. The names of the enzymes are abbreviated as follows: CHS, chalcone synthase; CHI, chalcone isomerase; F3H, flavanone 3-hydroxylase; FLS, flavonol synthase; F3'H, flavonoid 3'-hydroxylase; DFR, dihydroflavonol 4-reductase; ANS, anthocyanidin synthase; LAR, leucoanthocyanidin reductase; ANR, anthocyanidin reductase; FNS, flavone synthase; F3'5'H, flavonoid 3',5'-hydroxylase; IFS, isoflavone synthase; F2H, flavanone 2-hydroxylase; UF3GT, UDP glucose: flavonoid 3-O-glucosyltransferase; CGT, C-glucosyl transferase; DH, dehydratase.
-
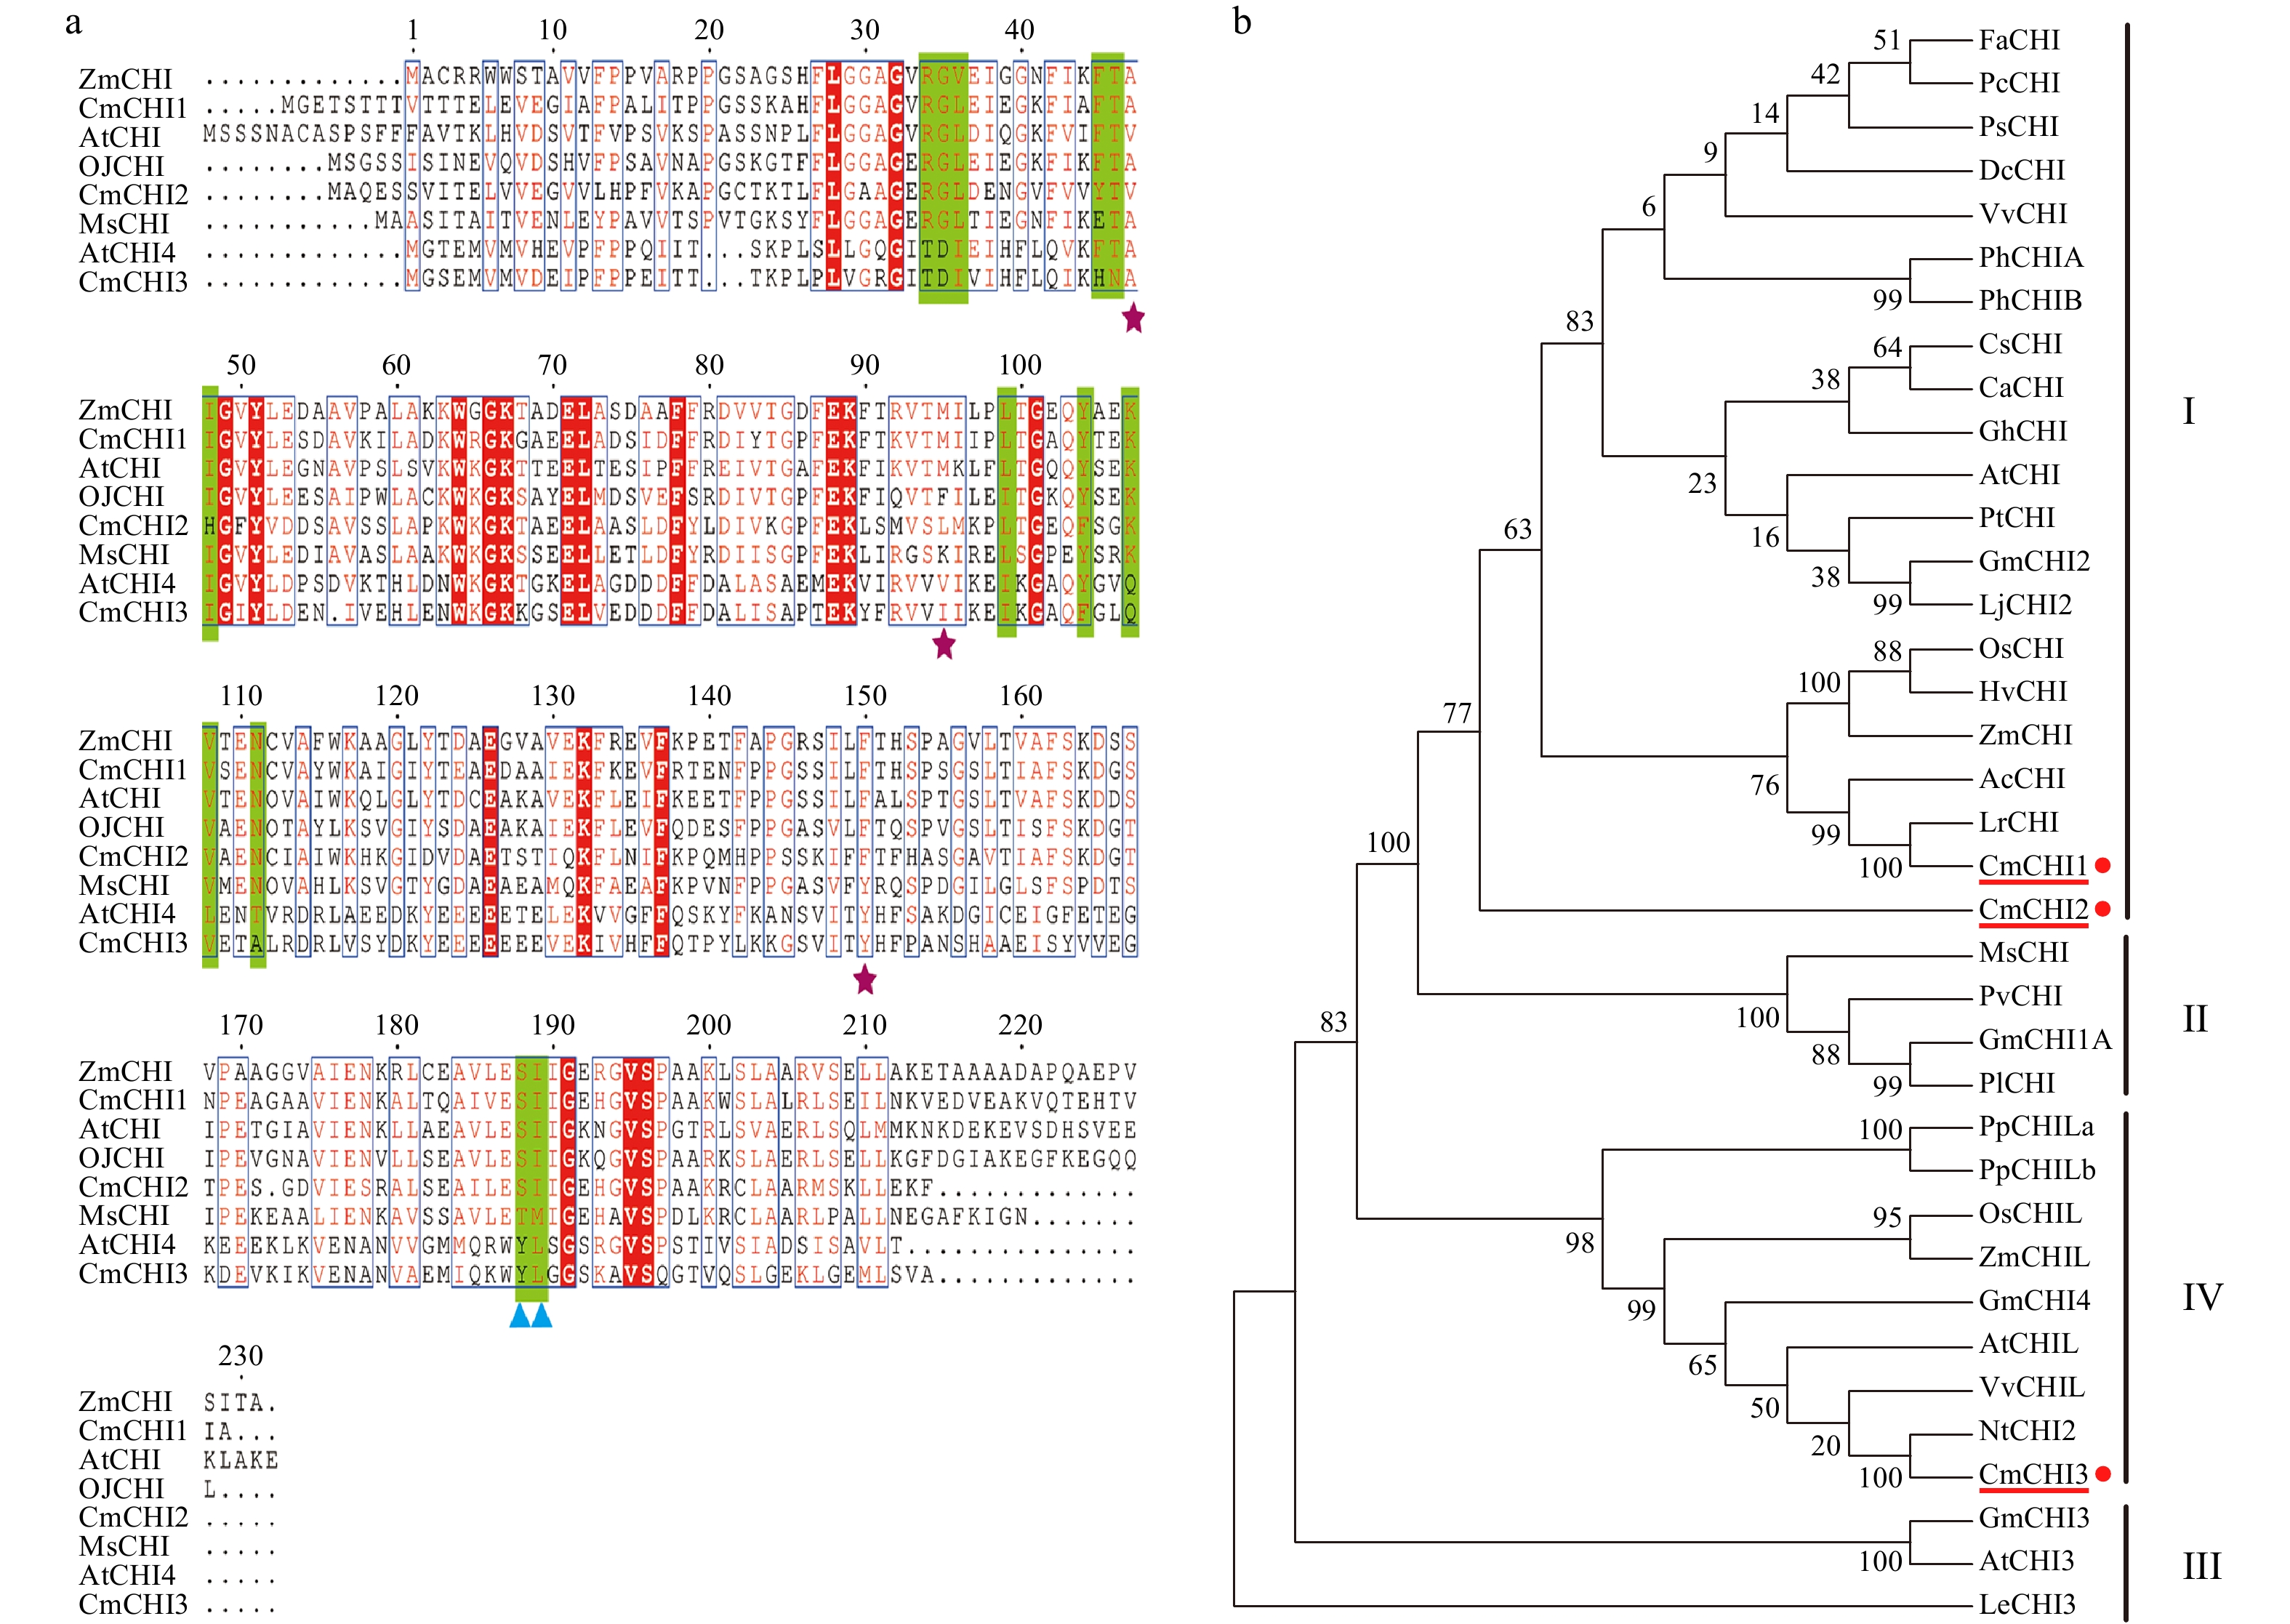
Figure 2. Sequence and phylogenetic analysis of CmCHIs. (a) Sequence alignment of CHIs for C. miniata (Cm) and other species (Arabidopsis thaliana: At; Medicago sativa: Ms; Ophiorrhiza japonica: Oj). The green highlights indicate residues that bind (2S)-naringenin, the purple stars indicate the hydrogen bonding network residues of the active site. The blue triangles identify residues postulated to determine substrate preference for naringenin chalcone and isoliquiritigenin. (b) Phylogenetic analysis of CHI proteins from C. miniata and other plant species. Numbers indicate bootstrap values for 1,000 replicates. GenBank accession numbers are as follows: AtCHI (Arabidopsis thaliana, P41088), MsCHI (Medicago sativa, P28012), PsCHI (Paeonia suffruticosa, ADK55061), ZmCHI (Zea mays, CAA80441), VvCHI (Vitis vinifera, P51117), CsCHI (Citrus sinensis, BAA36552), GmCHI2 (Glycine max, AY595415), LjCHI2 (Lotus japonicus, Q8H0G1), GmCHI1B1 (Glycine max, AY595414), LjCHI (Lotus japonicus, AJ548840), PvCHI (Phaseolus vulgaris, P14298), GmCHI1A (Glycine max, AY595413), PlCHI (Pueraria lobata, Q43056), PpCHILa (Physcomitrella patens, XP_001773128), PpCHILb (Physcomitrella patens, XP_001769093), VvCHIL (Vitis vinifera, XP_002280158), AtCHIL (Arabidopsis thaliana, NP_568154), GmCHI4 (Glycine max, AY595417), OsCHIL (Oryza sativa, NP_001065587), ZmCHIL (Zea mays, NP_001151452), GmCHI3 (Glycine max, AY595416), PhCHIA (Petunia hybrida, AAF60296), PhCHIB (Petunia hybrida, CAA32730.1), AcCHI (Allium cepa, AY700850), ChCHI (Gossypium hirsutum, ABM64798), DcCHI (Dianthus caryophyllus, Q43754), AtCHI3 (Arabidopsis thaliana, AY084729), FaCHI (Fragaria ananassa, Q4AE11), PtCHI (Populus trichocarpa, XP_002315258), PcCHI (Pyrus communis, A5HBK6), and LeCHI3 (Lycopersicon esculentum, AY348871).
-
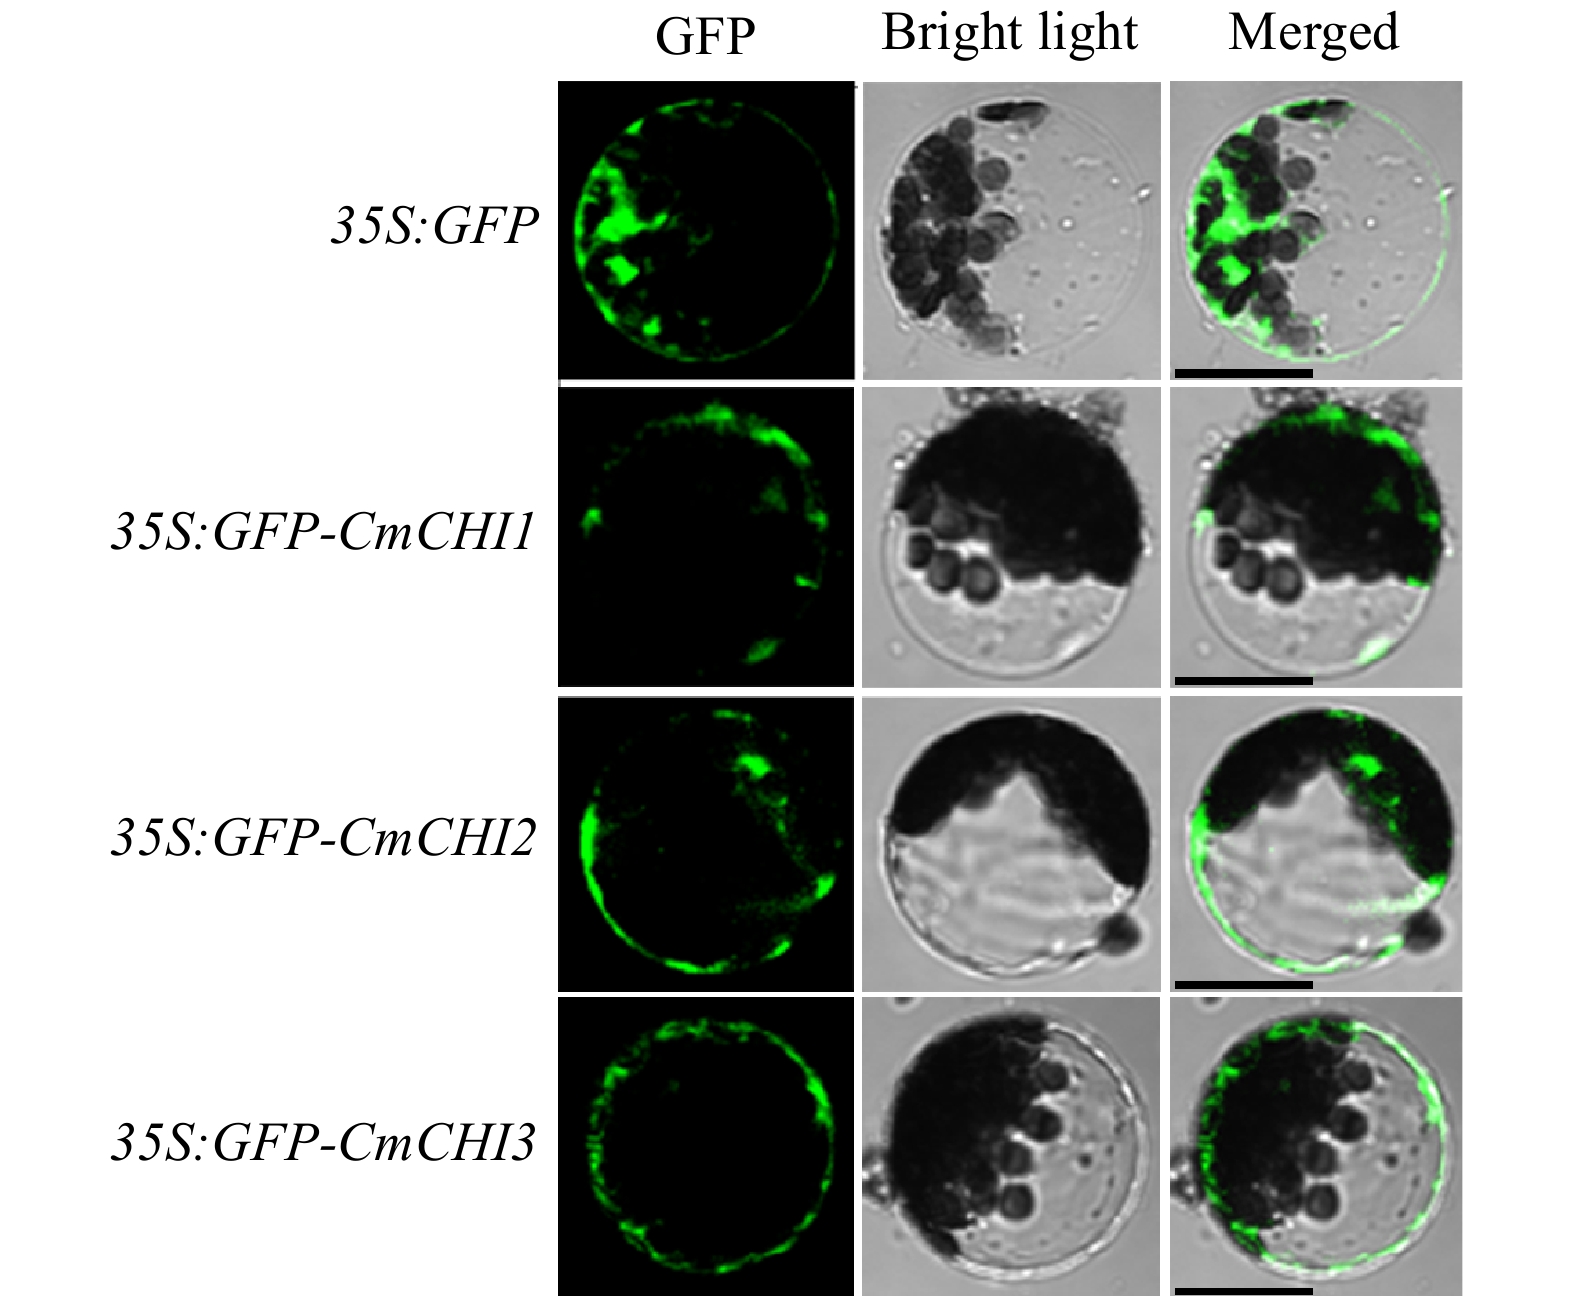
Figure 3. Intracellular localizations of CmCHI1, CmCHI2 and CmCHI3 in Arabidopsis protoplasts. Different constructs were transiently transfected into wild-type Arabidopsis protoplasts and incubated for 21 h at room temperature in the dark. Laser scanning confocal microscopy captured the fluorescent proteins. Bars: 25 µm.
-
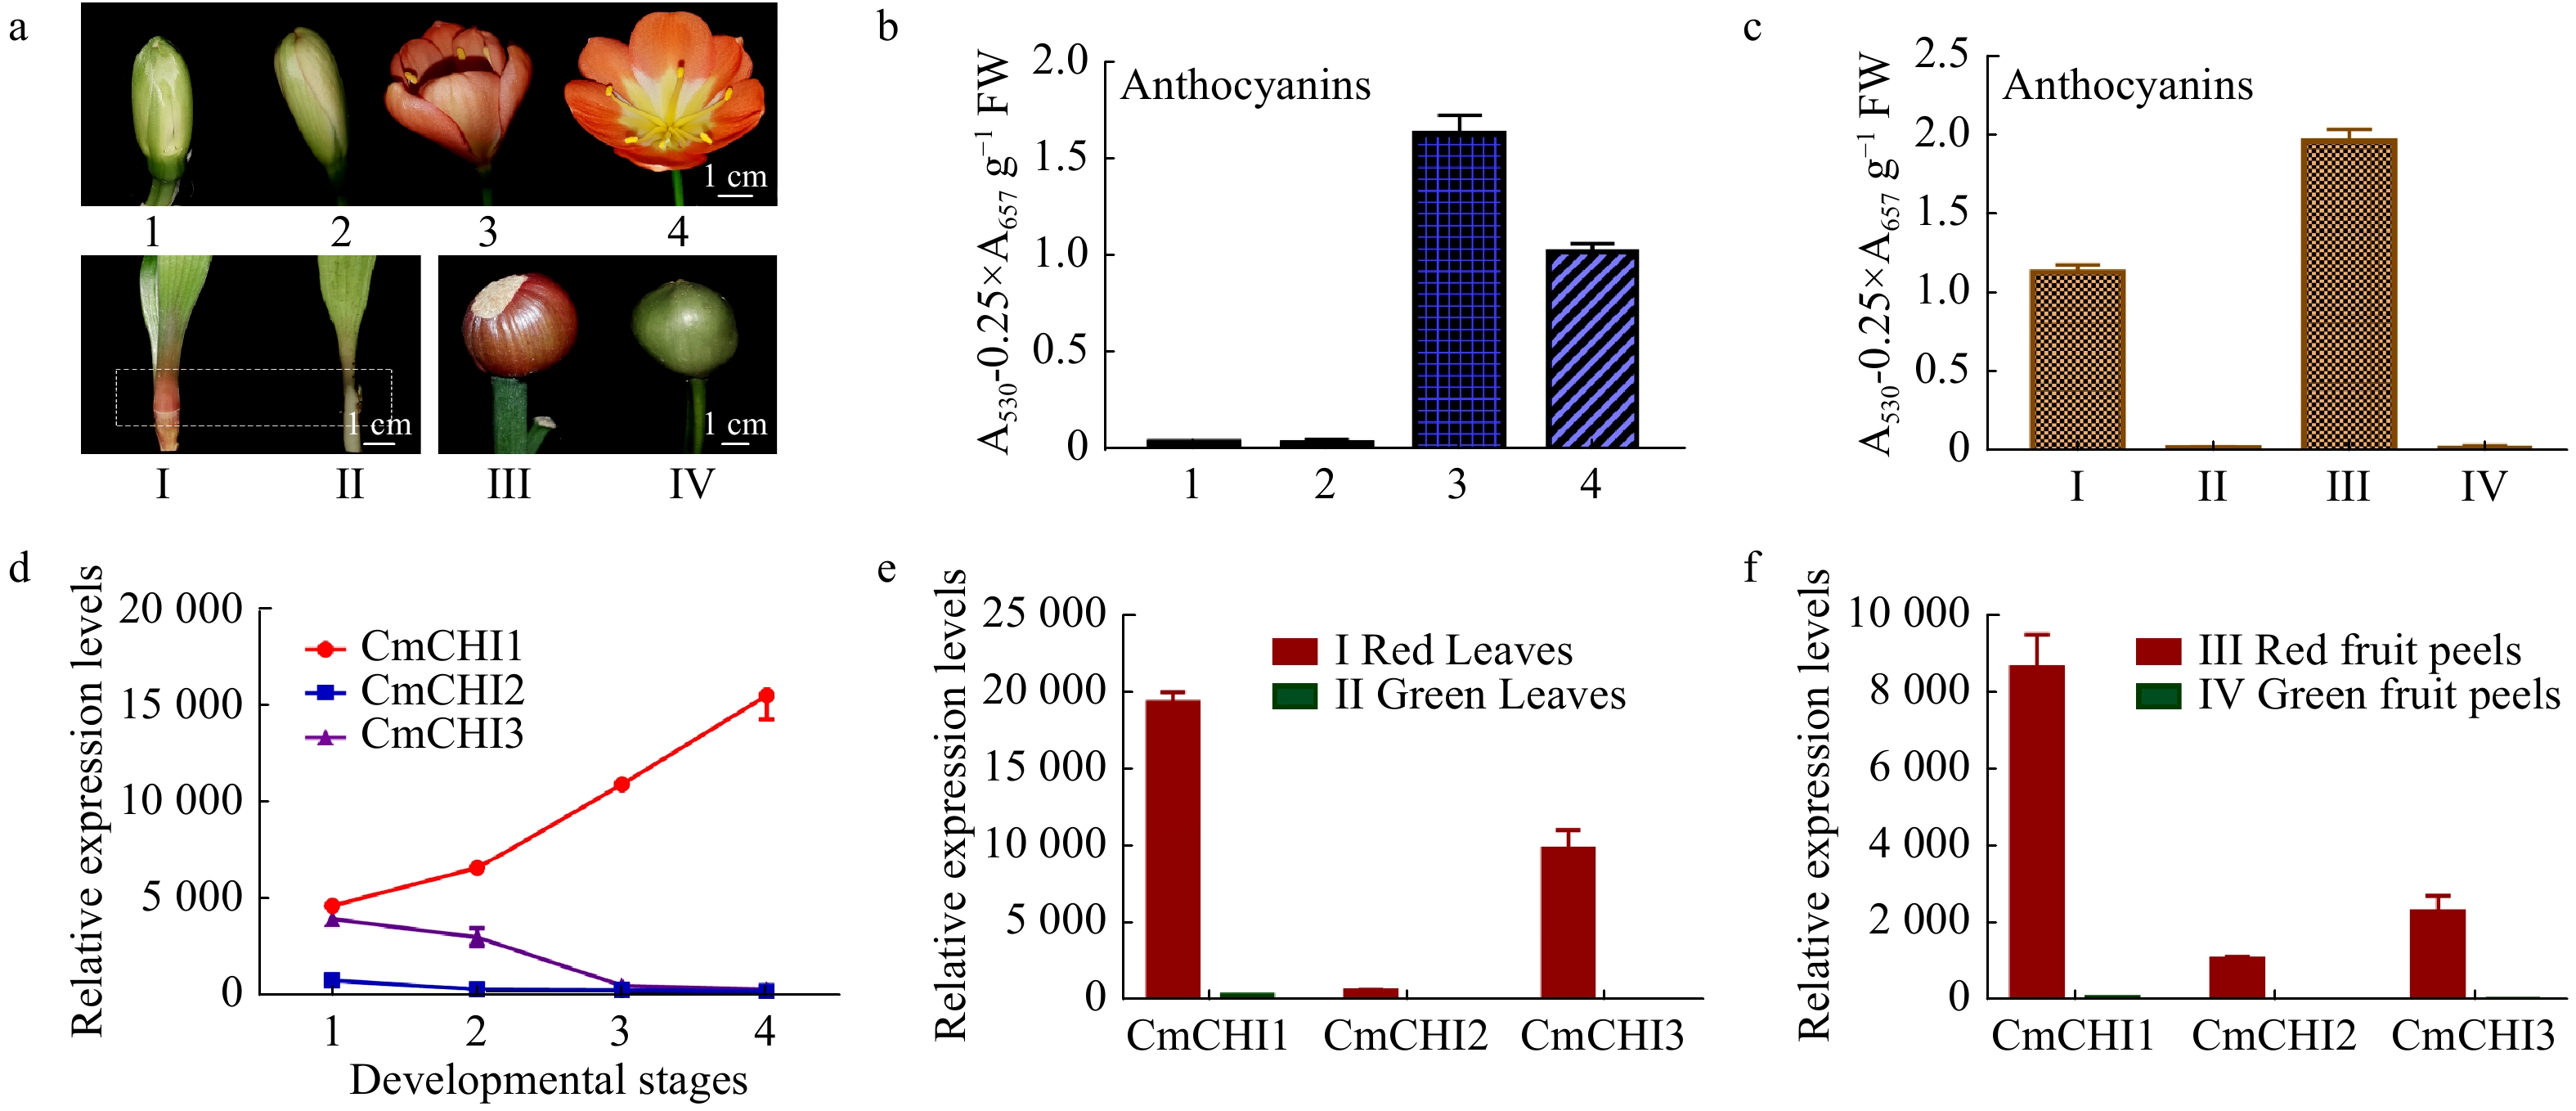
Figure 4. The total anthocyanin content and CmCHI expression levels in different colored tissues of C. miniata. (a) The materials of C. miniata used in total anthocyanin analysis. 1−4 represent flowers at different developmental stages (flowers with green buds, flowers with white buds, fully pigmented flowers before complete blooming, fully opened flowers). I−IV represent different tissues of C. miniata. I and II represent young seedlings with differently colored leaf bases. The rectangle with dotted lines indicates the sample position. III and IV indicate fruit peels with different color. (b) The total anthocyanins detected in C. miniata flowers at different developmental stages. (c) The total anthocyanins detected in different colored leaf bases and fruit peels of C. miniata. (d) Transcripts of CmCHIs in C. miniata flowers at different developmental stages. 1−4 represent flowers at different developmental stages. (e) The relative expression levels of CmCHIs in different colored leaf bases of C. miniata. (f) The relative expression levels of CmCHIs in different pigmented fruit peels of C. miniata. Data represented means ± S.E. of three biological replicates.
-
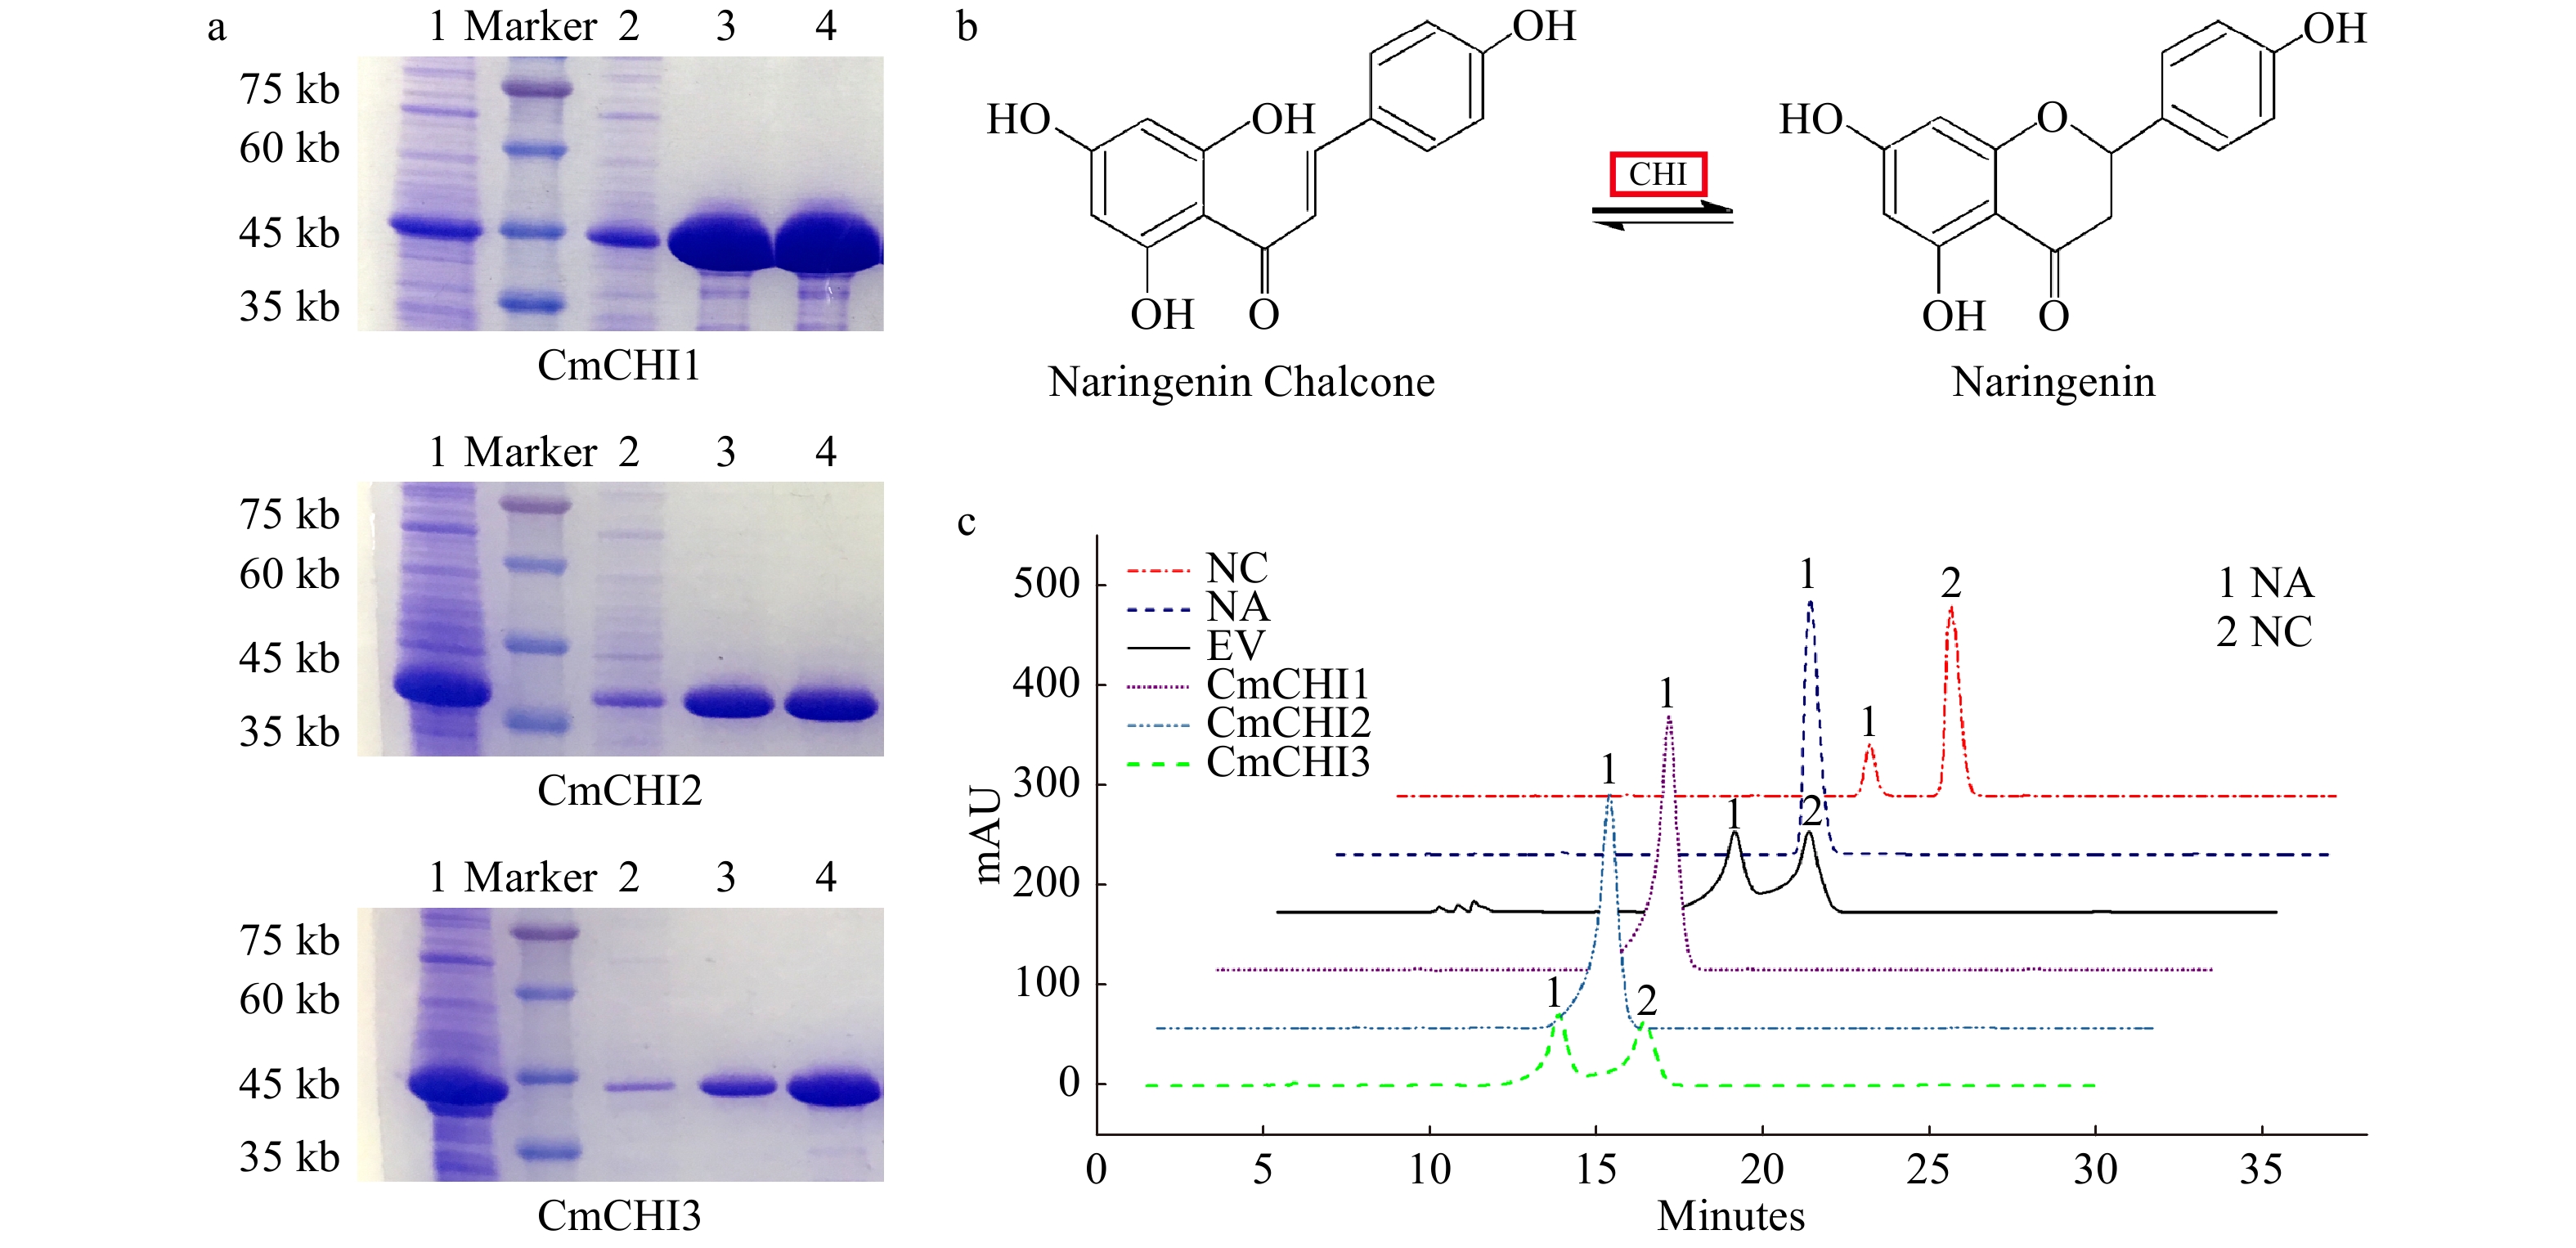
Figure 5. In vitro enzymatic analysis of CmCHI1, CmCHI2 and CmCHI3. (a) The sodium dodecyl sulfate polyacrylamide gel electrophoresis (SDS-PAGE) of recombinant CmCHIs extracted from Escherichia coli BL21. 1, the induced CmCHI proteins without purification. 2, the uncombined CmCHI proteins after being processed by Ni column. 3−4, the purified CmCHI proteins eluted from Ni column with 20 mM or 100 mM imidazole in PBS. (b) The catalytic mechanism of chalcone isomerase on naringenin chalcone to produce naringenin. (c) HPLC analysis of the reaction products of CmCHIs and naringenin chalcone. Assay mixtures contained CmCHI protein extracts derived from E. coli harboring pET32-CmCHI1, pET32-CmCHI2 and pET32-CmCHI1 with NC as a substrate. Chromatograms were recorded at the UV absorbance wavelength of 304 nm. The identification of the naringenin product was confirmed based on relative retention time, UV spectra and the standard naringenin. NC, naringenin chalcone; NA, naringenin; and EV, empty vector.
-
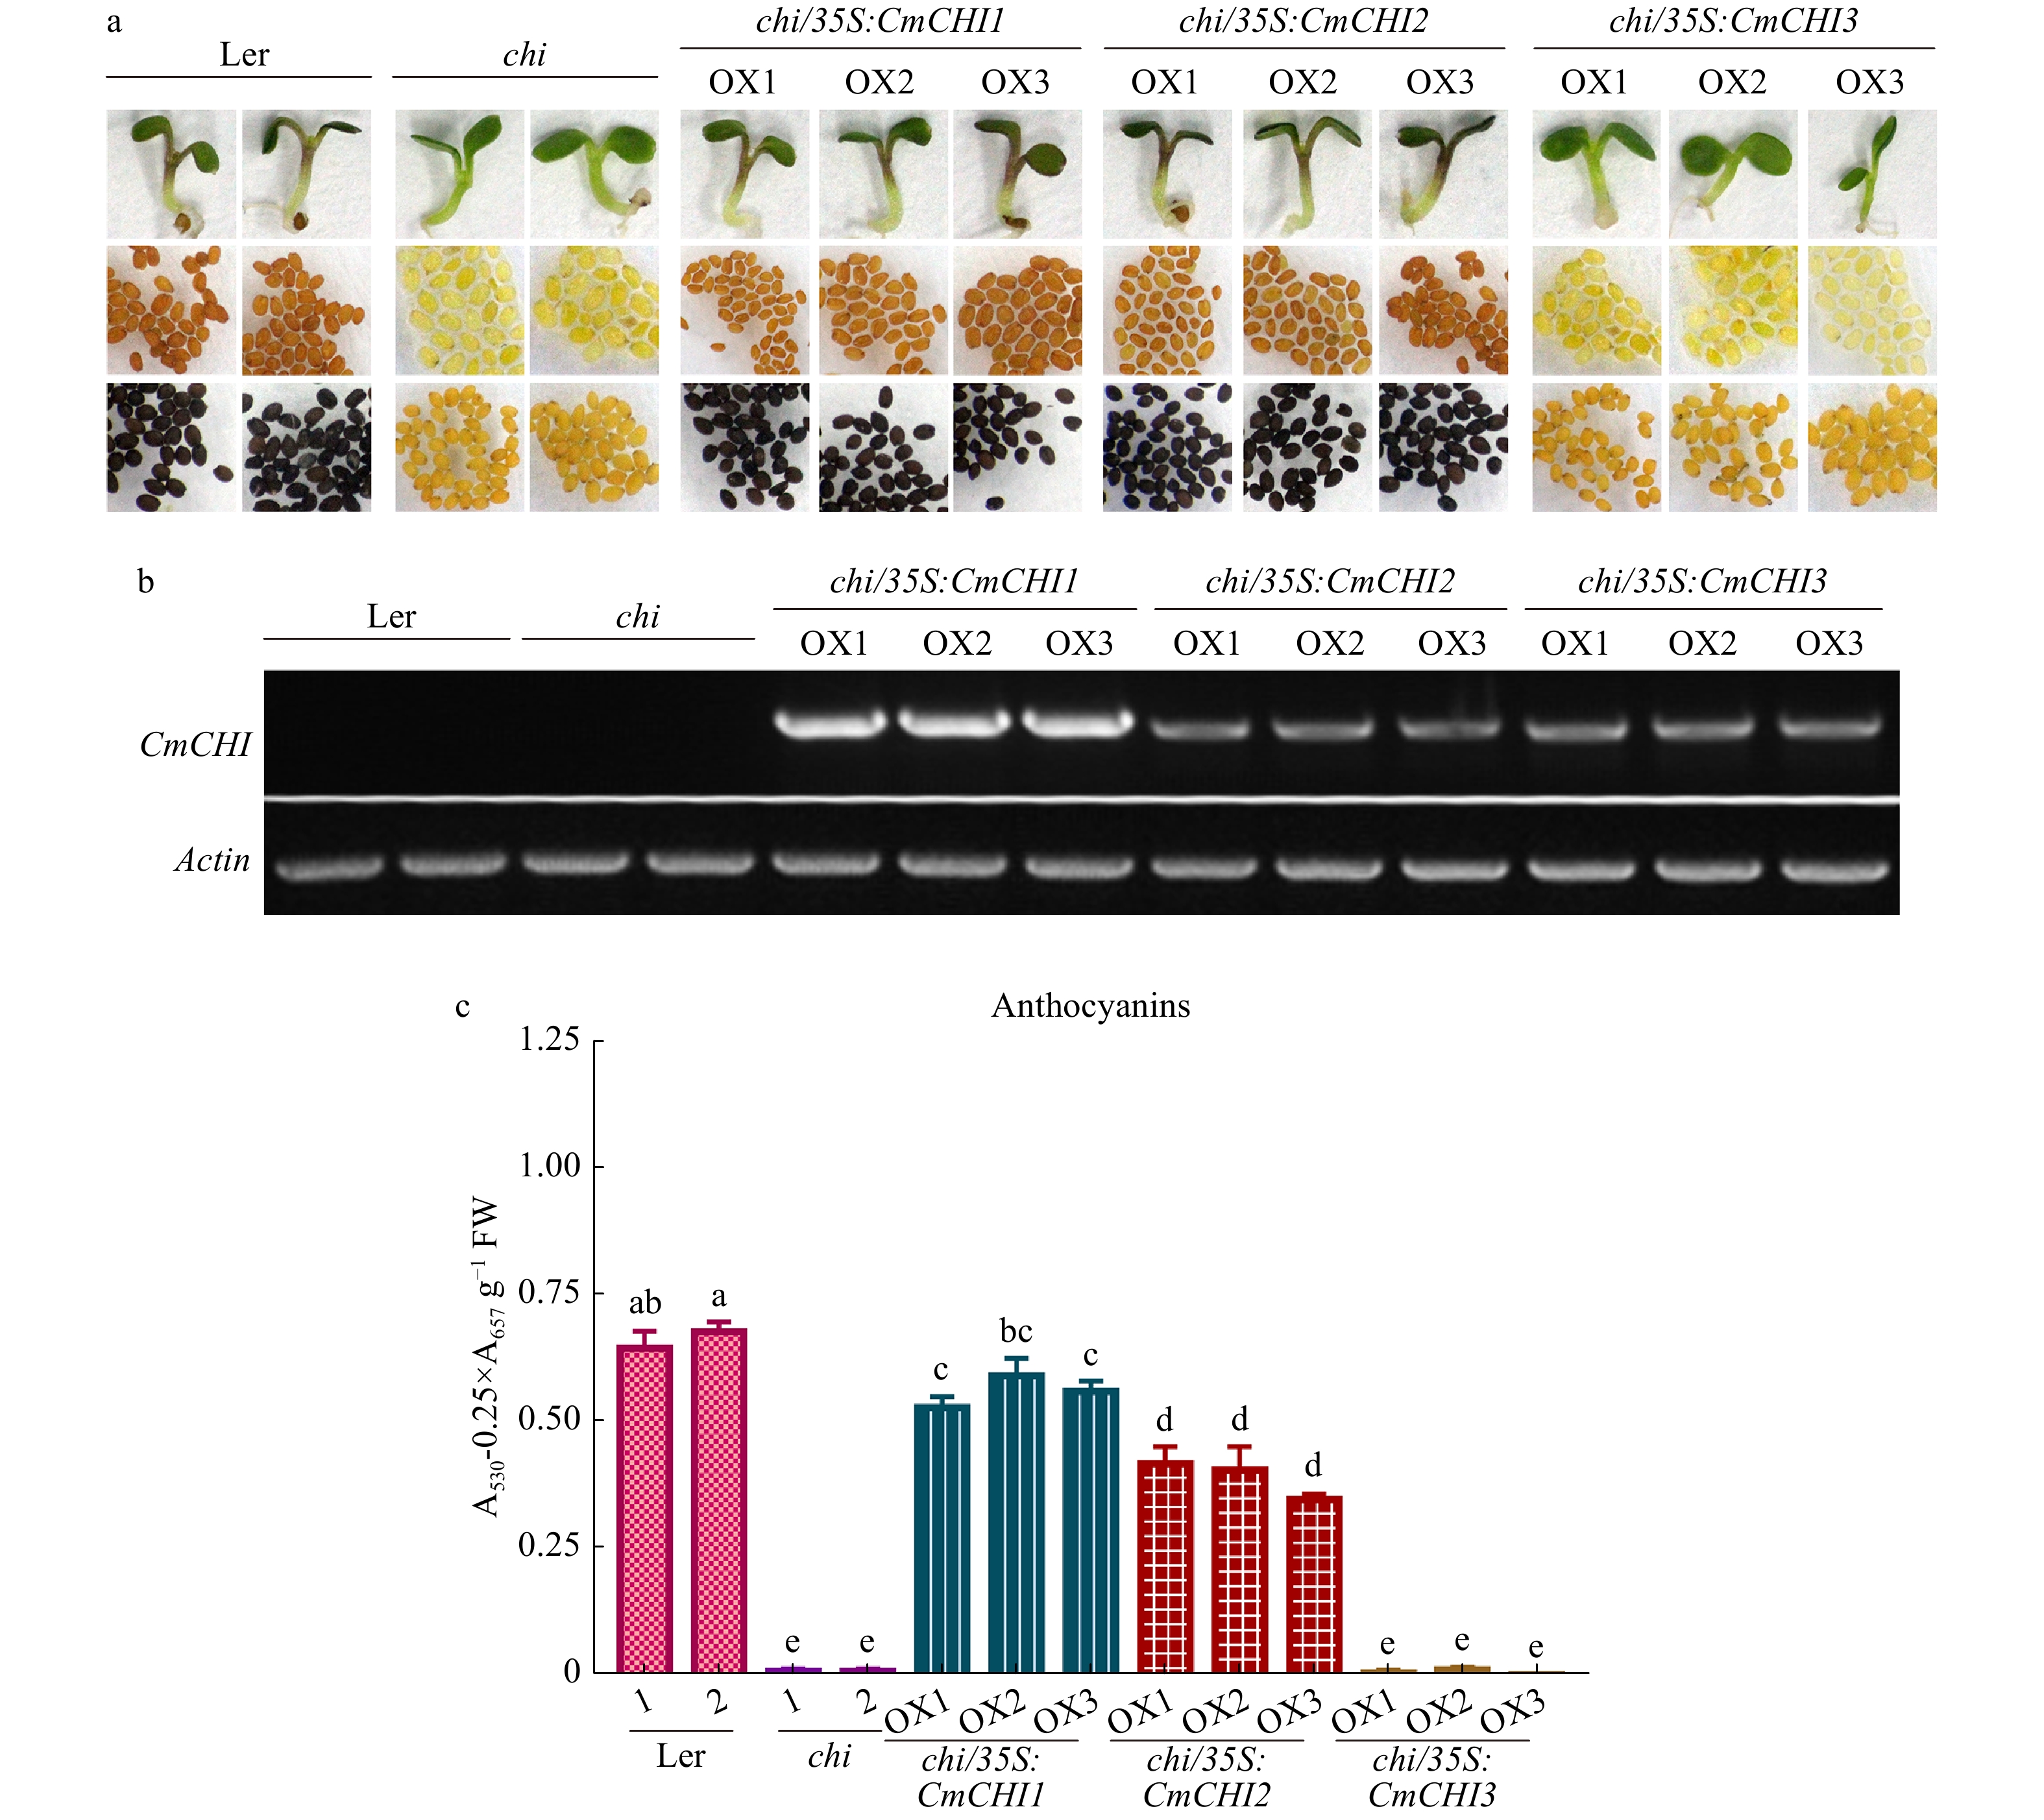
Figure 6. Complementation of Arabidopsis tt5-1 mutant (chi) overexpressing CmCHI1, CmCHI2 and CmCHI3. (a) The seed coats, cotyledons and hypocotyls of wild-type (Ler-0), tt5-1 mutant (chi) and T2 transgenic lines. DMACA was used to stain and indicate proanthocyanidins in seeds. (b) Expression analysis of CmCHIs by reverse transcription polymerase chain reaction in the wild-type (Ler-0), tt5-1 mutant (chi) and transgenic lines. (c) Total anthocyanins in the wild-type, tt5-1 mutant (chi) and transgenic lines. Data represented means ± S.E. of three biological replicates. One-way ANOVA was carried out to compare statistical differences (Duncan's test, p < 0.05).
Figures
(6)
Tables
(0)