-
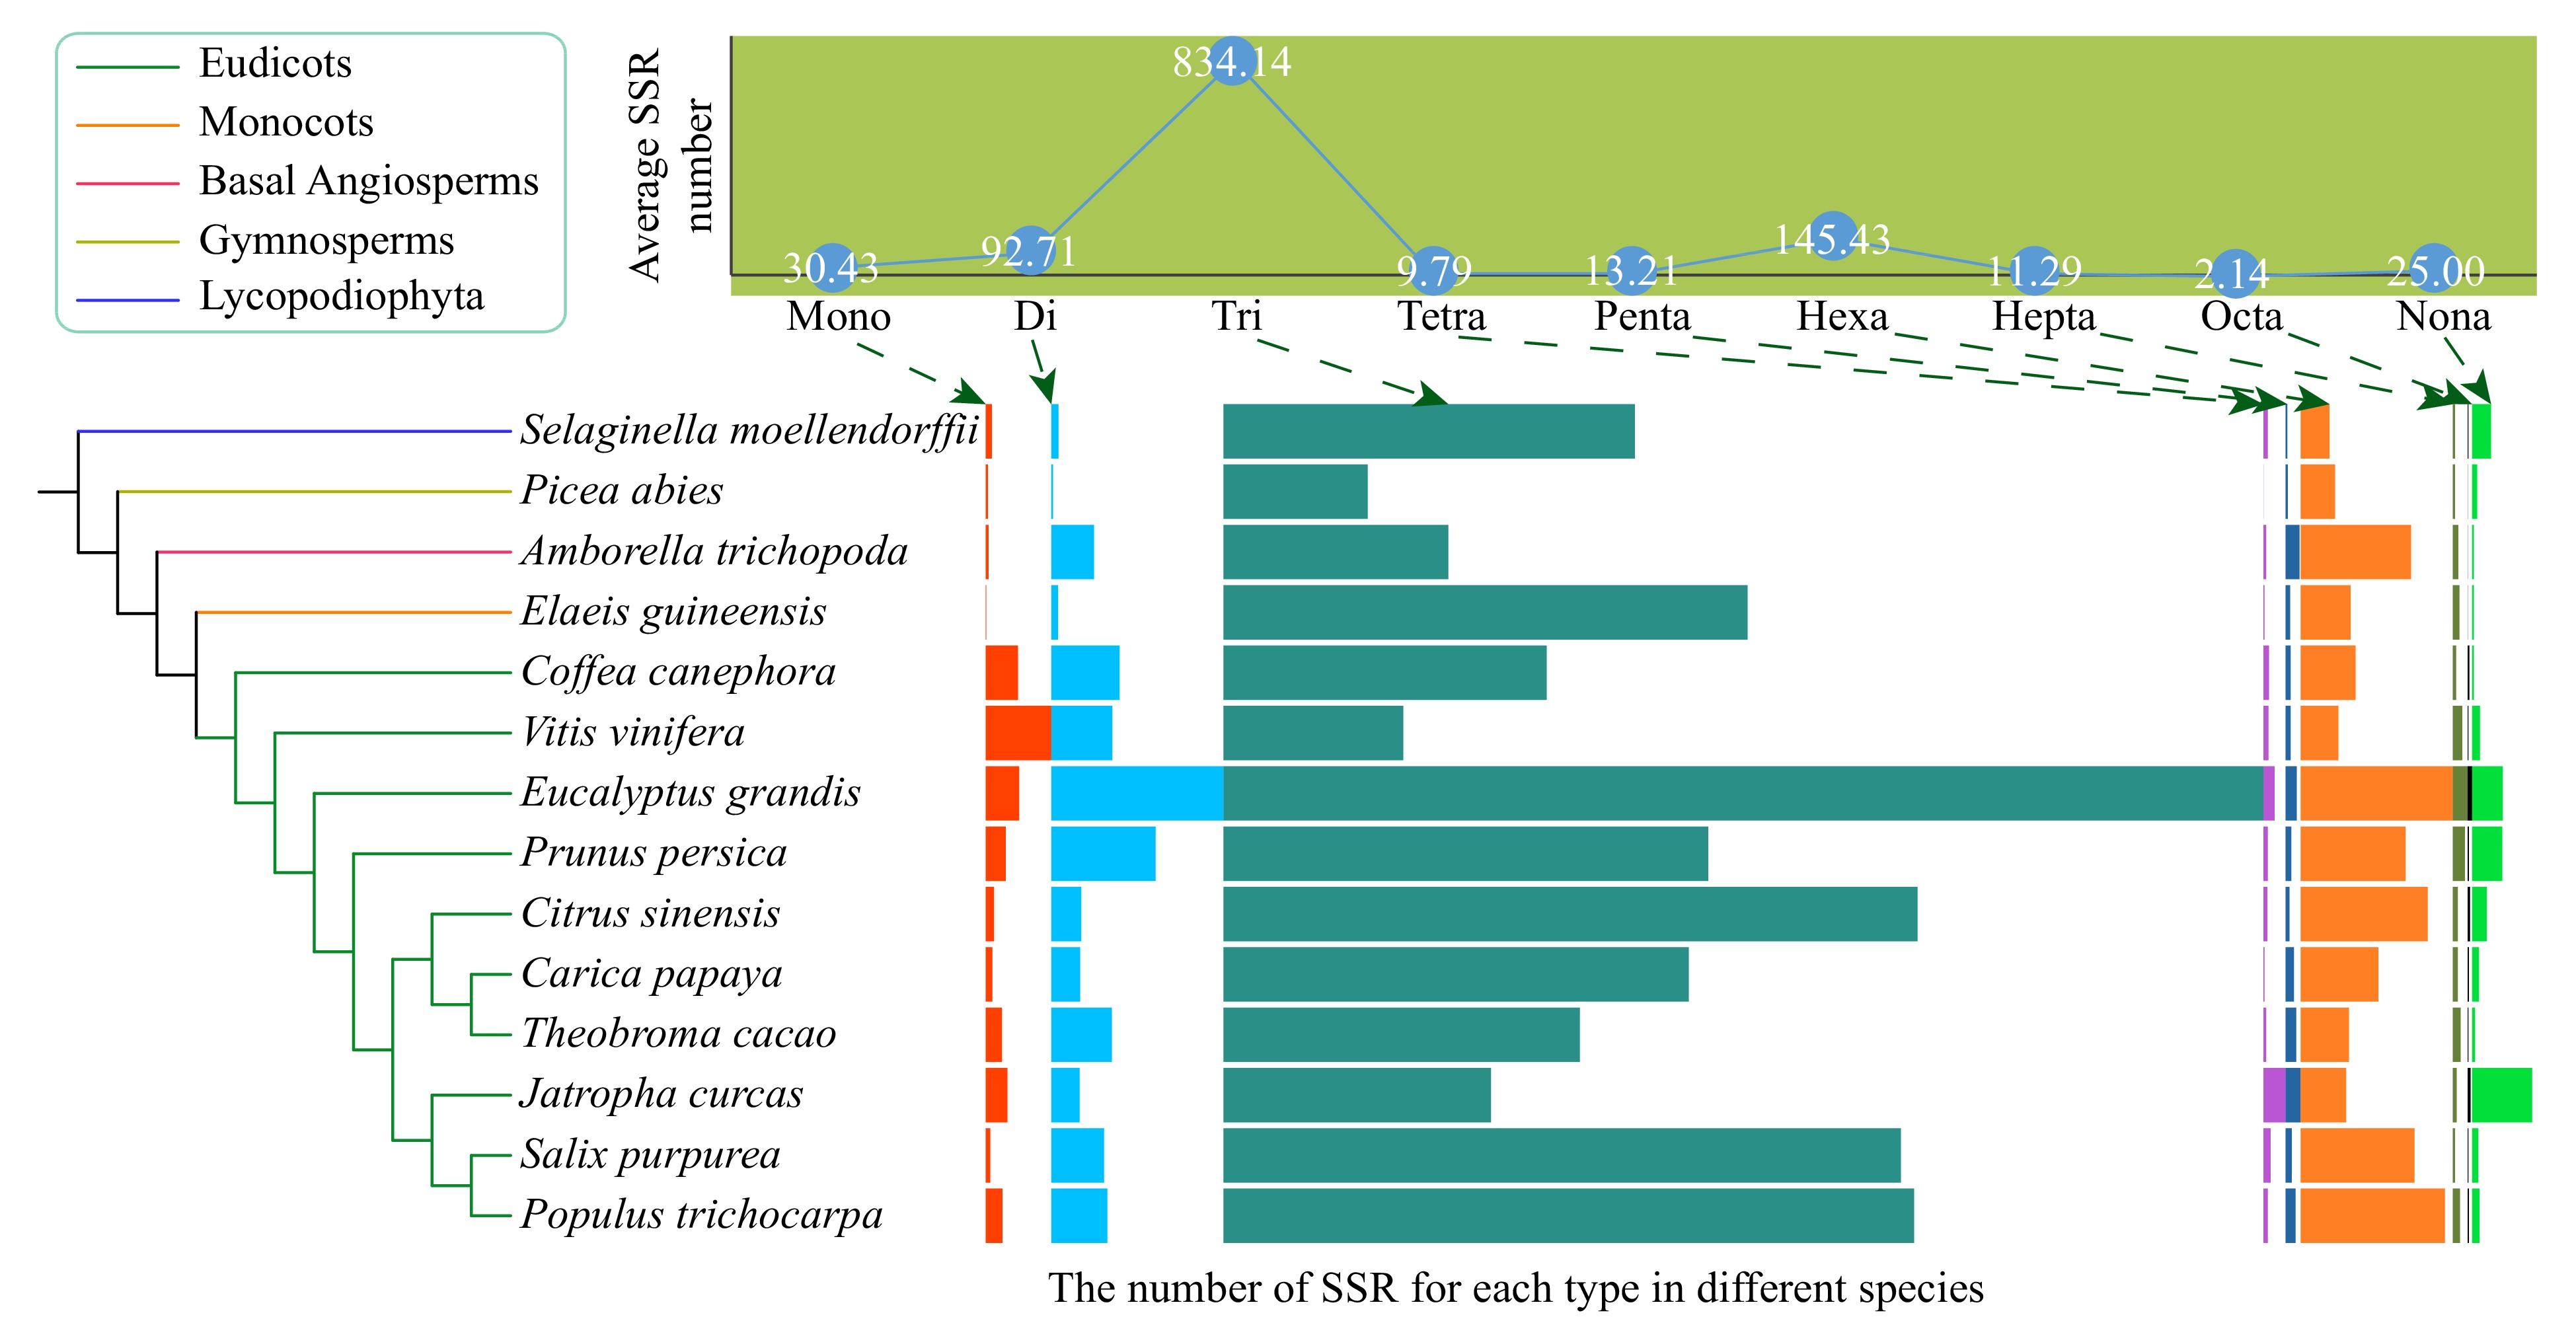
Figure 1. The average number of nine types (mono- to nona-) of simple sequence repeats (SSRs) and their distribution in the 14 species, including ten eudicots, one monocot, one basal angiosperm, one gymnosperm, and one Lycopodiophyta species. The boxplots indicate the number of SSR for each type in different species. The boxplots indicate the number of SSR for each type in different species.
-
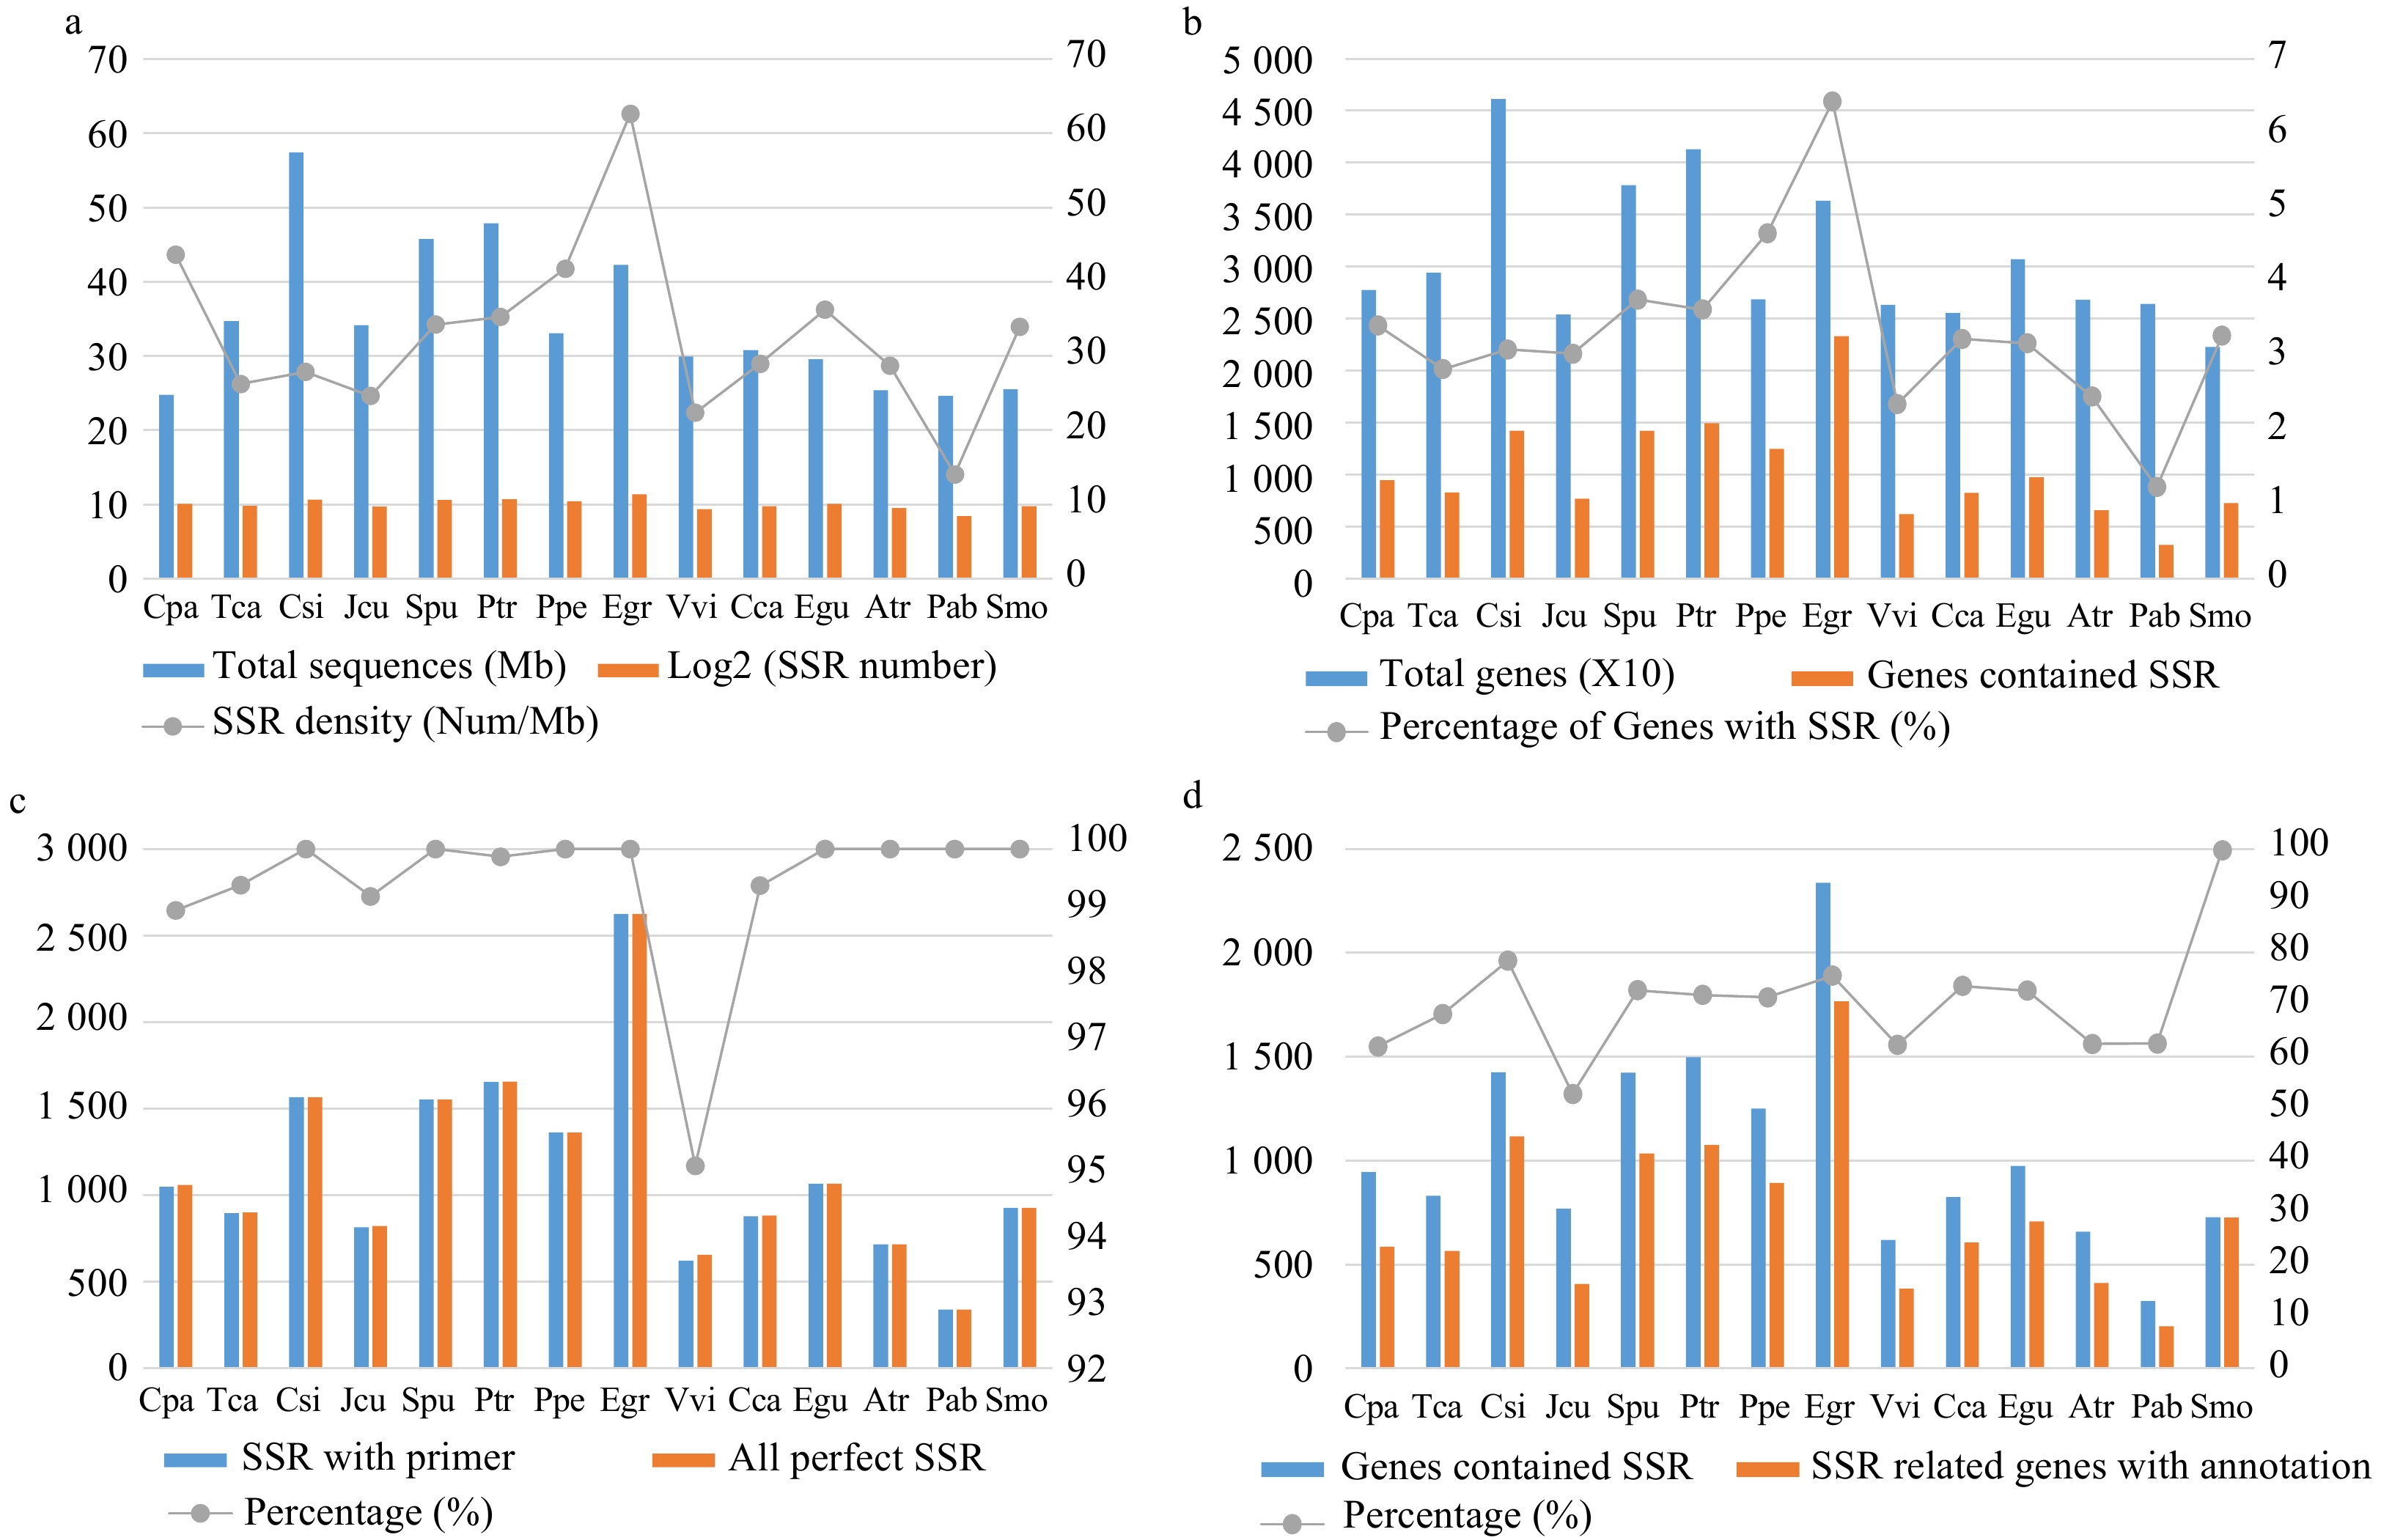
Figure 2. Comparison of the characteristics of simple sequence repeats (SSRs) among the 14 species. (a) The total length of genome sequences and the number and density of SSRs in each species. (b) The total number of genes and the number and percentage of SSR-containing genes in each species. (c) The total number of perfect (non-compounds) SSRs and the number and percentage of SSRs with successfully designed primers in each species. (d) The number of SSR-containing genes and the number and percentage of SSR-containing genes with Pfam annotations in each species.
-
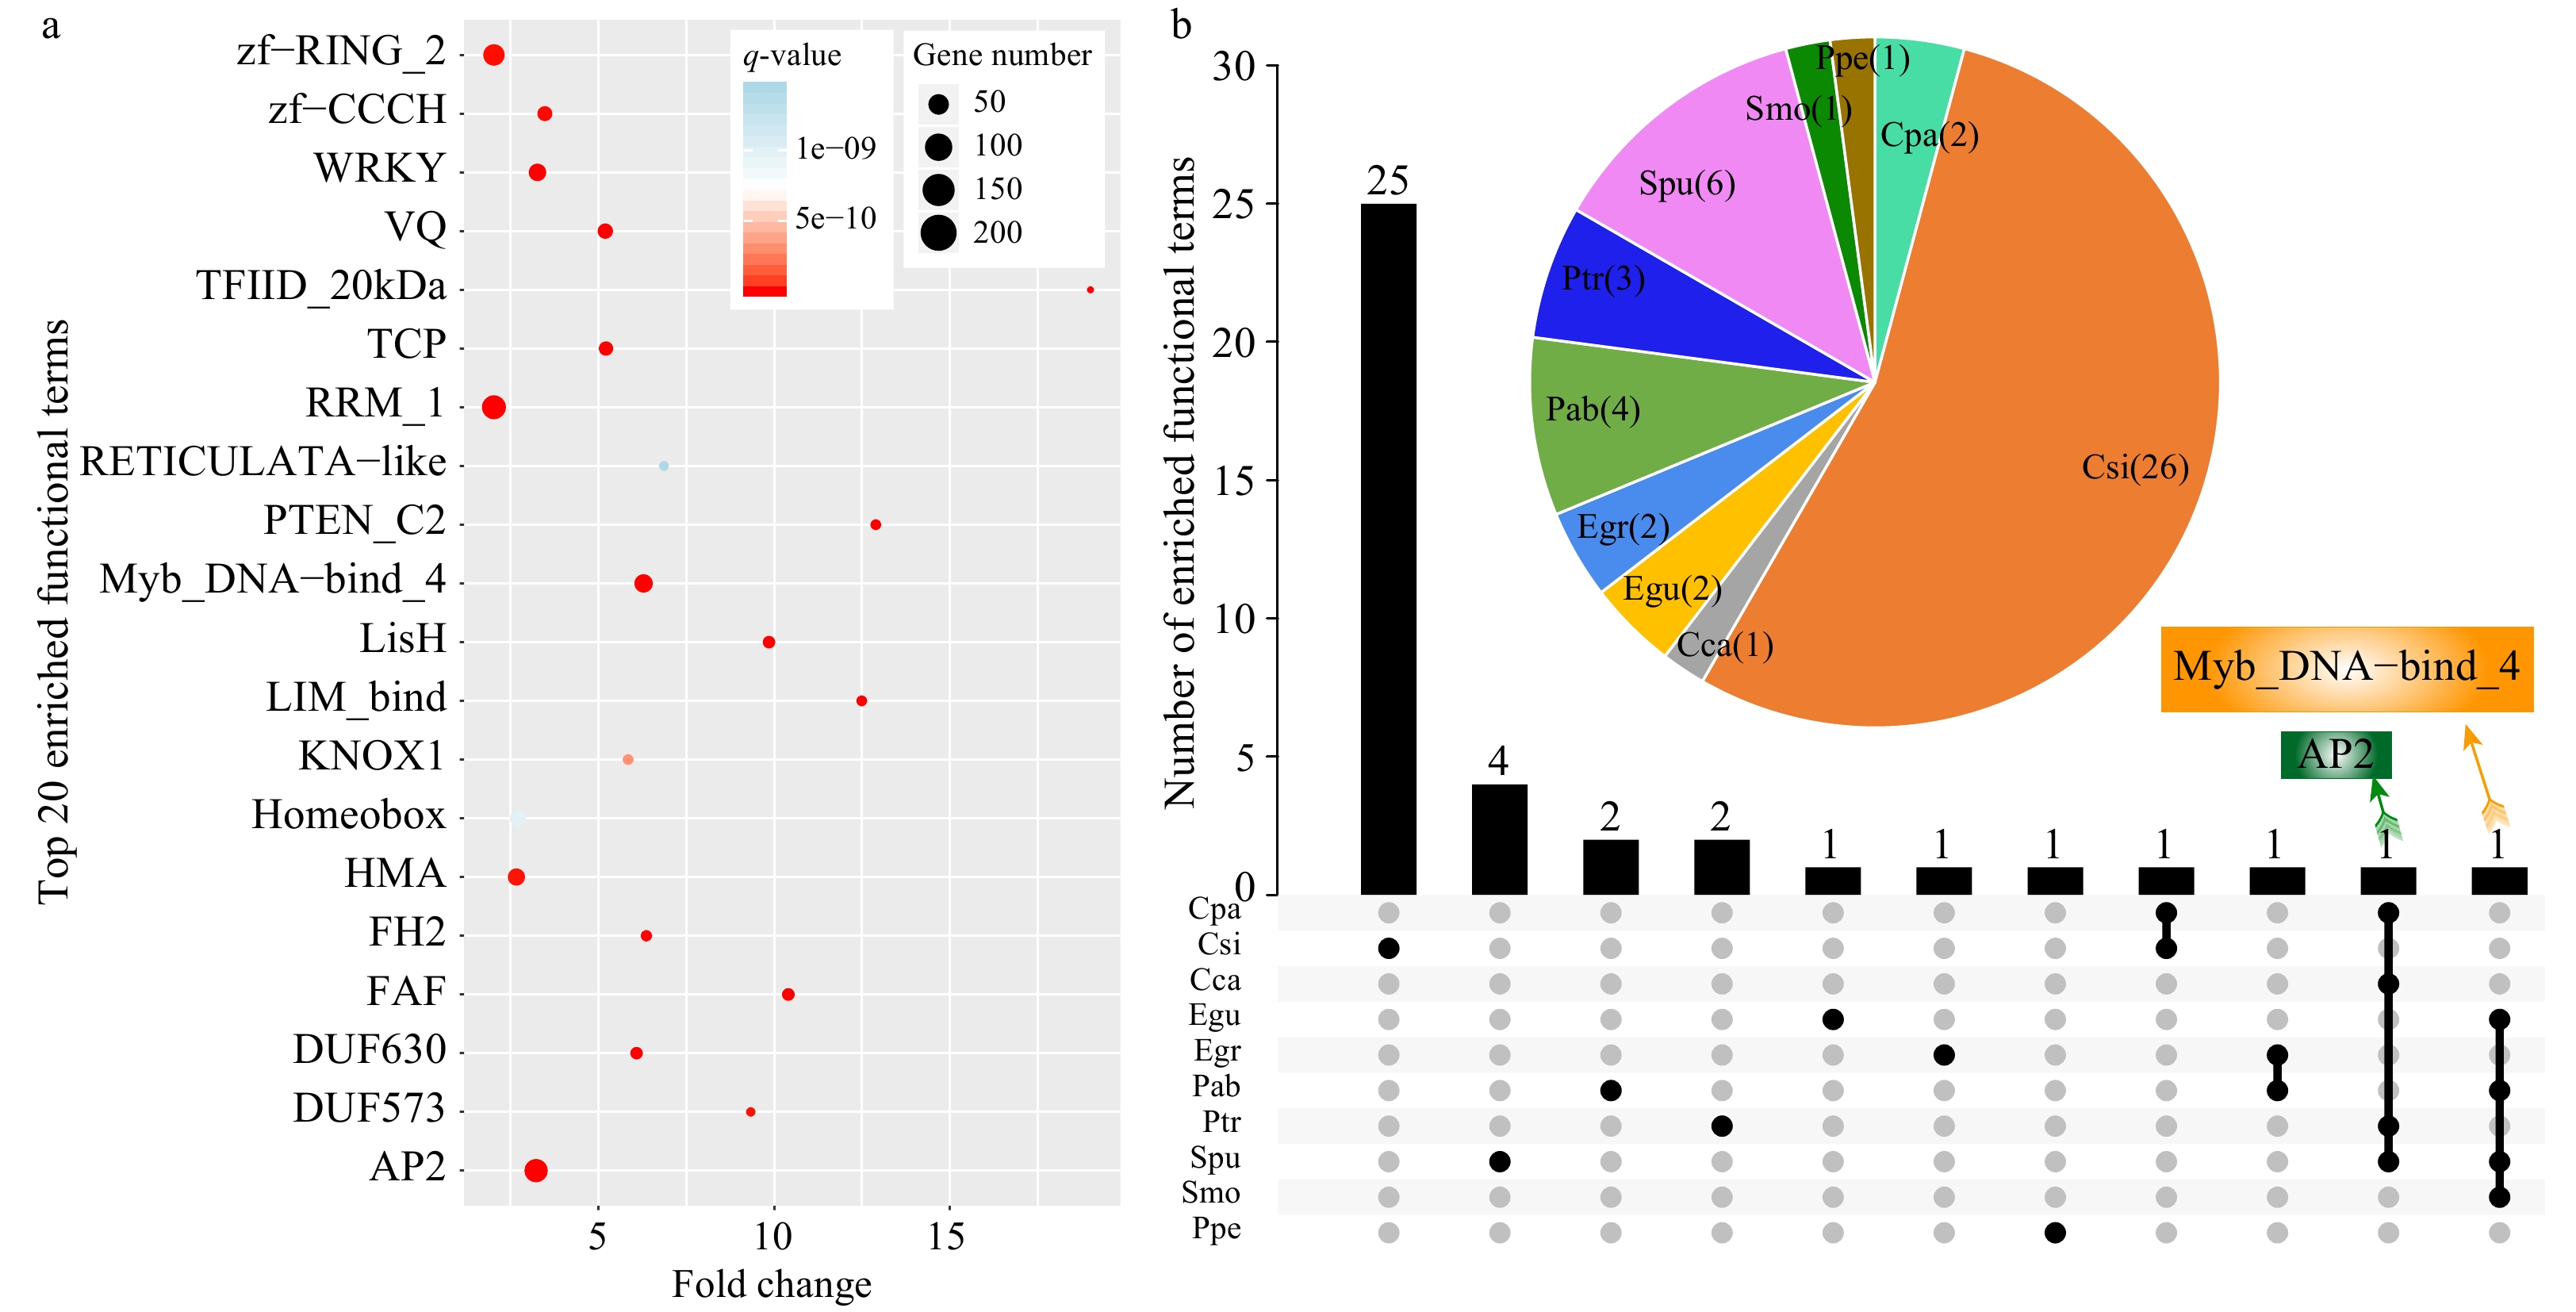
Figure 3. Functional enrichment analysis of SSR-containing genes in the 14 species. (a) The top 20 enriched terms based on Pfam annotations (q-value < 0.01, fold-change ≥ 2). The size of dots indicates the number of enriched genes in each related pathway and the color of dots represents q-values. (b) A Venn diagram showing enriched functional terms common or specific to each species based on Pfam annotations. The pie chart indicates enriched functional terms in each species.
-
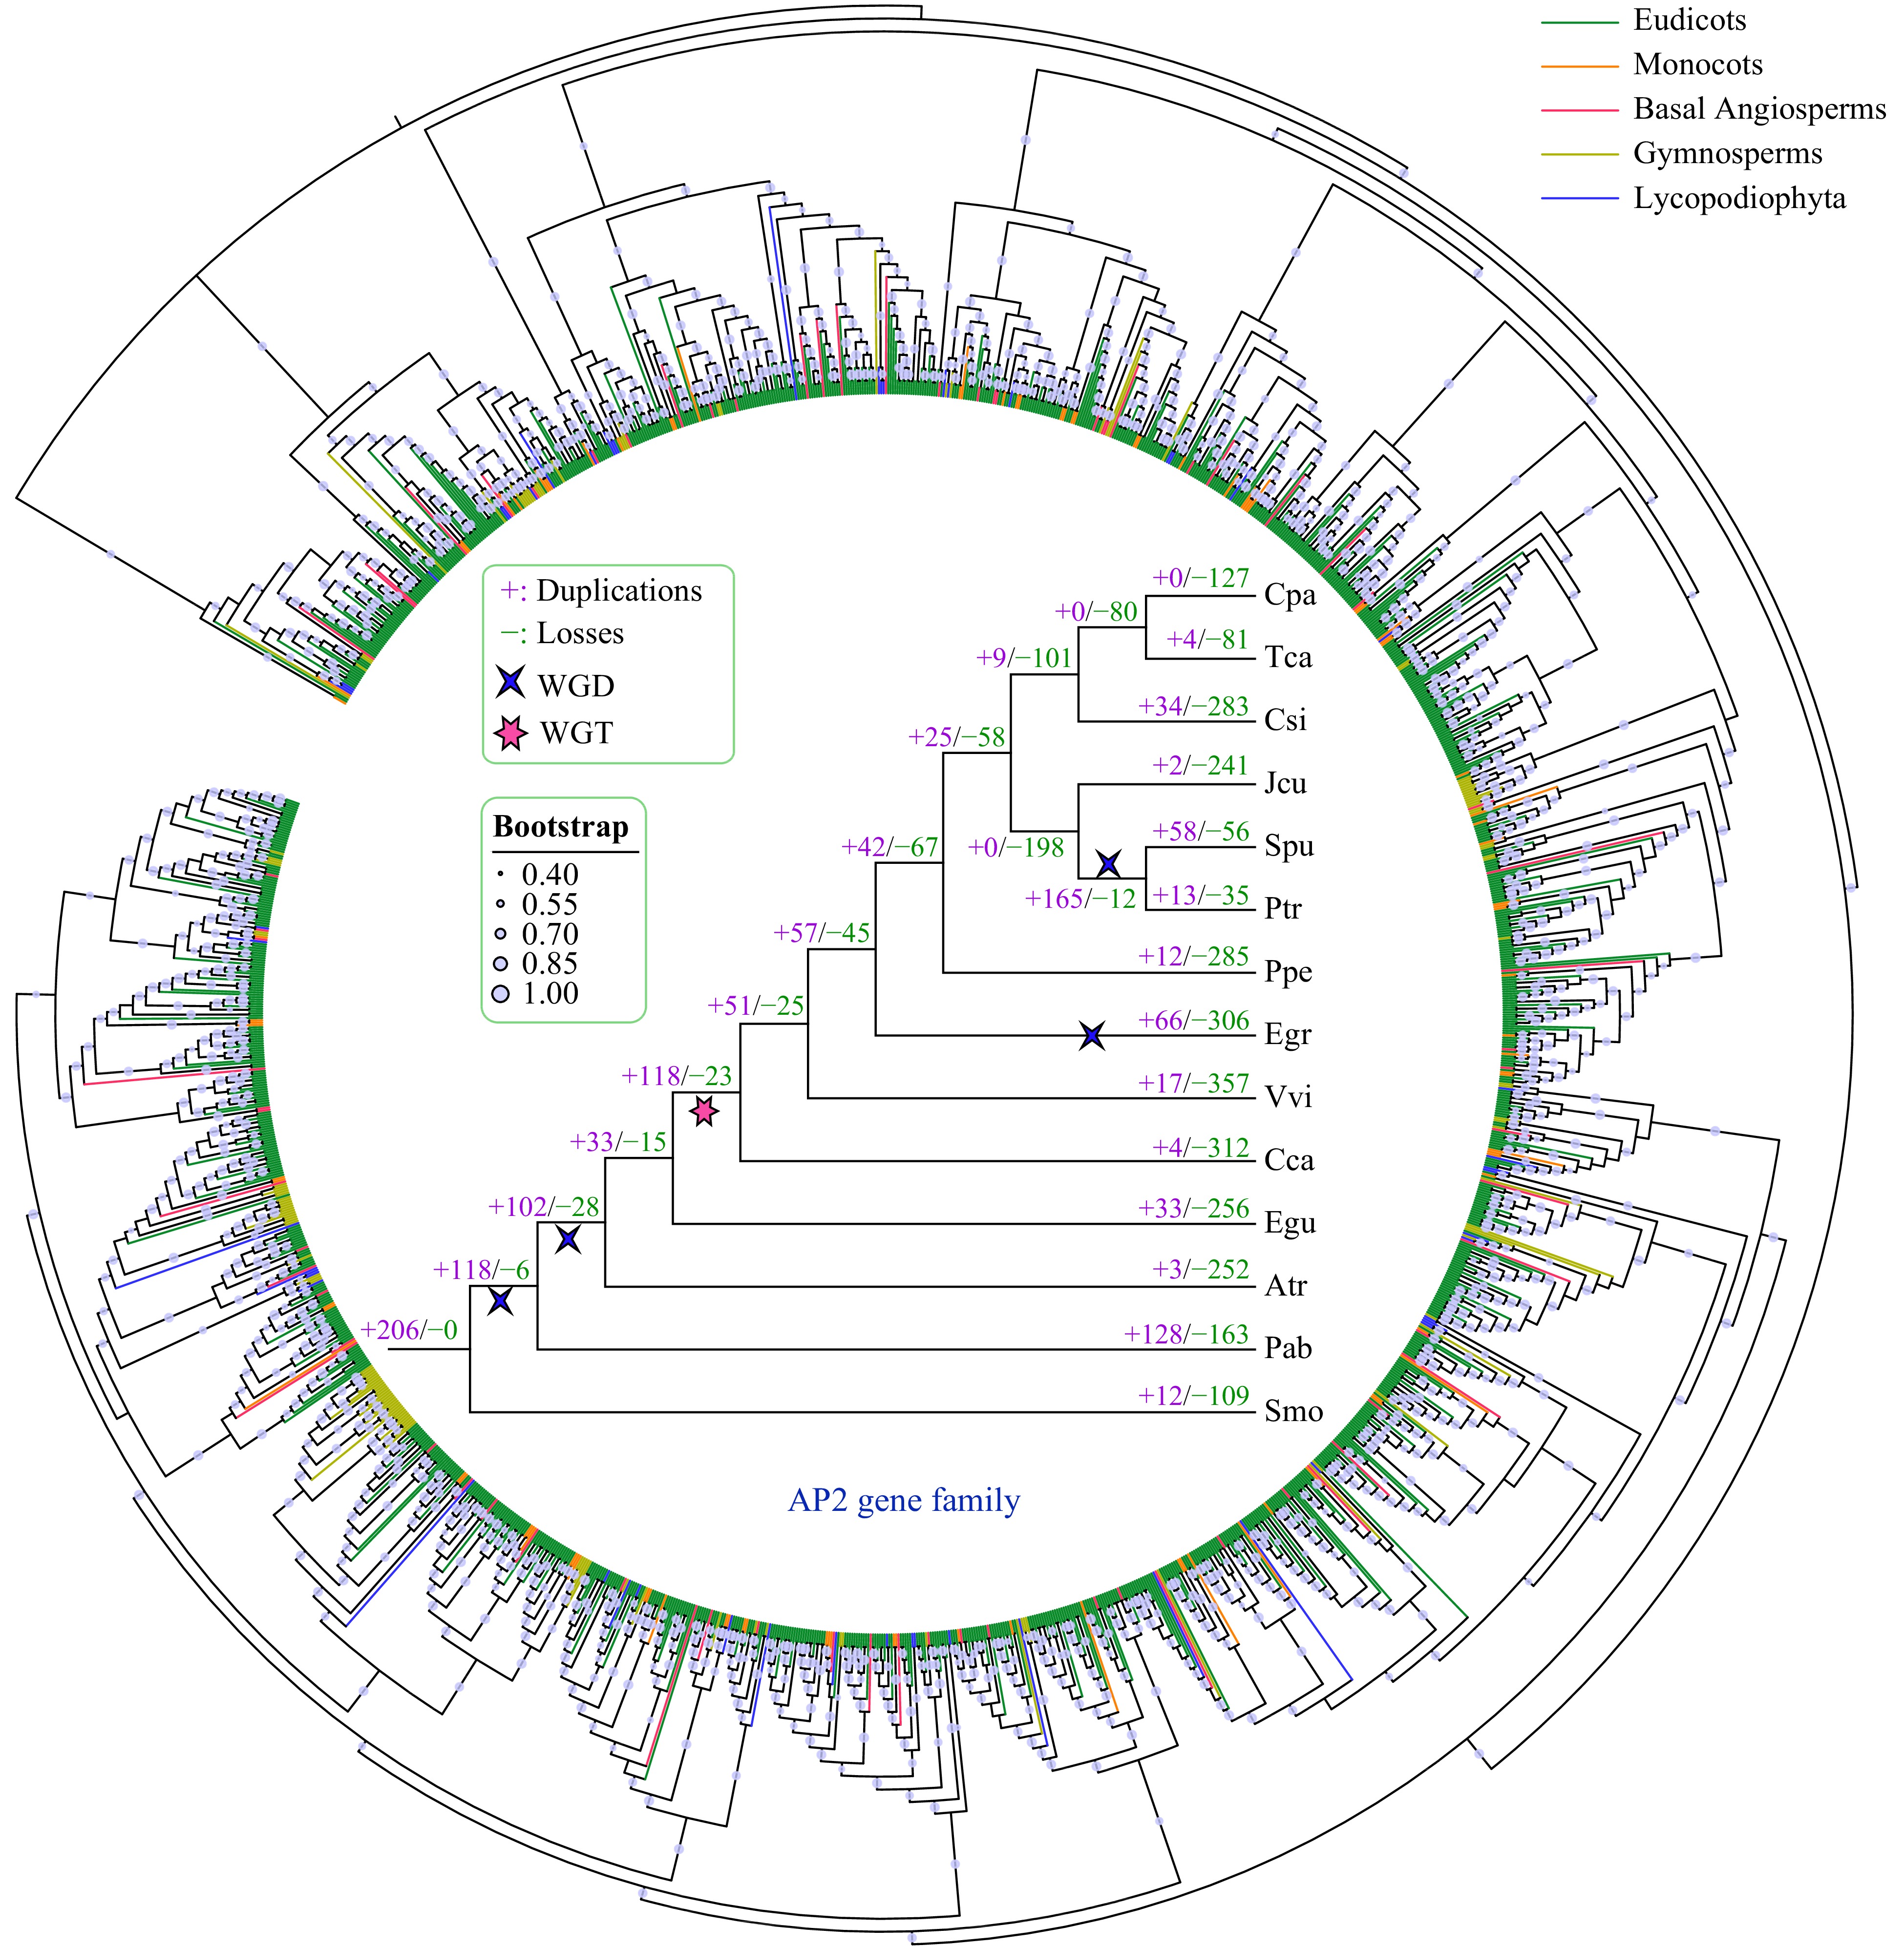
Figure 4. Phylogenetic and gene duplication and loss analyses of the AP2 gene family. The maximum-likelihood (ML) tree was generated based on the amino acid sequences of the AP2 gene family. The phylogenetic tree of the 14 species was constructed using FastTree software with 1000 bootstrap repeats. Bootstrap values greater than 40% are shown on each branch and are proportional to the sizes of dots. Analyses of gene duplication and gene loss events in the AP2 gene family were performed using Notung software. Gene duplication and loss events are indicated by "+" and "−", respectively, on each branch with numbers indicated. WGD and WGT events are also indicated.
-
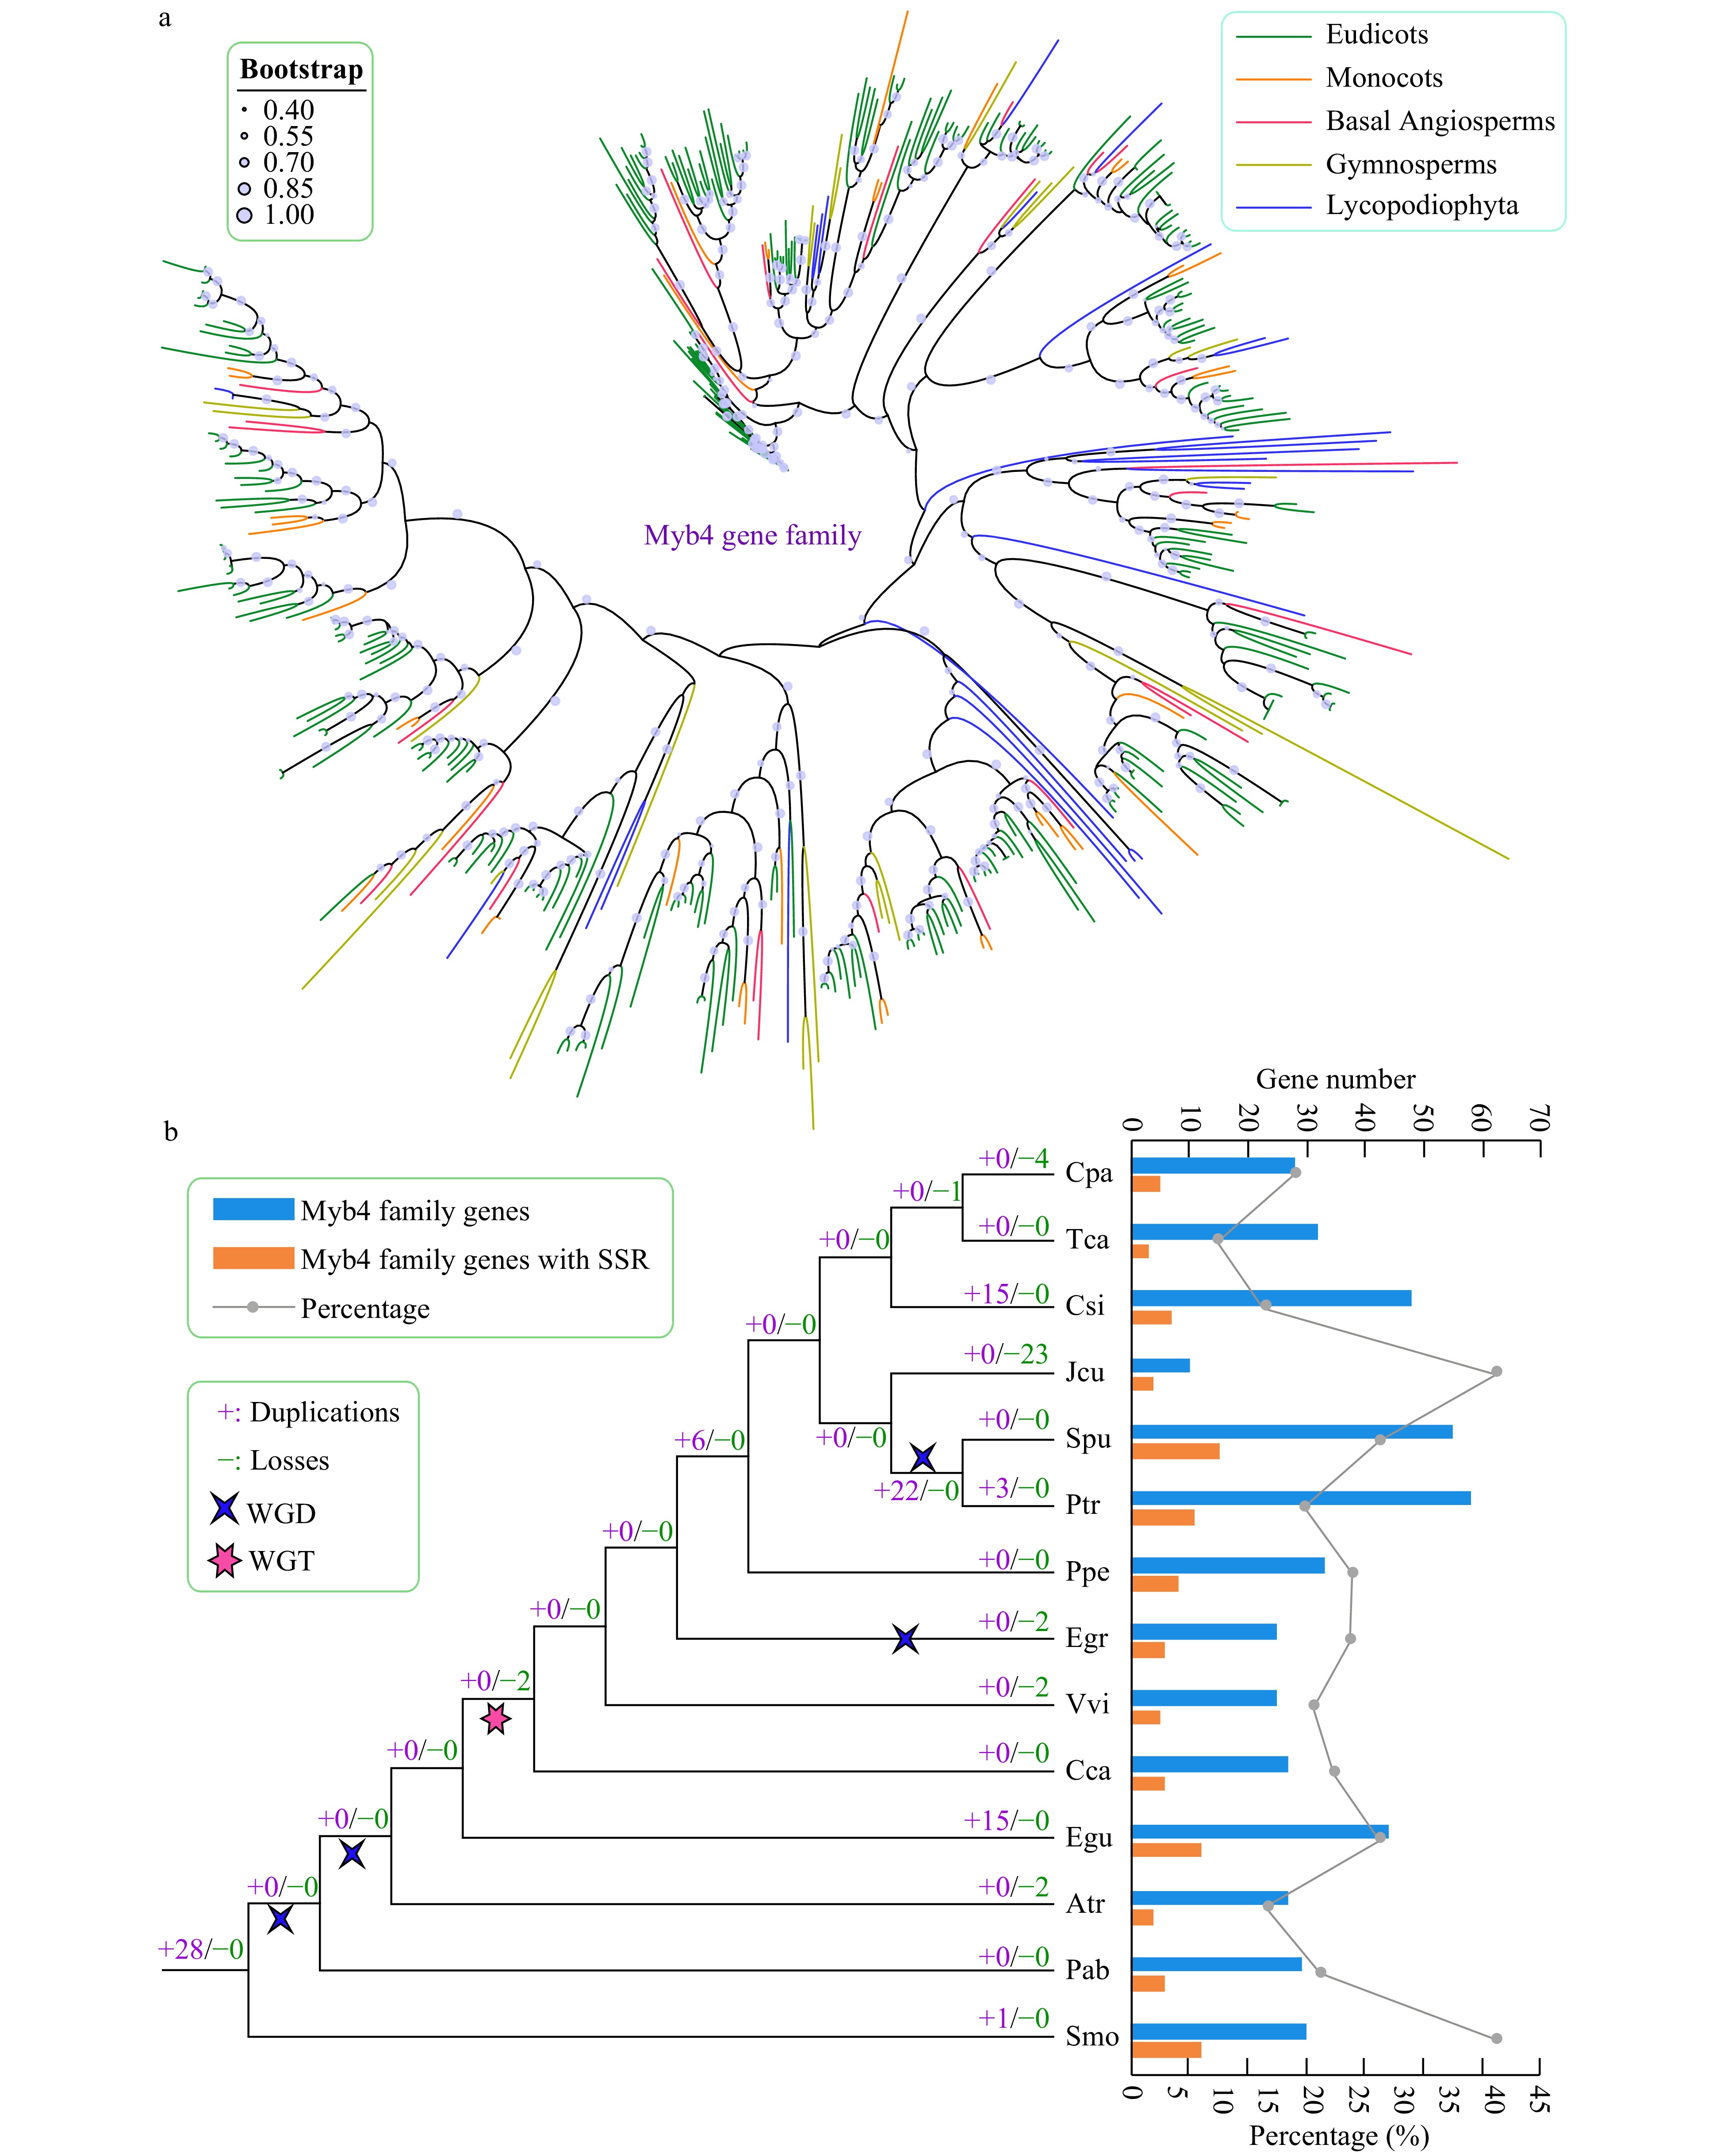
Figure 5. Phylogenetic and gene duplication and loss analyses of the trihelix gene family. (a) The maximum-likelihood (ML) tree was generated based on the amino acid sequences of the Myb_DNA-bind_4 gene family. The phylogenetic tree of the 14 species was constructed using FastTree software with 1,000 bootstrap repeats. Bootstrap values above 40% are shown on each branch and are proportional to the sizes of dots. (b) Analysis of gene duplication and gene loss events of the Myb_DNA-bind_4 gene family was performed using Notung software. Gene duplication and gene loss events are denoted by "+" and "−", respectively, on each branch with numbers indicated. The blue and orange bars indicate the number of trihelix family genes and SSR-containing trihelix family genes in each species, respectively. The line chart shows the percentages of SSR-containing trihelix genes in each species.
Figures
(5)
Tables
(0)