-
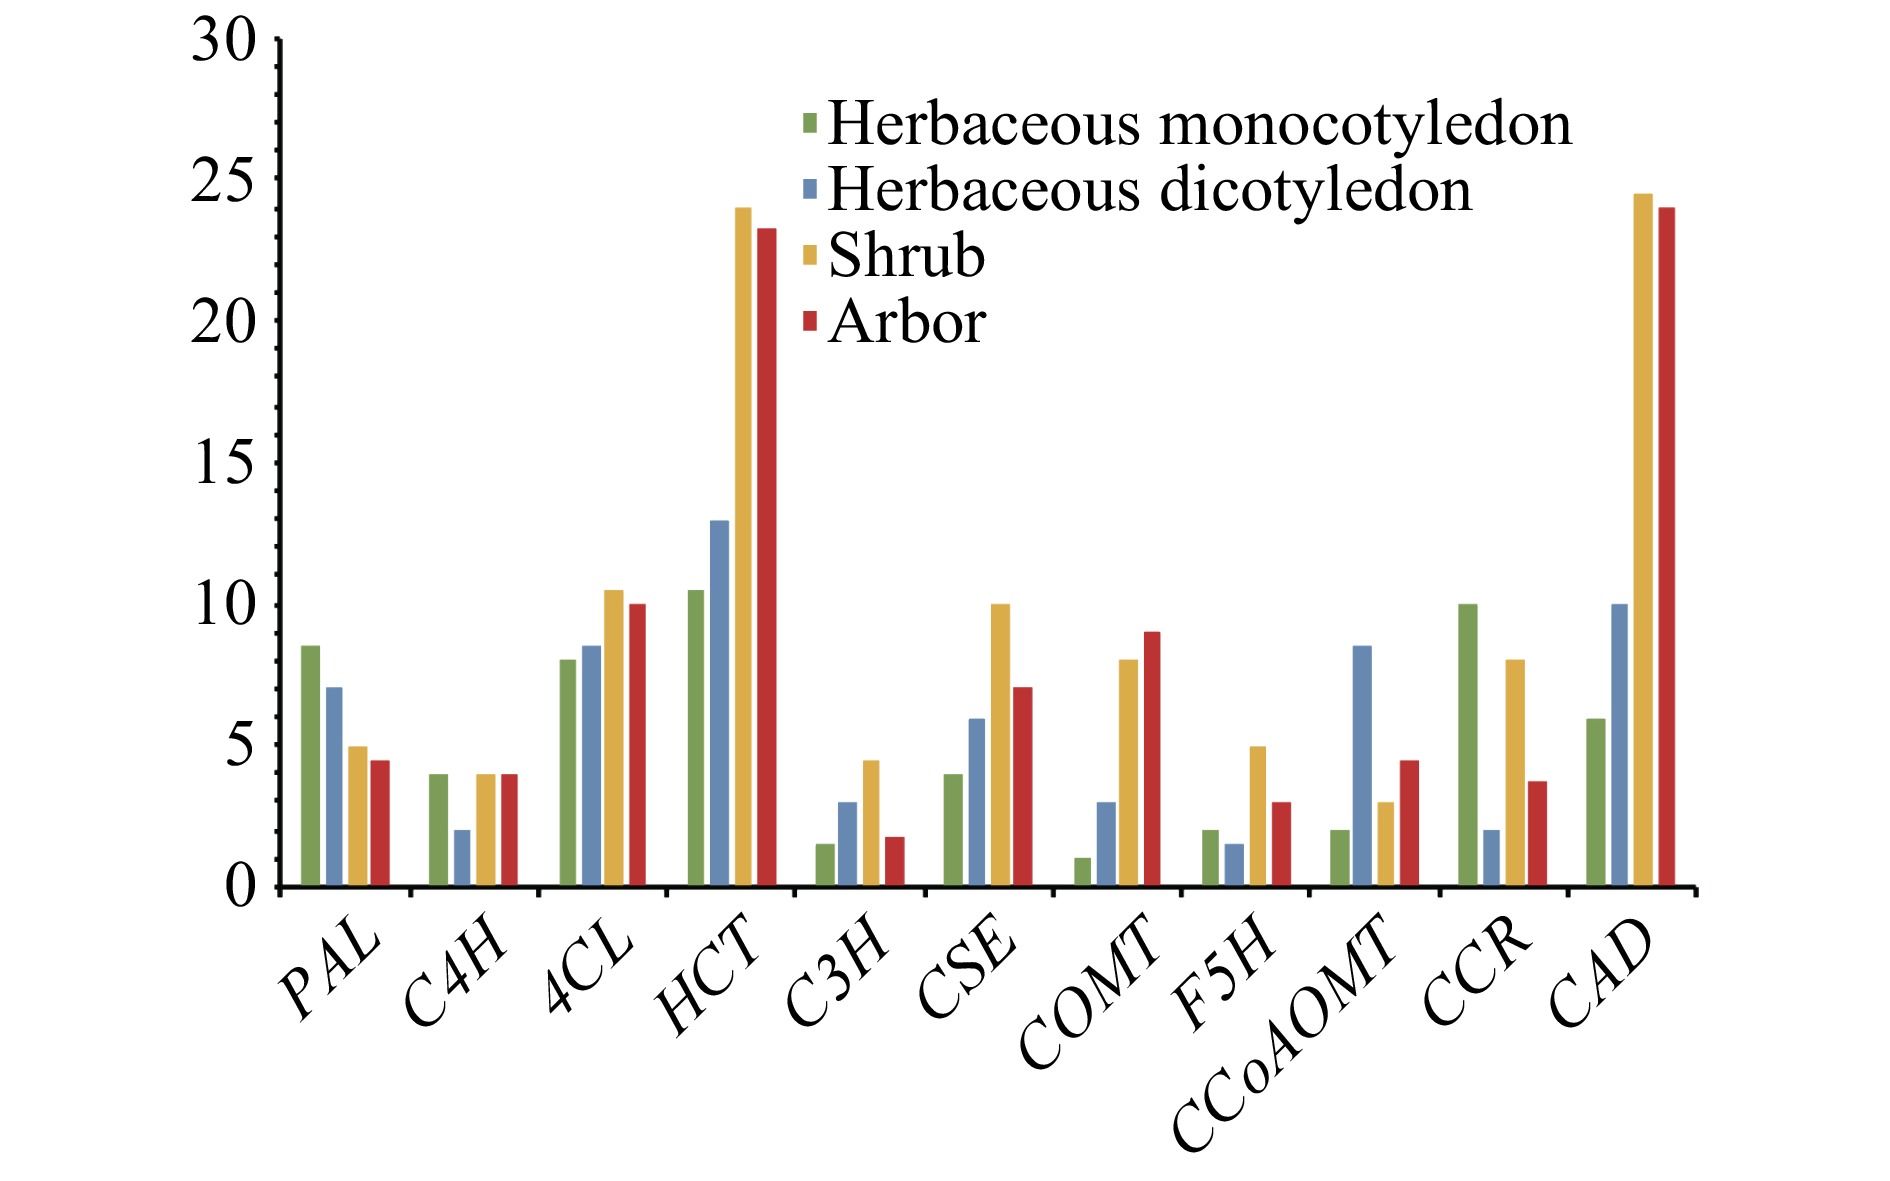
Figure 1. The average gene number in each lignin biosynthesis gene family in herbaceous monocots, herbaceous dicots, shrubs, and trees.
-
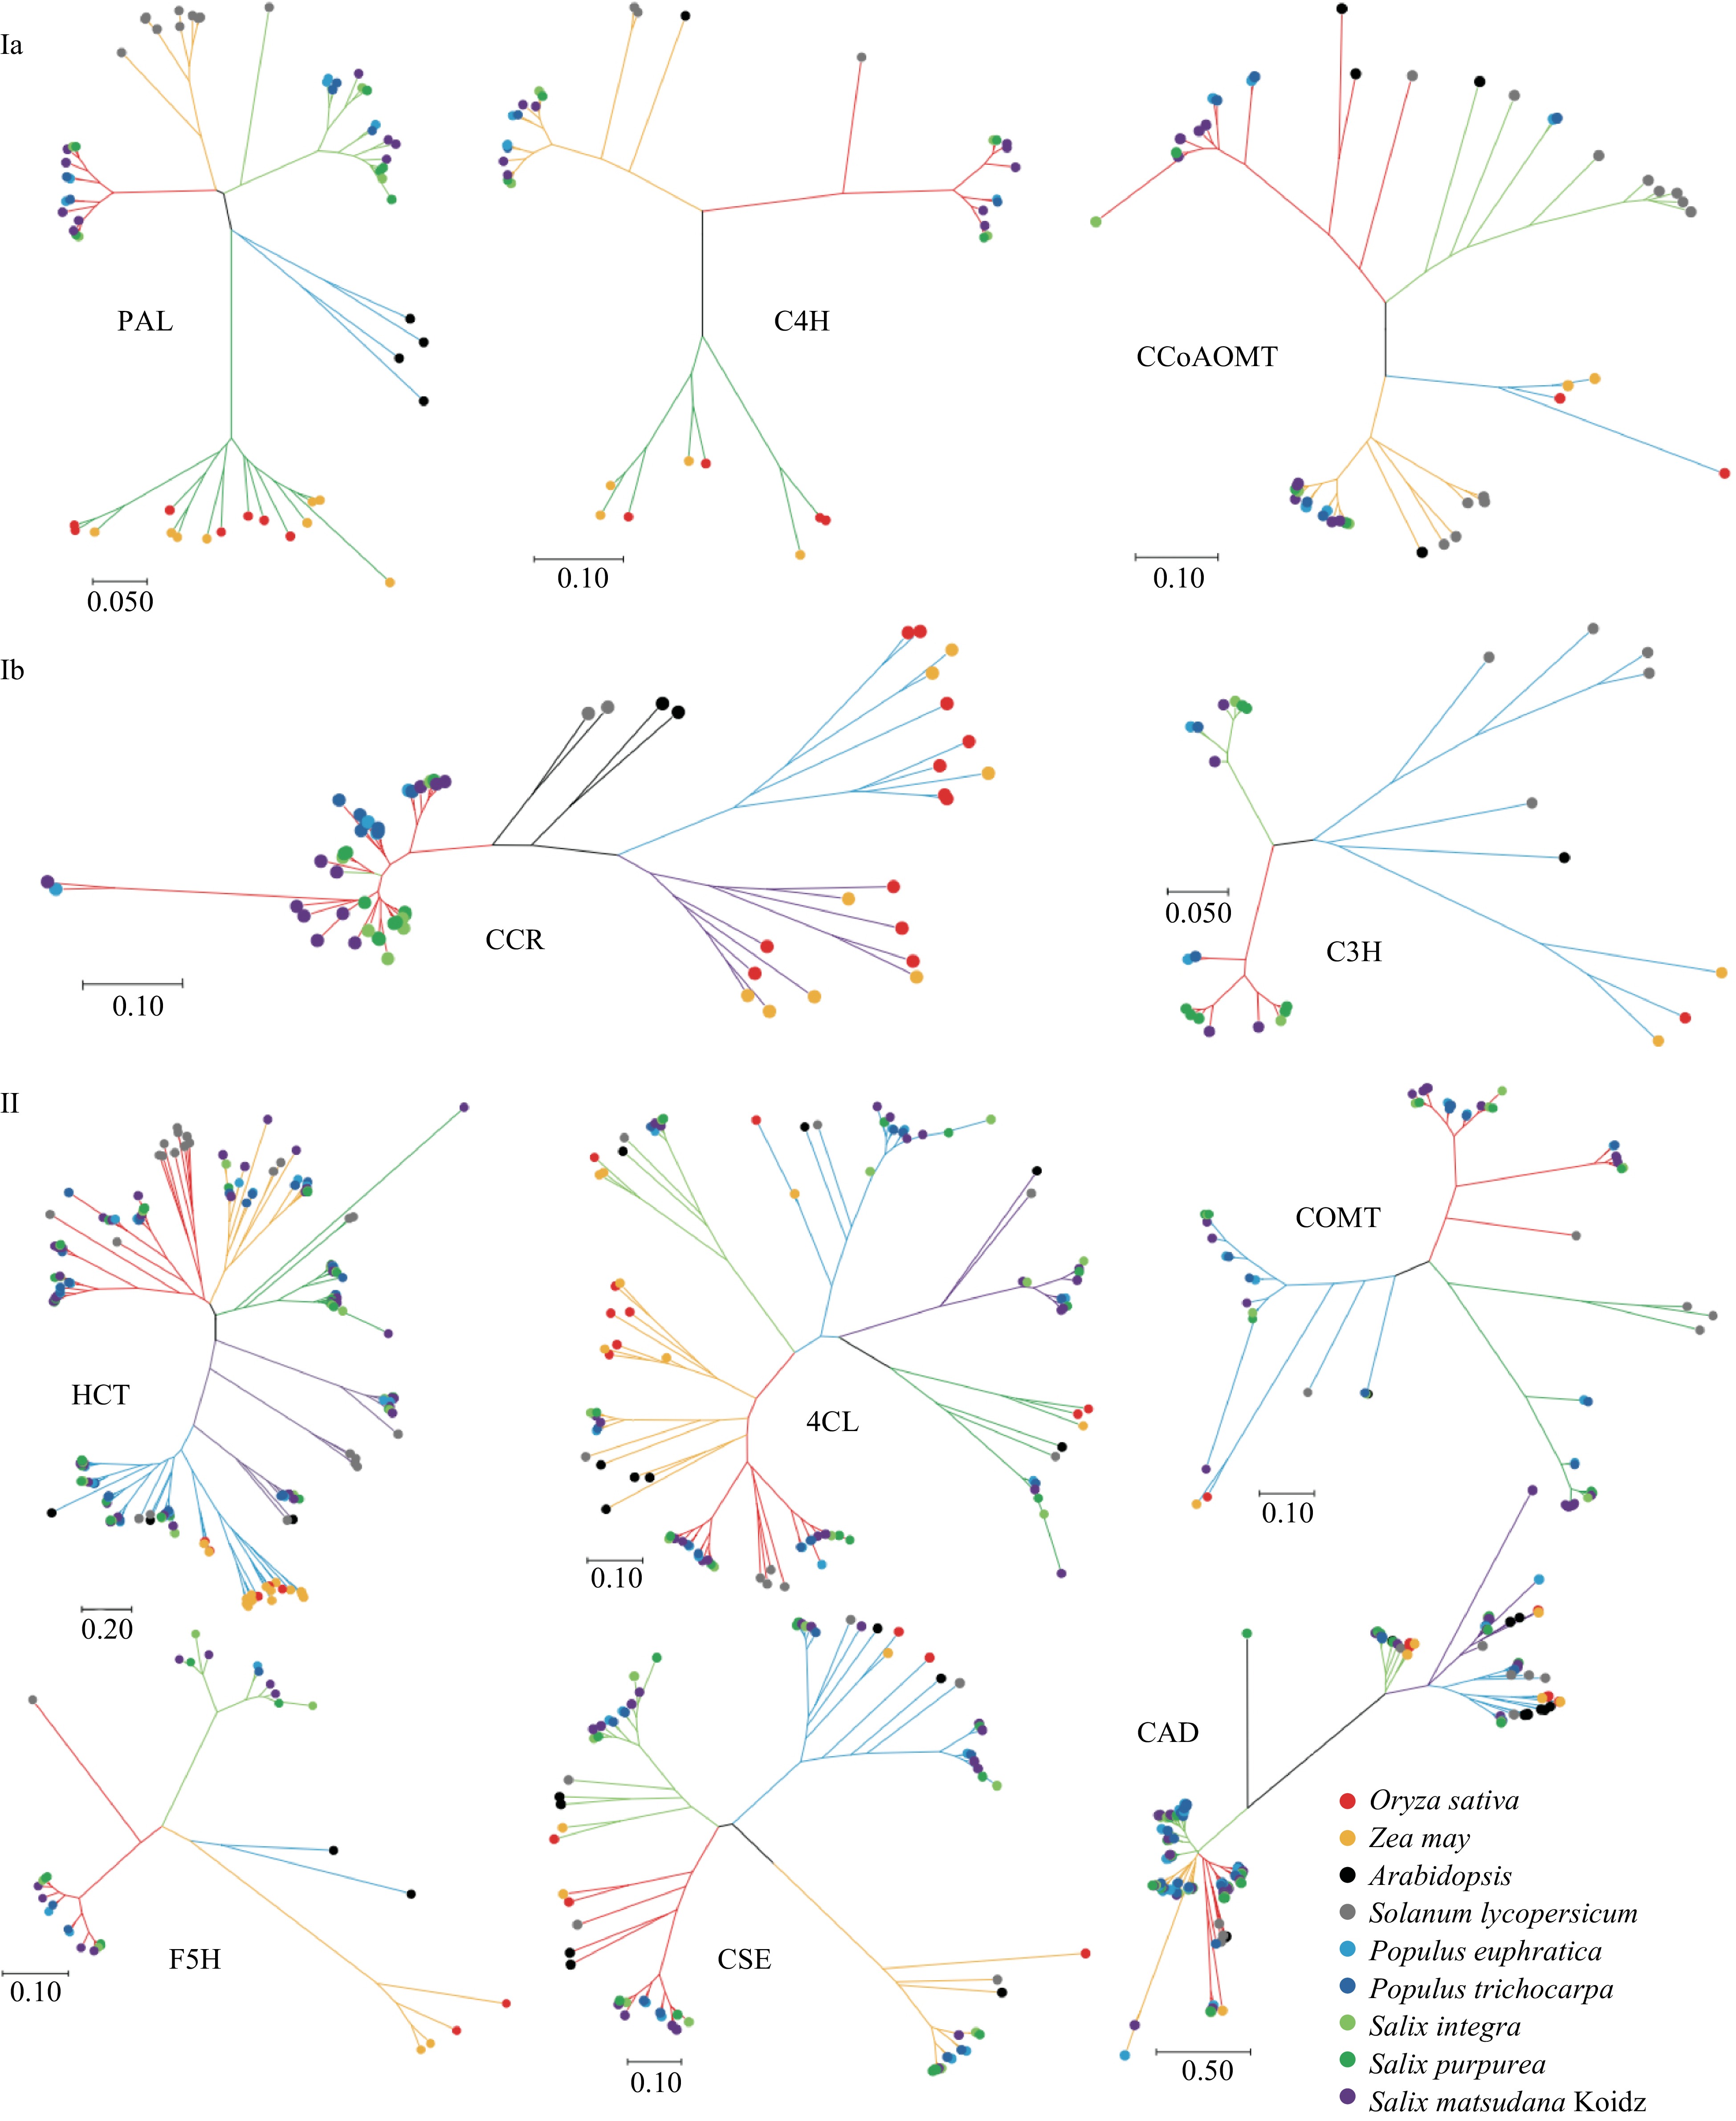
Figure 2. Phylogenetic trees of lignin biosynthesis genes from A. thaliana, O. sativa, Z. mays, S. lycopersicum, S. suchowensis, S. purpurea, P. euphratica, P. trichocarpa, and S. matsudana. The trees were constructed using MEGA X with the neighbor-joining method and 1000 bootstrap replicates. Different colored lines indicate different groups of gene families.
-
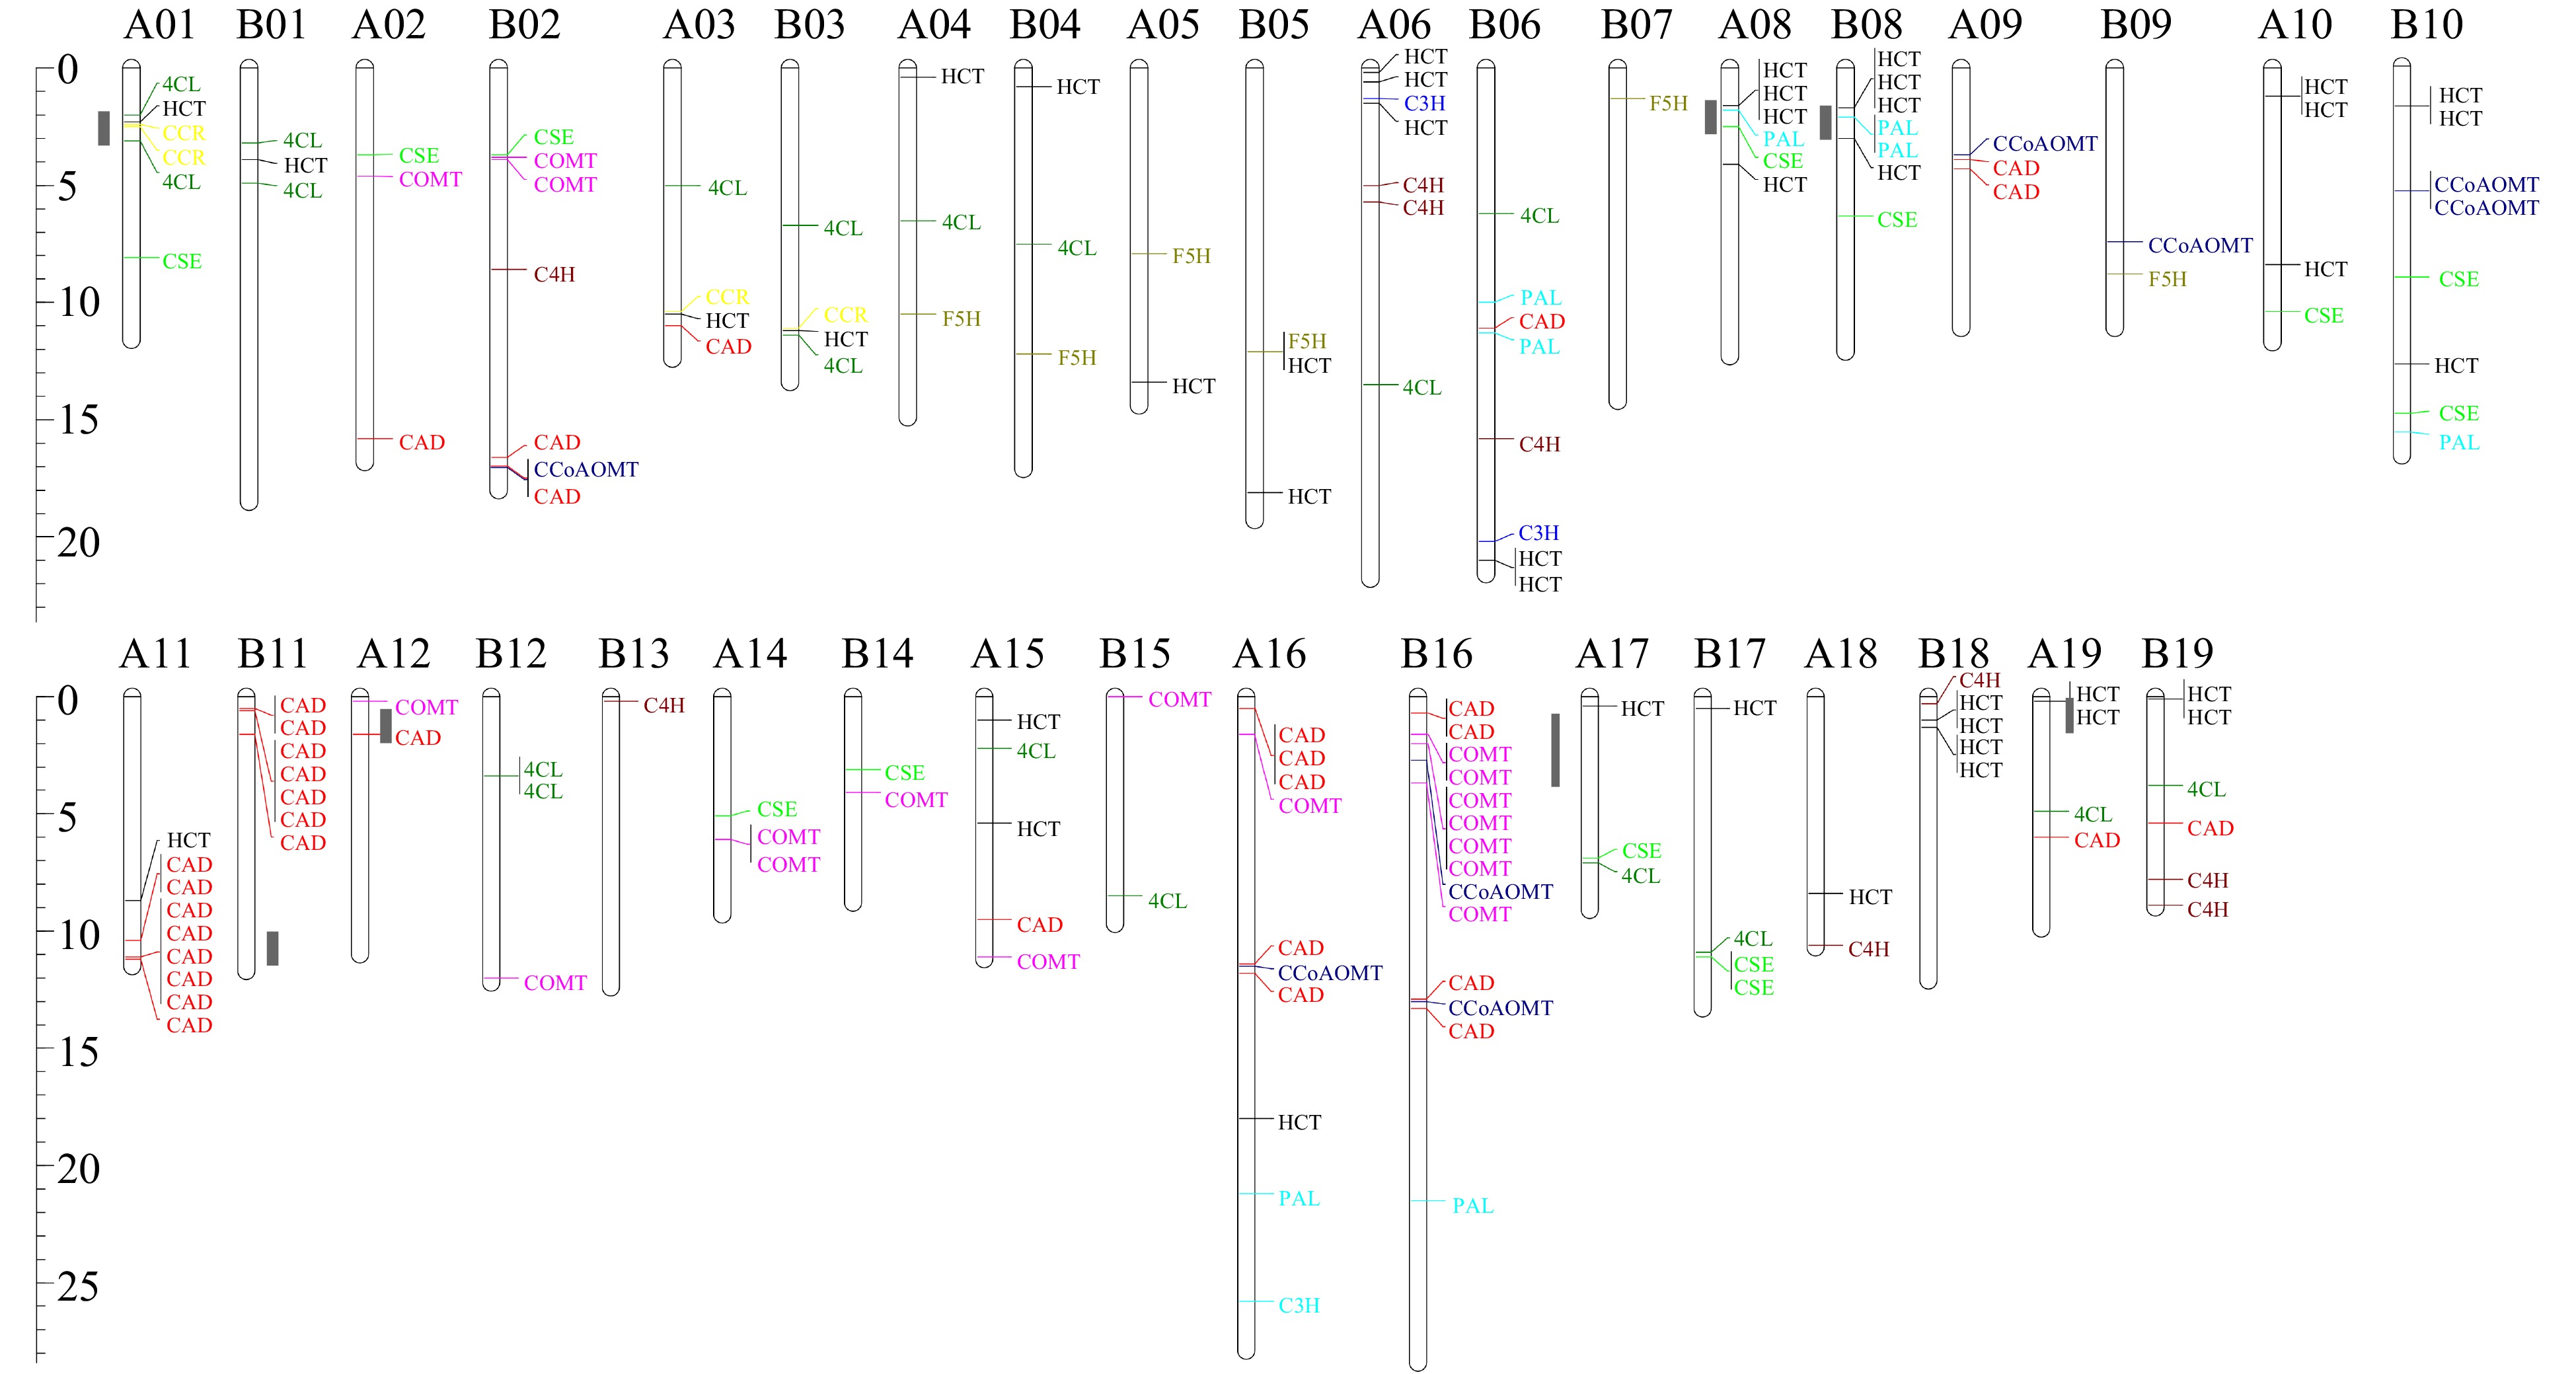
Figure 3. Distribution of lignin biosynthesis genes on S. matsudana chromosomes. The scale indicates megabases (Mb). Different gene families are indicated by different colors, and hotspots for lignin biosynthesis genes are marked in gray on the left of the chromosomes.
-
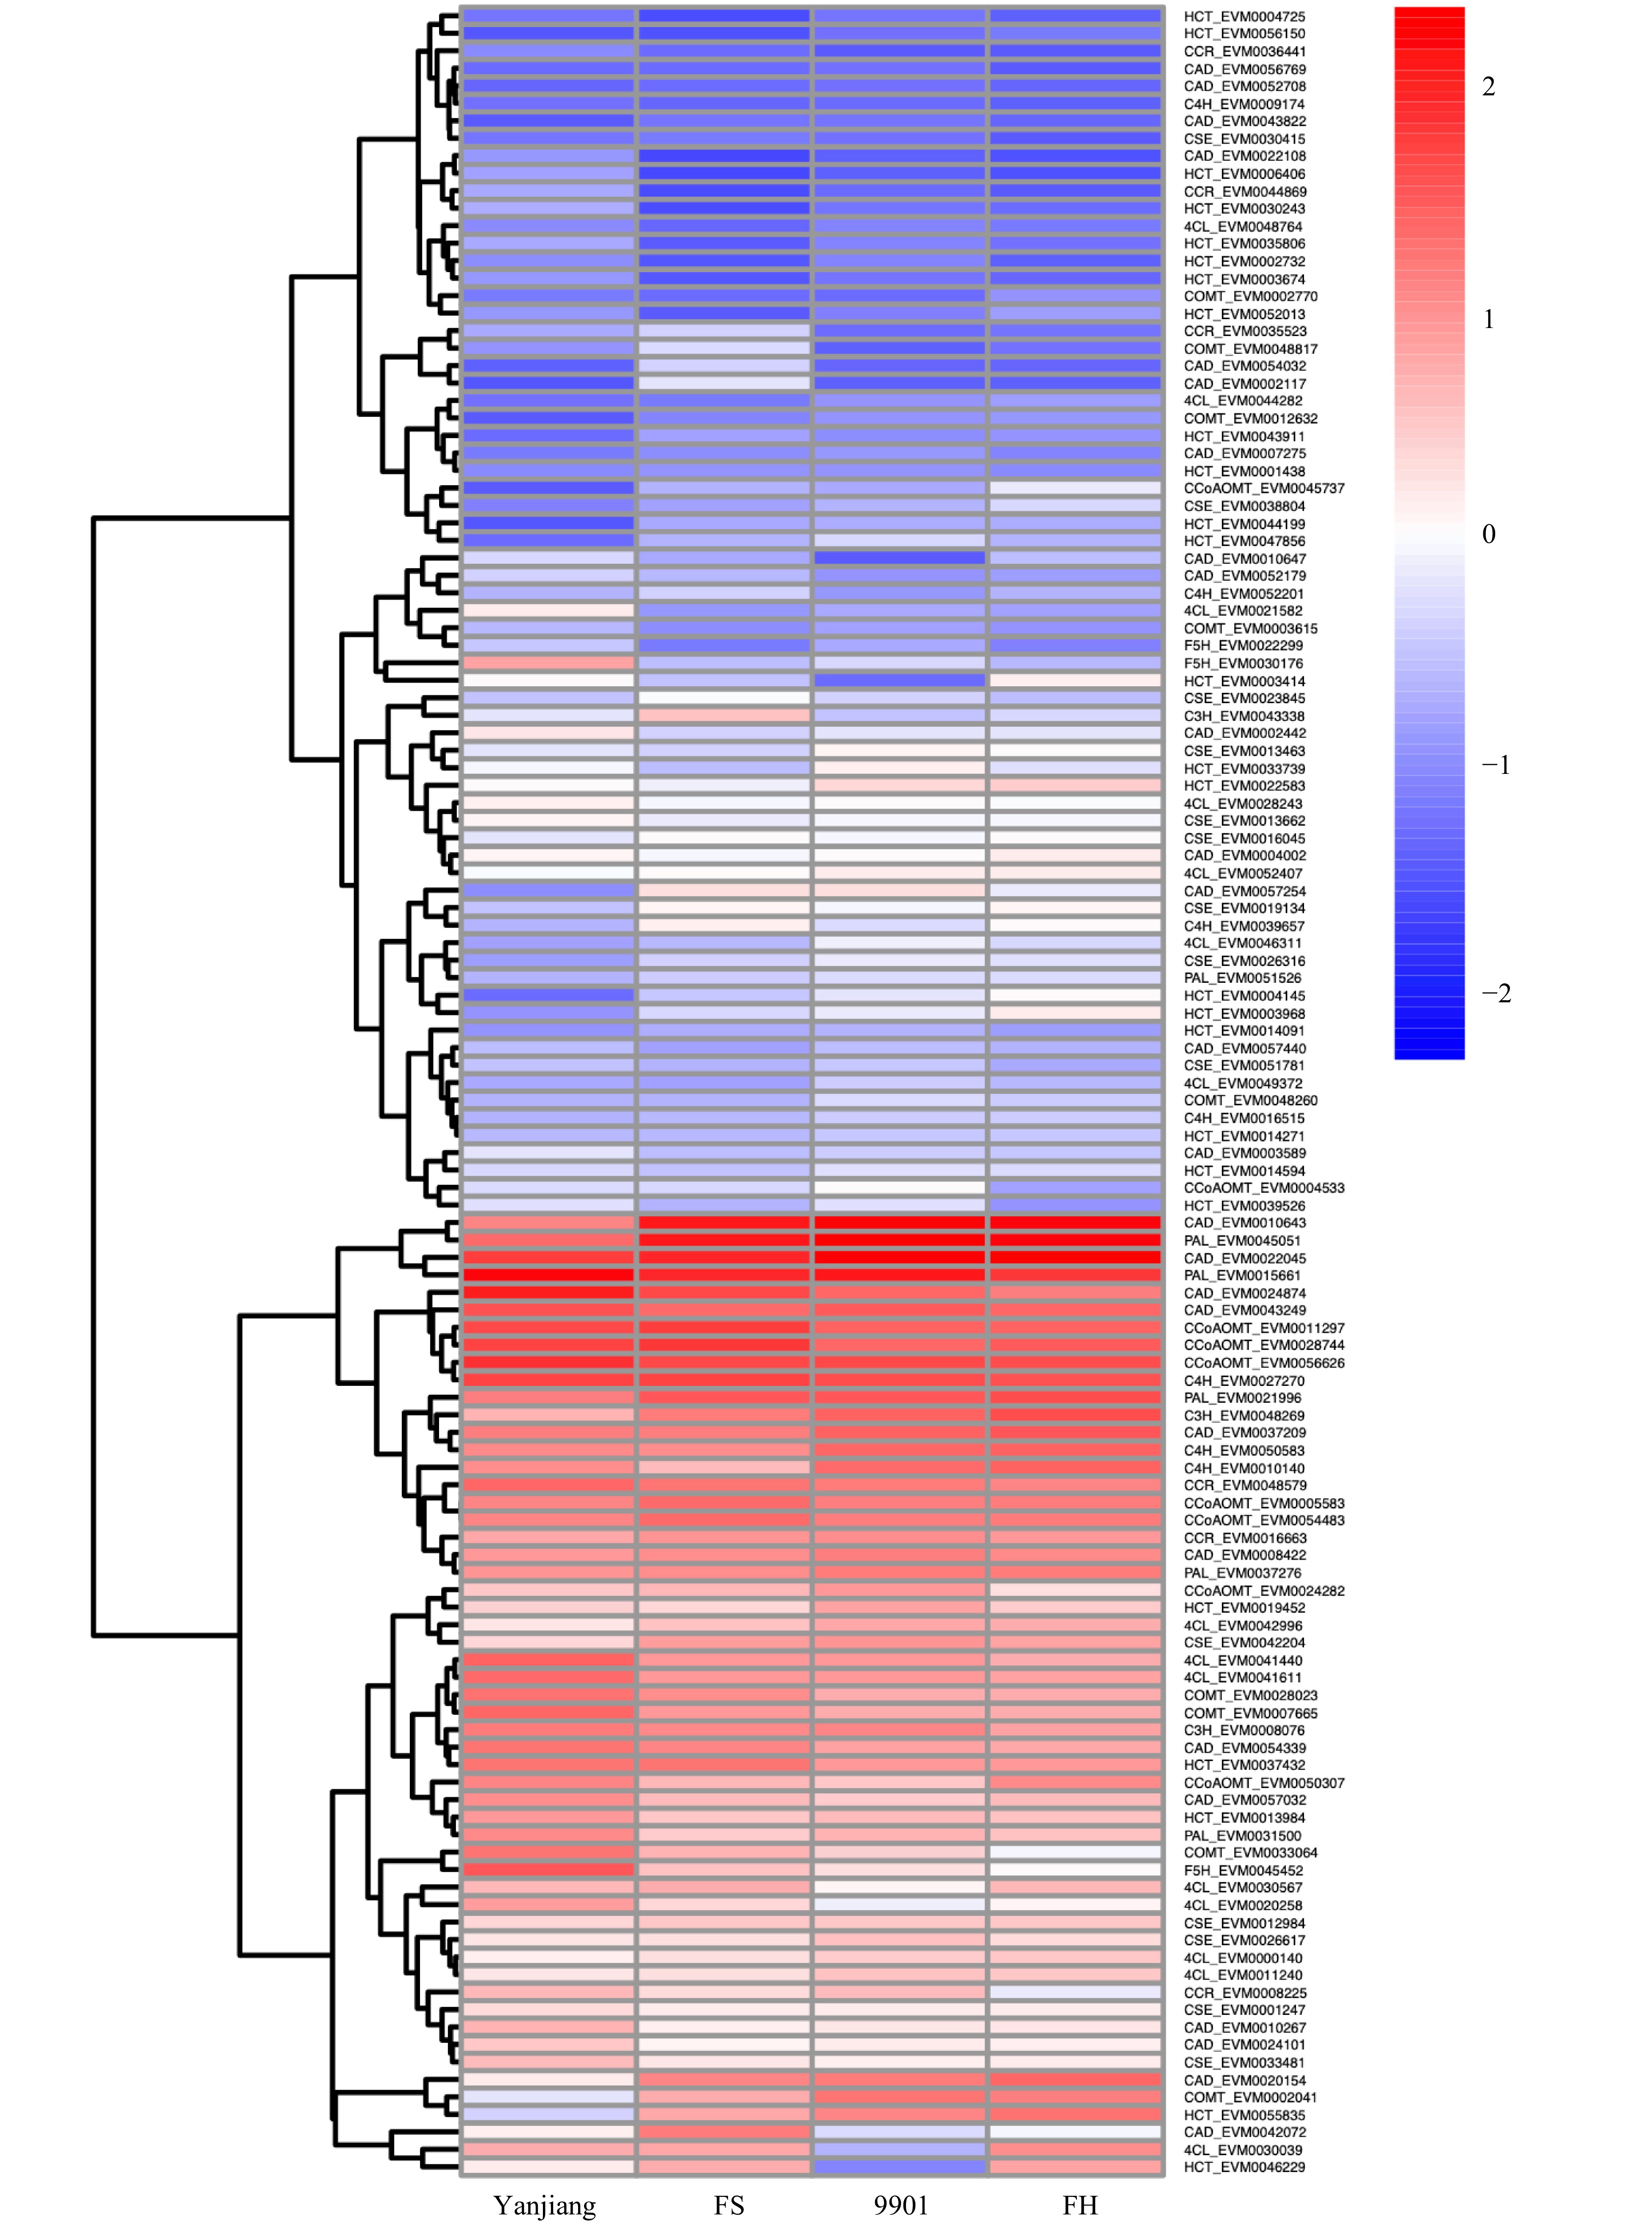
Figure 4. Expression profiles of 11 lignin biosynthesis gene family members in the two parents and two progenies. Red indicates a higher expression level, and blue indicates a lower expression level. Expression data are presented as FPKM values calculated in R.
-
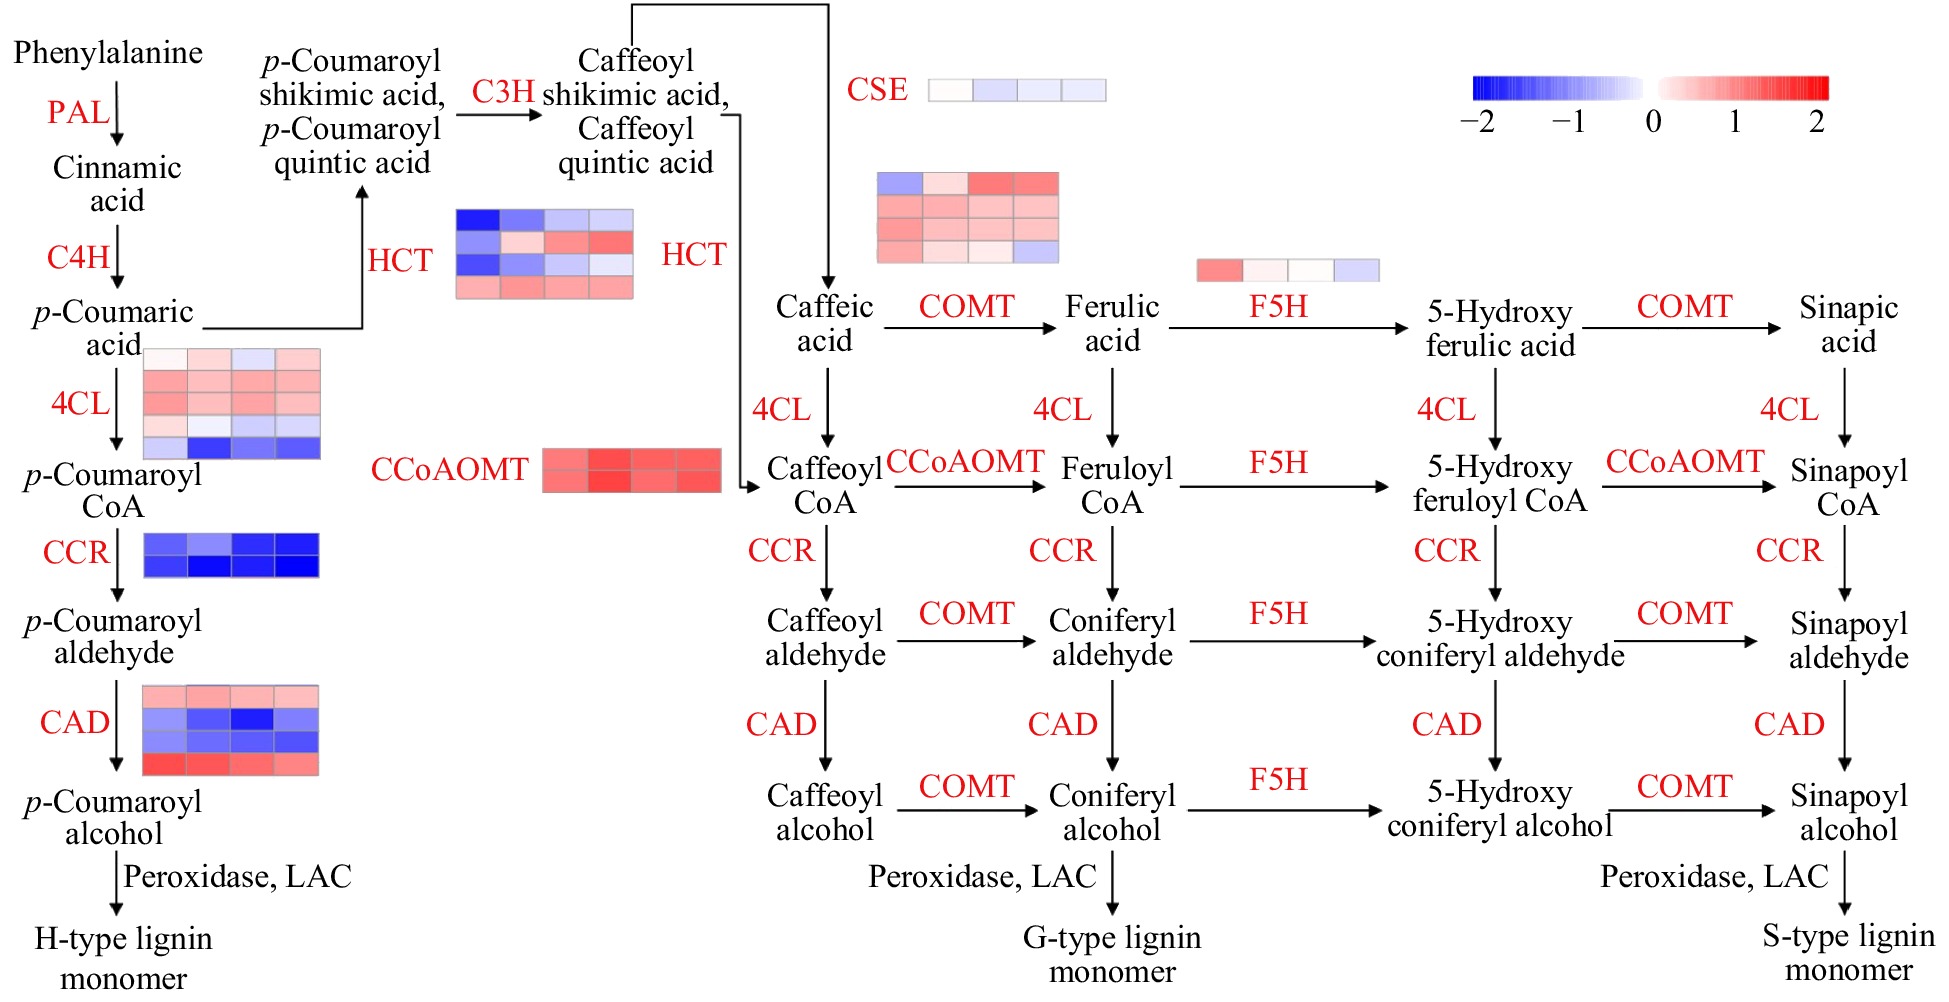
Figure 5. Gene expression network for monolignol biosynthesis in the stem terminals of S. matsudana. Transcript abundance (log2[FPKM+1]) in ‘Yanjiang’, ‘FS’, ‘9901’, and ‘FH’ is indicated by a color gradient.
-
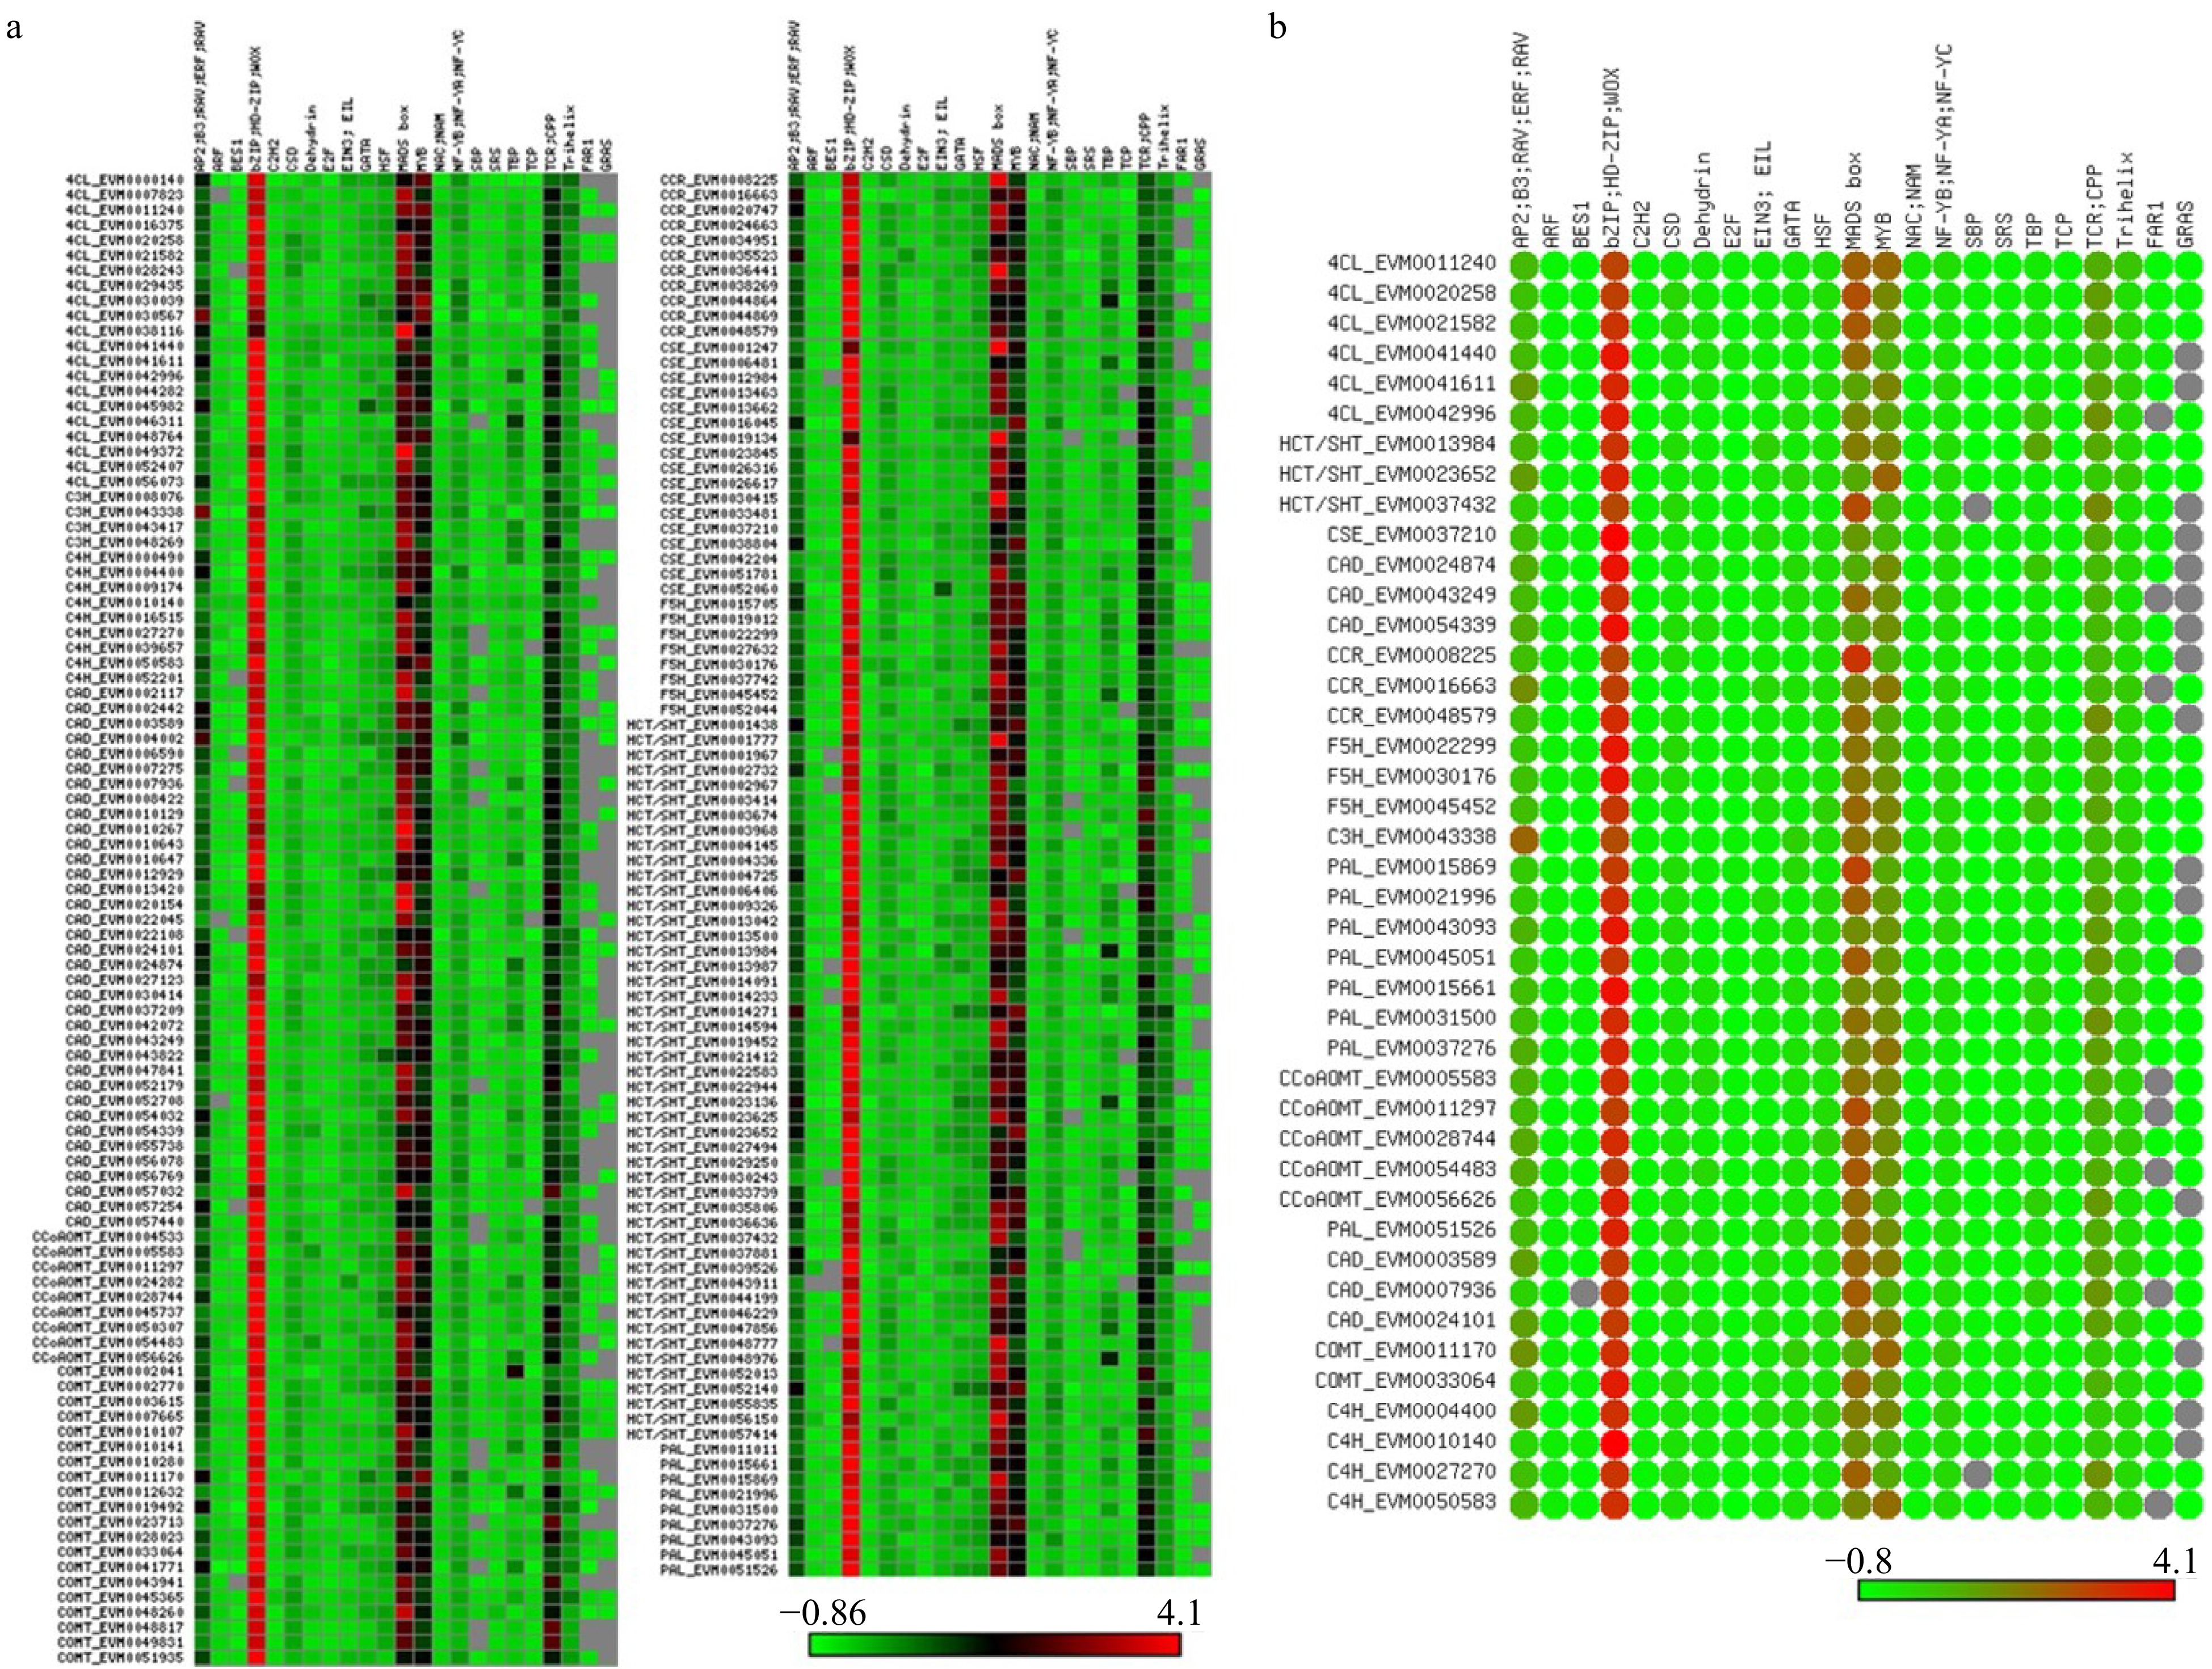
Figure 6. Motif analysis of promoter regions of the lignin biosynthesis genes. (a) Motif analysis of promoter regions from all S. matsudana lignin biosynthesis genes. (b) Motif analysis of promoter regions from differentiating xylem–specific lignin biosynthesis genes.
-
Species PAL C4H 4CL HCT C3H CSE COMT F5H CCoAOMT CCR CAD Zea mays 9 4 7 16 2 3 1 2 2 8 6 Oryza sativa 8 4 9 5 1 5 1 2 2 12 6 Arabidopsis thaliana 4 1 8 3 1 7 1 2 4 2 11 Solanum lycopersicum 10 3 9 23 5 5 5 1 13 2 9 Salix suchowensis 4 4 10 19 2 8 8 4 3 6 23 Salix purpurea 6 4 11 29 7 12 8 6 3 10 26 Populus euphratica 5 4 10 22 2 7 8 3 5 4 28 Populus trichocarpa 5 3 11 28 2 8 10 3 5 7 33 Salix matsudana 9 9 21 48 4 17 20 8 9 11 36 Salix matsudana At 2 3 8 22 2 6 6 2 2 3 20 Salix matsudana Bt 6 6 11 21 1 7 12 4 6 1 15 Table 1. Numbers of genes in 11 lignin biosynthesis gene families from nine plant species.
-
Height (cm) Lignin content (mg/g) Yanjiang 120.19 ± 7.67 1011.11 ± 205.52 FS 71.93 ± 5.13 633.33 ± 50.41 9901 153.69 ± 2.47 341.11 ± 15.48 FH 187.84 ± 3.24 255.56 ± 38.90 Table 2. Tree height and lignin content of ‘Yanjiang’, ‘FS’, ‘9901’, and ‘FH’.
Figures
(6)
Tables
(2)