-
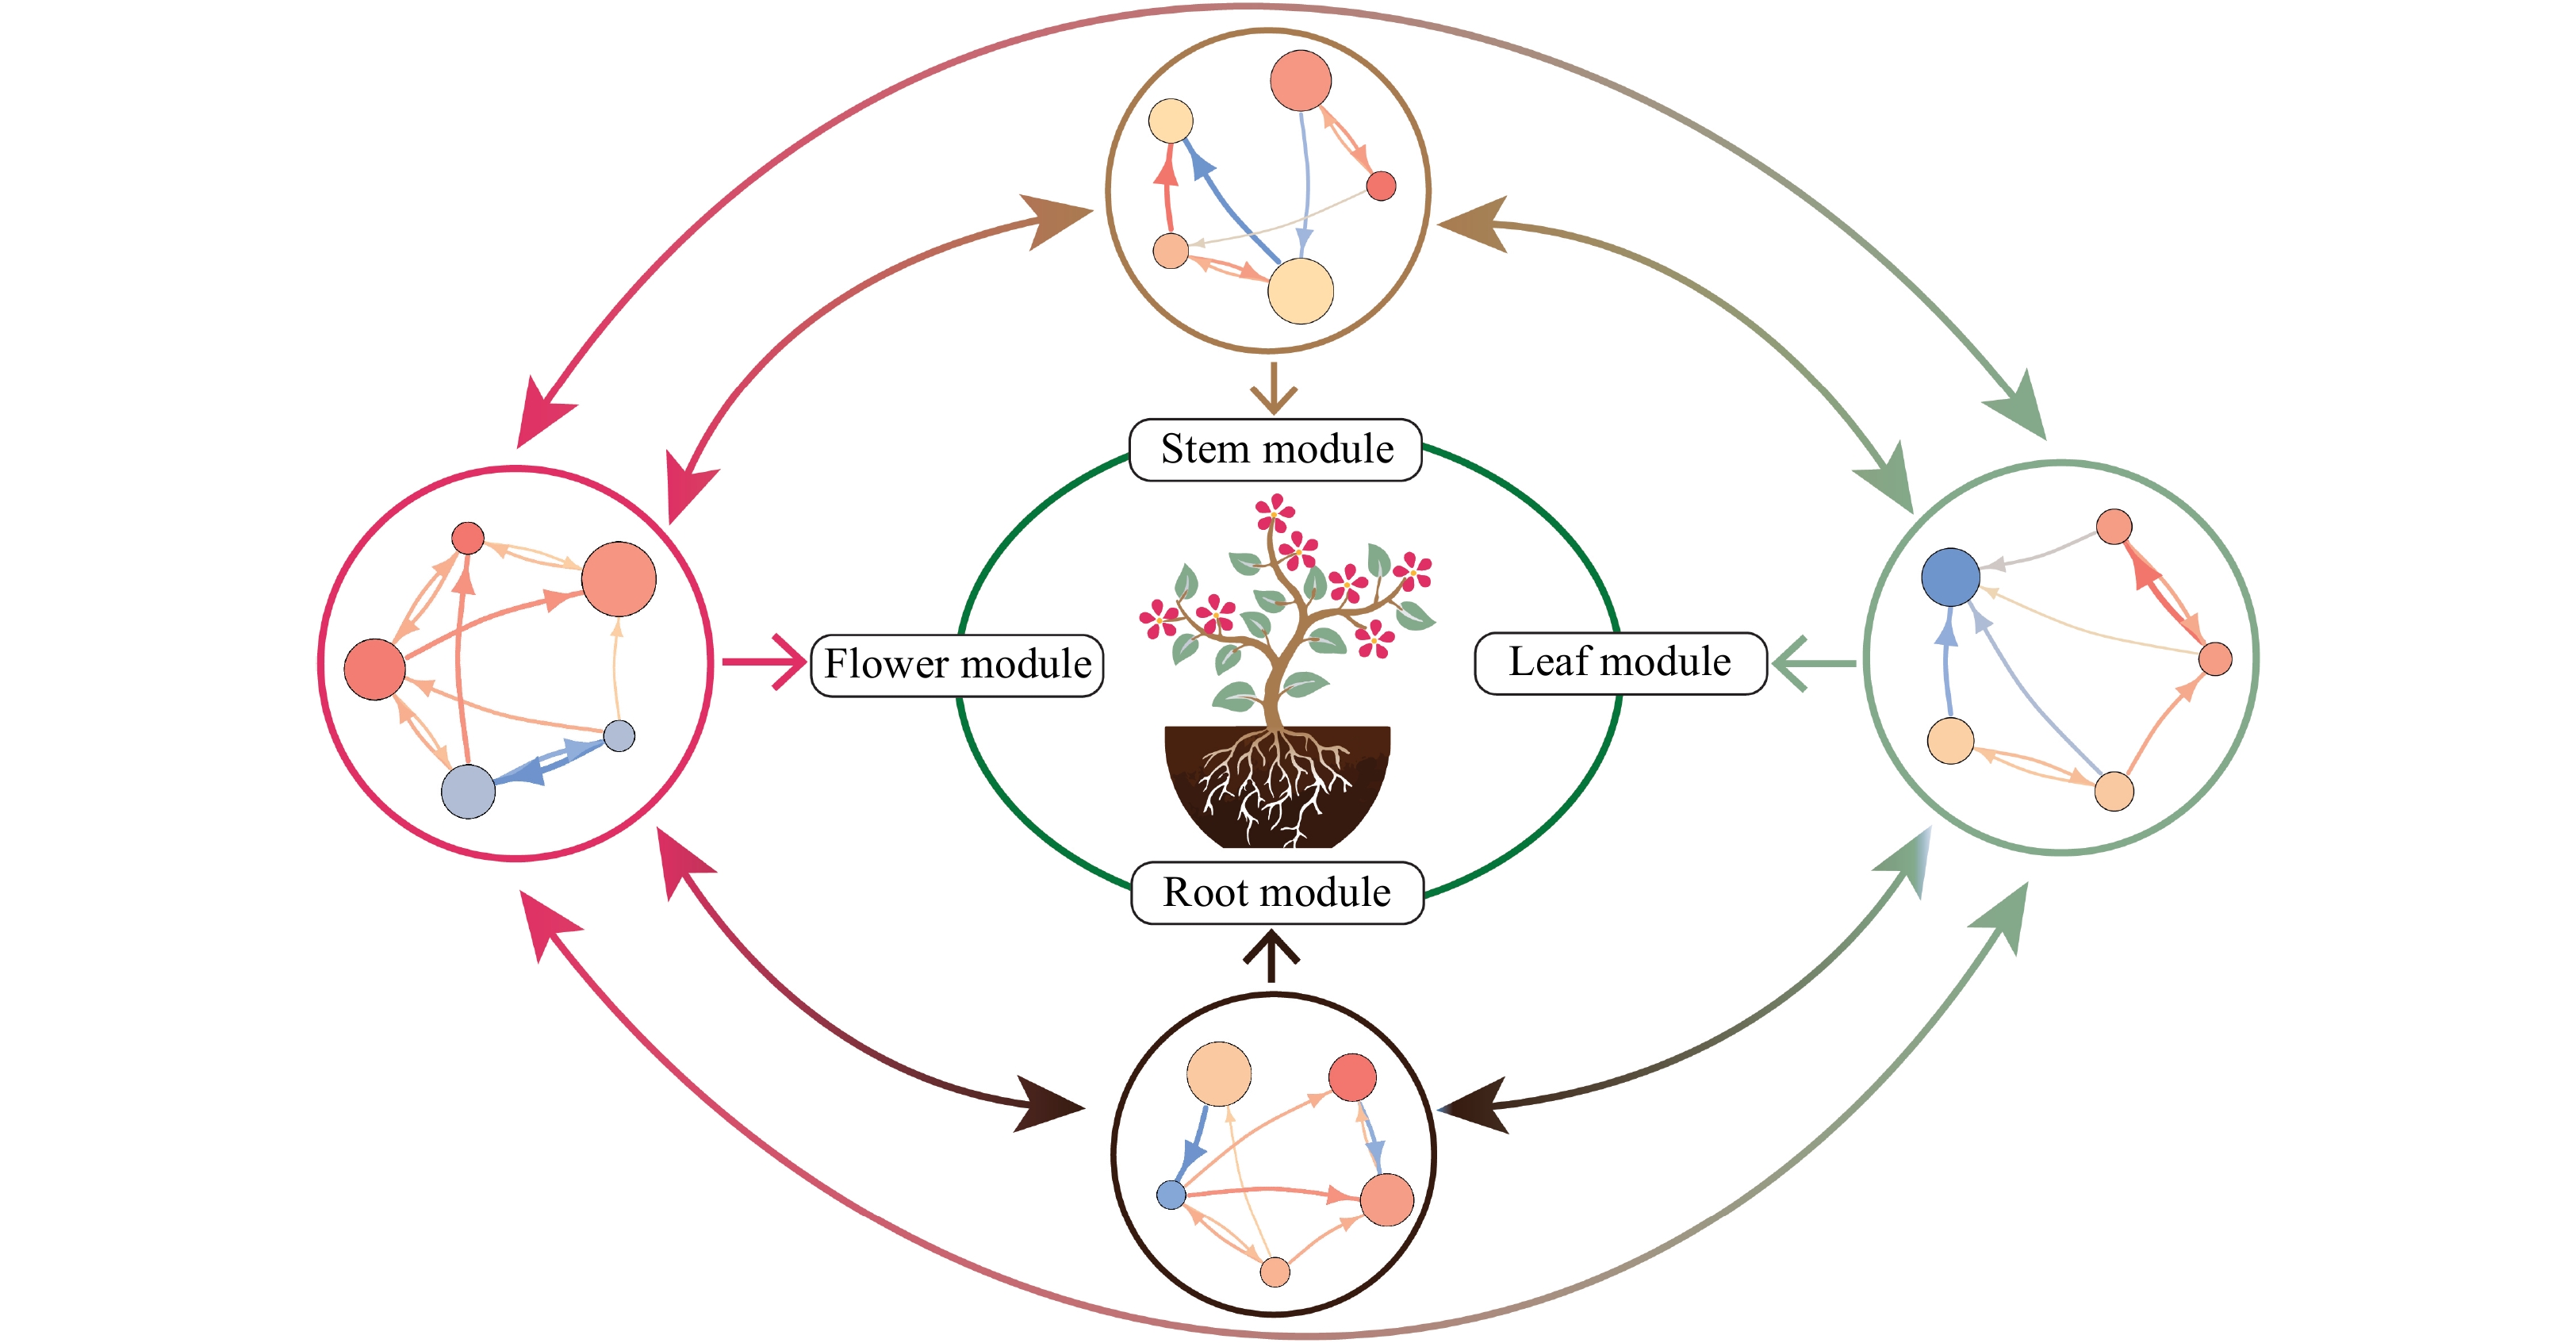
Figure 1. Schematic diagram of a growing ornamental plant. By viewing the whole plant as an ecological system, we dissect it into multi-level hierarchical communities or modules according to its morphological features, i.e., stem, root, leaf, and flower. Each module is composed of highly correlated traits that are relatively weakly related with those from other modules. Genetic networks that specifically affect a module are linked to form a multiscale, multilayer and multiplex network shaping the growth, reproduction, and evolution of the plant. Circles in the outer represent genetic networks for a module, in which nodes and edge stand for genes and directed gene-gene interactions, respectively. Red and blue arrowed lines represent upregulation and downregulation, respectively, with line thickness proportional to the strength of regulation.
-
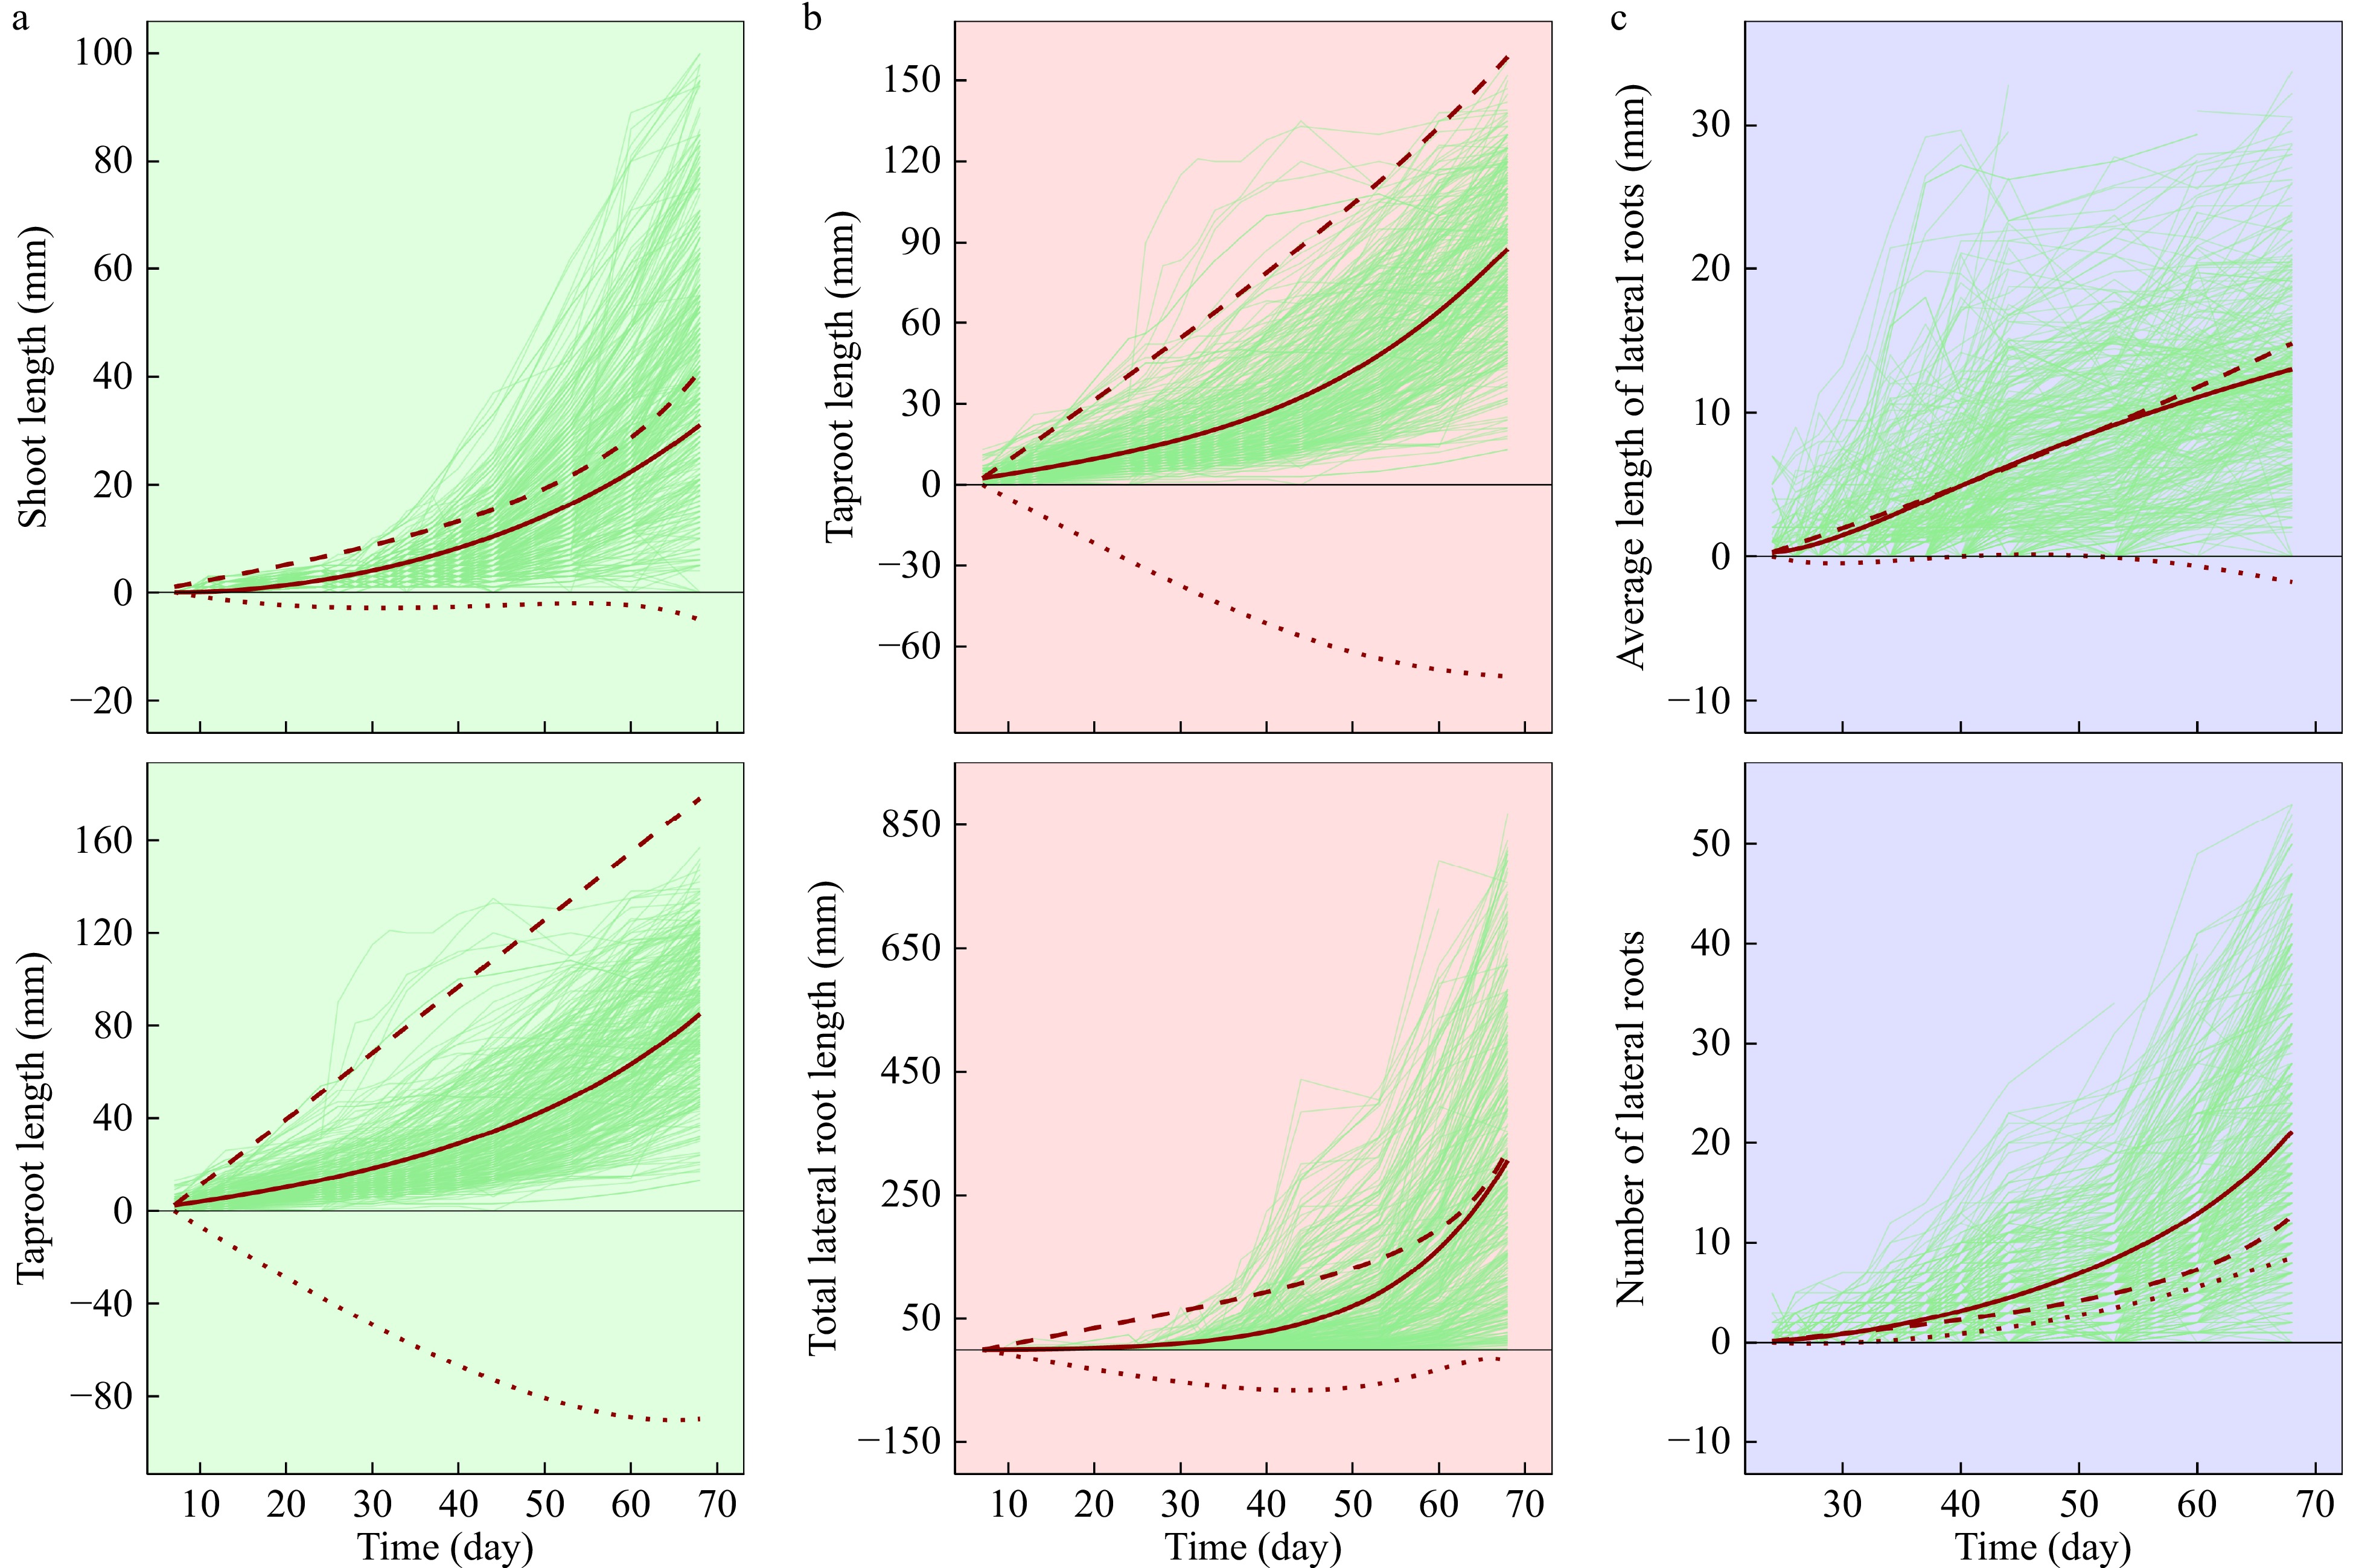
Figure 2. Trajectories of interacting growth traits within each of three hierarchical modules, the main axe module (a), the root module (b) and the lateral root module (c). Thick red lines are the overall mean growth curves of a trait, fitted by ODEs (2) to raw dynamic data (thin light green lines), within a module, hashed lines (---) are the independent growth curve of a trait as expected in isolation, and dotted lines (...) are the dependent growth curves of a trait upon its interacting trait. Data from a published study[46].
-
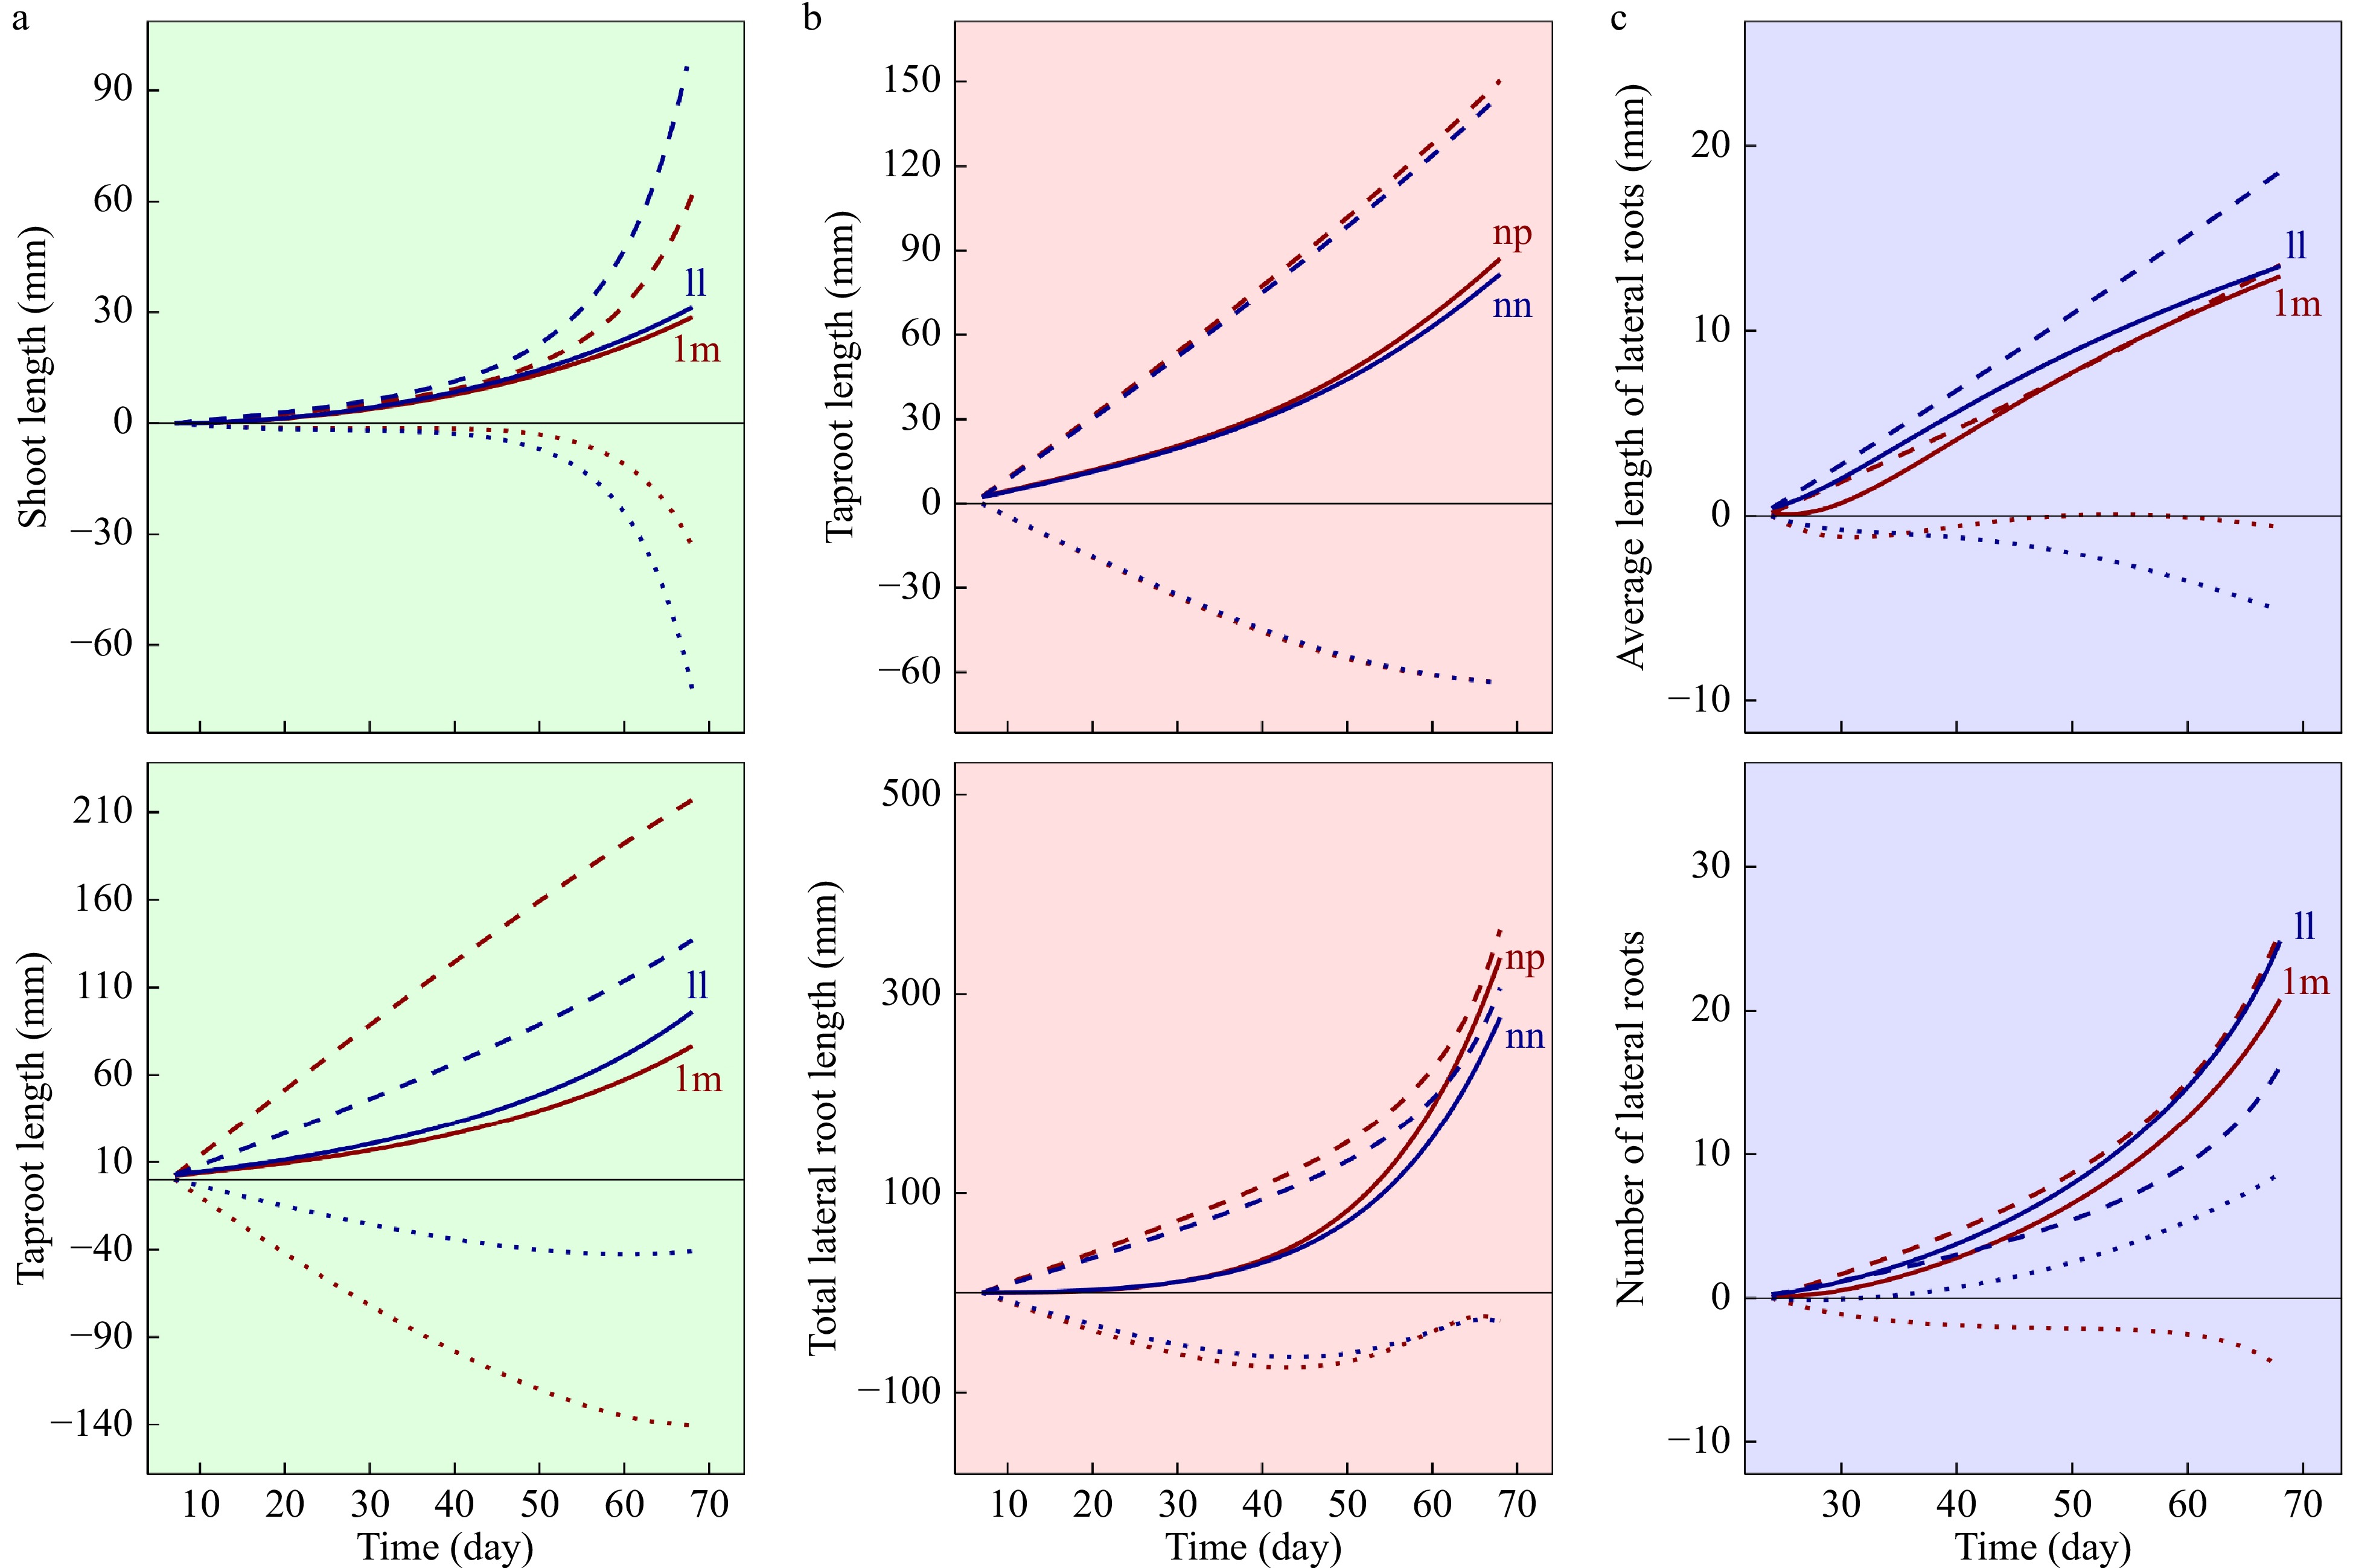
Figure 3. Genetic control of a QTL detected on the dynamic change of interacting traits within a module, the main axe module (a), the root module (b) and the lateral root module (c). Thick lines are the overall mean growth curves of a trait, hashed lines (---) are the independent growth curve of a trait as expected in isolation, and dotted lines (...) are the dependent growth curves of a trait upon its interacting trait. Red and blue represent two different genotypes at each QTL.
-
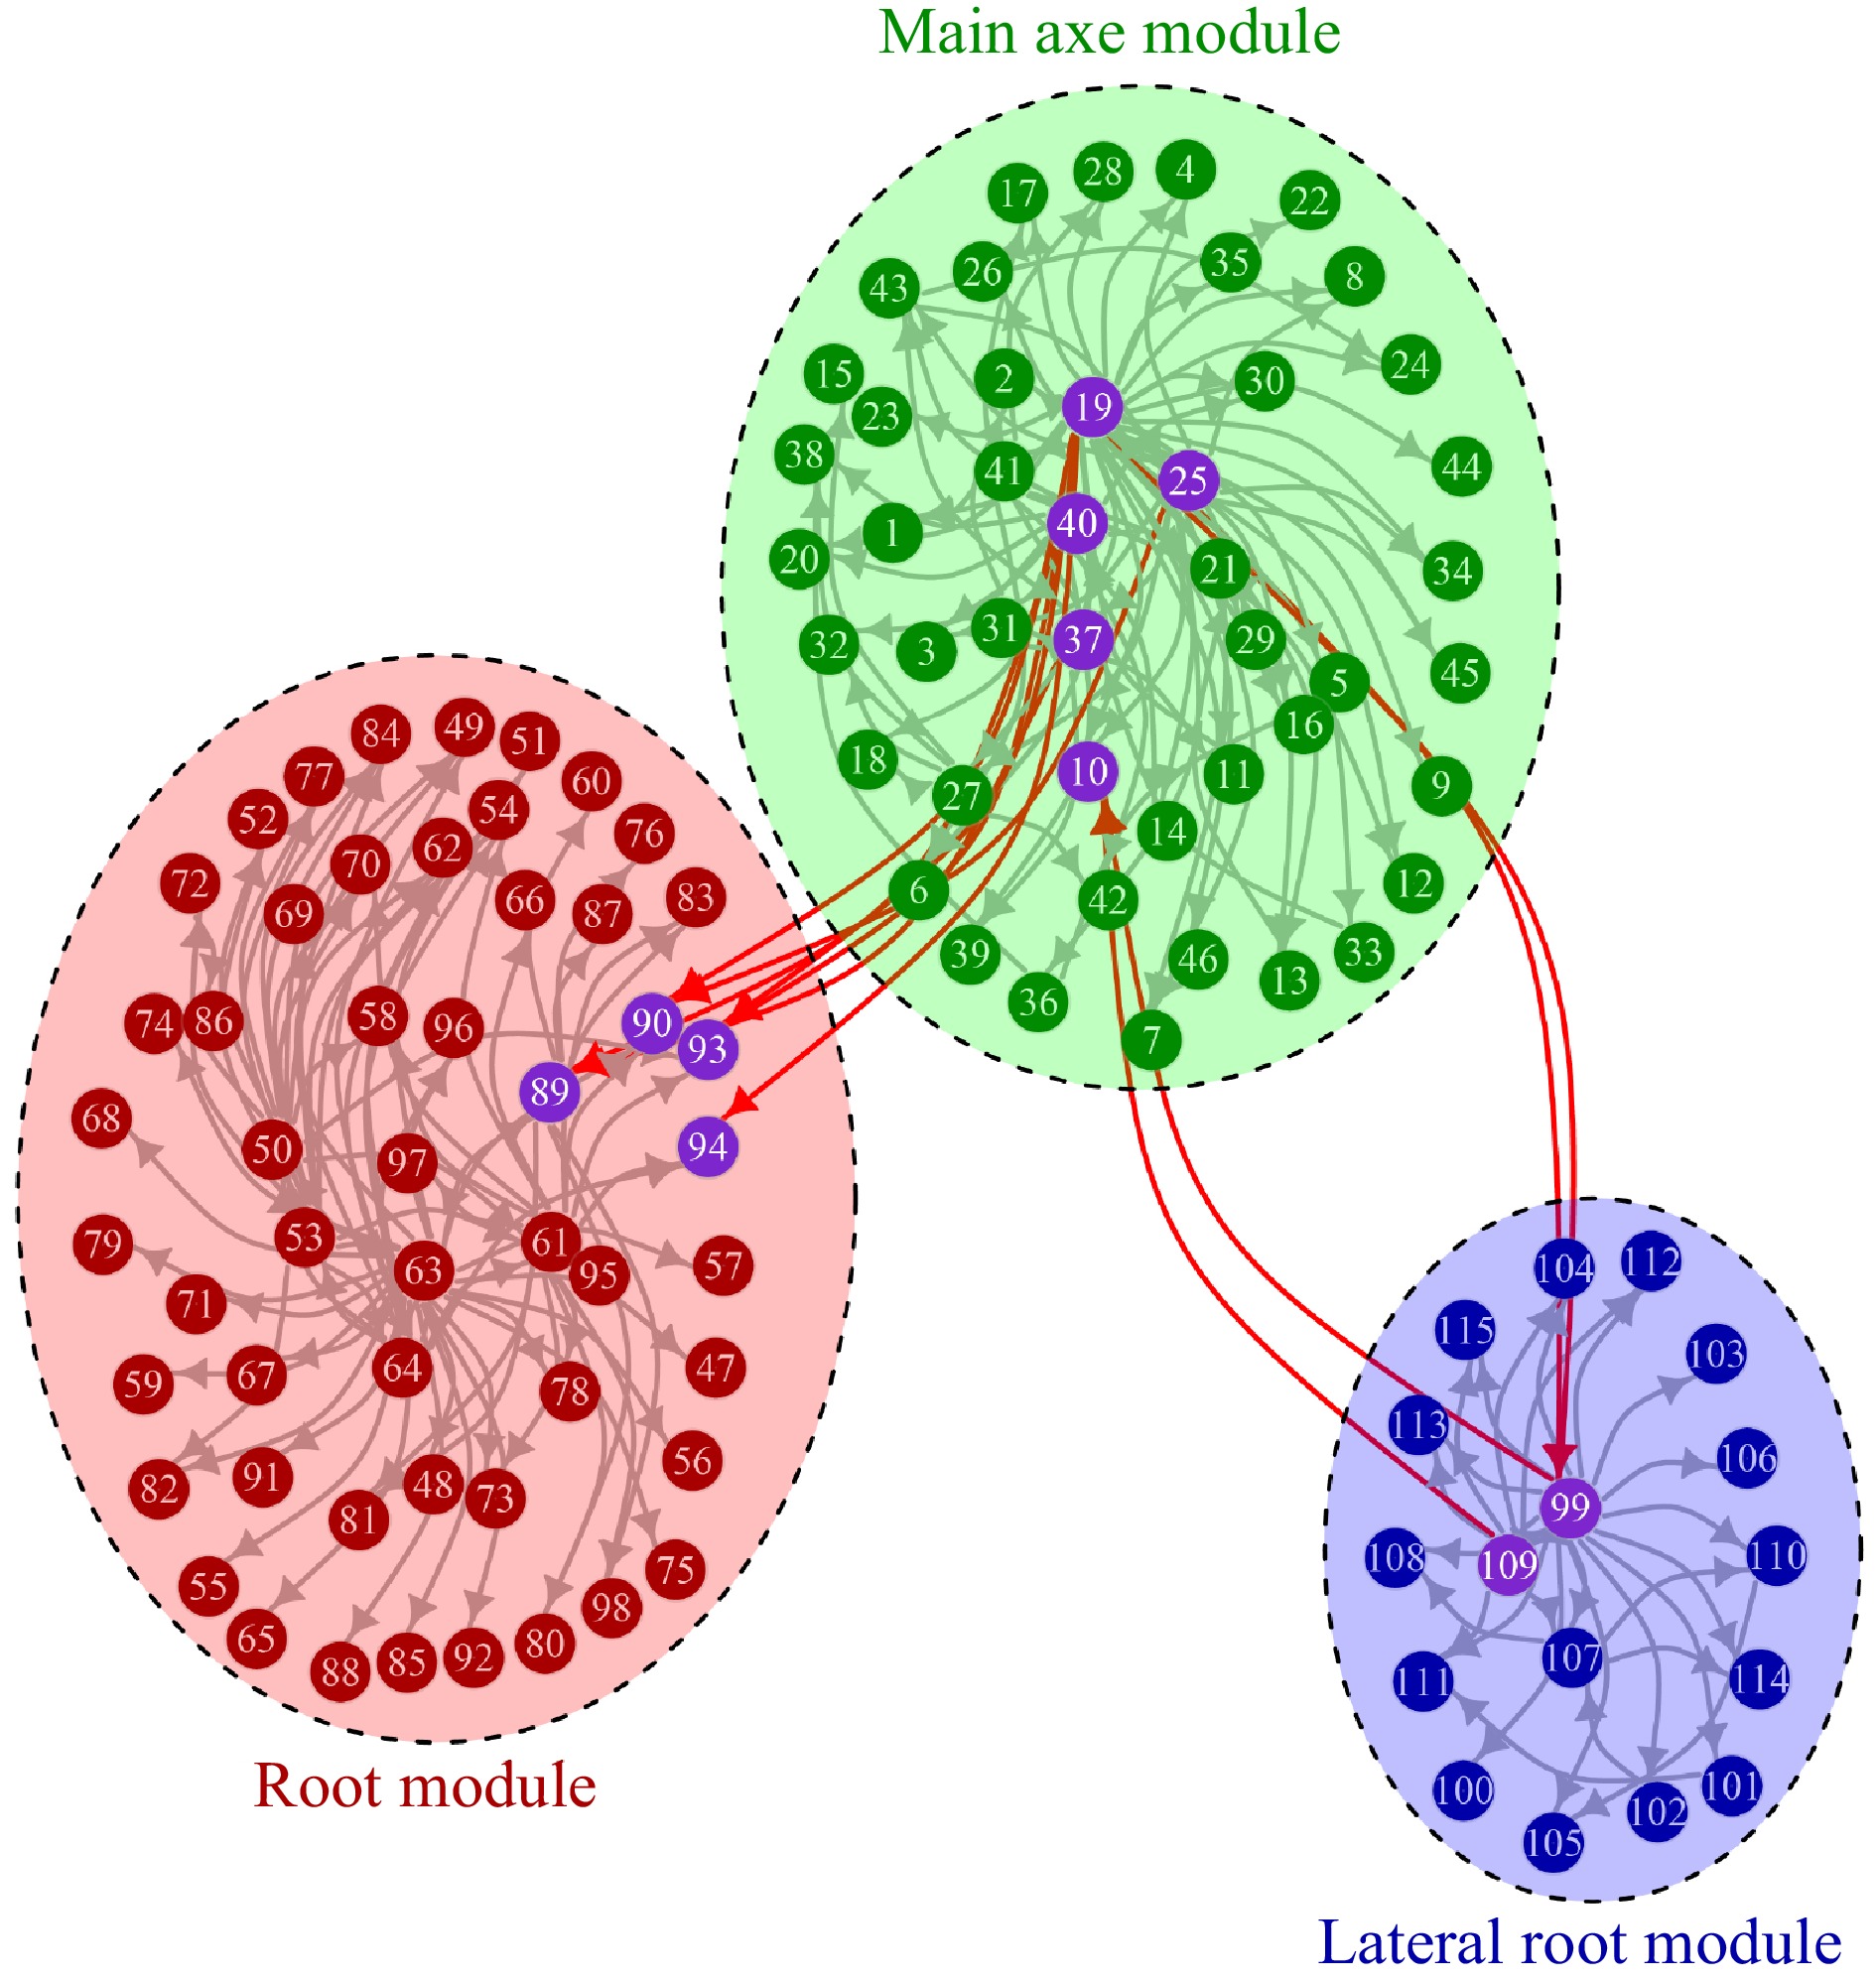
Figure 4. The genetic network of QTLs detected to control three hierarchical modules, each represented by an elliptic circle. Each dot represents a QTL, and an arrow denotes the direction of activation from one QTL to others.
Figures
(4)
Tables
(0)