-
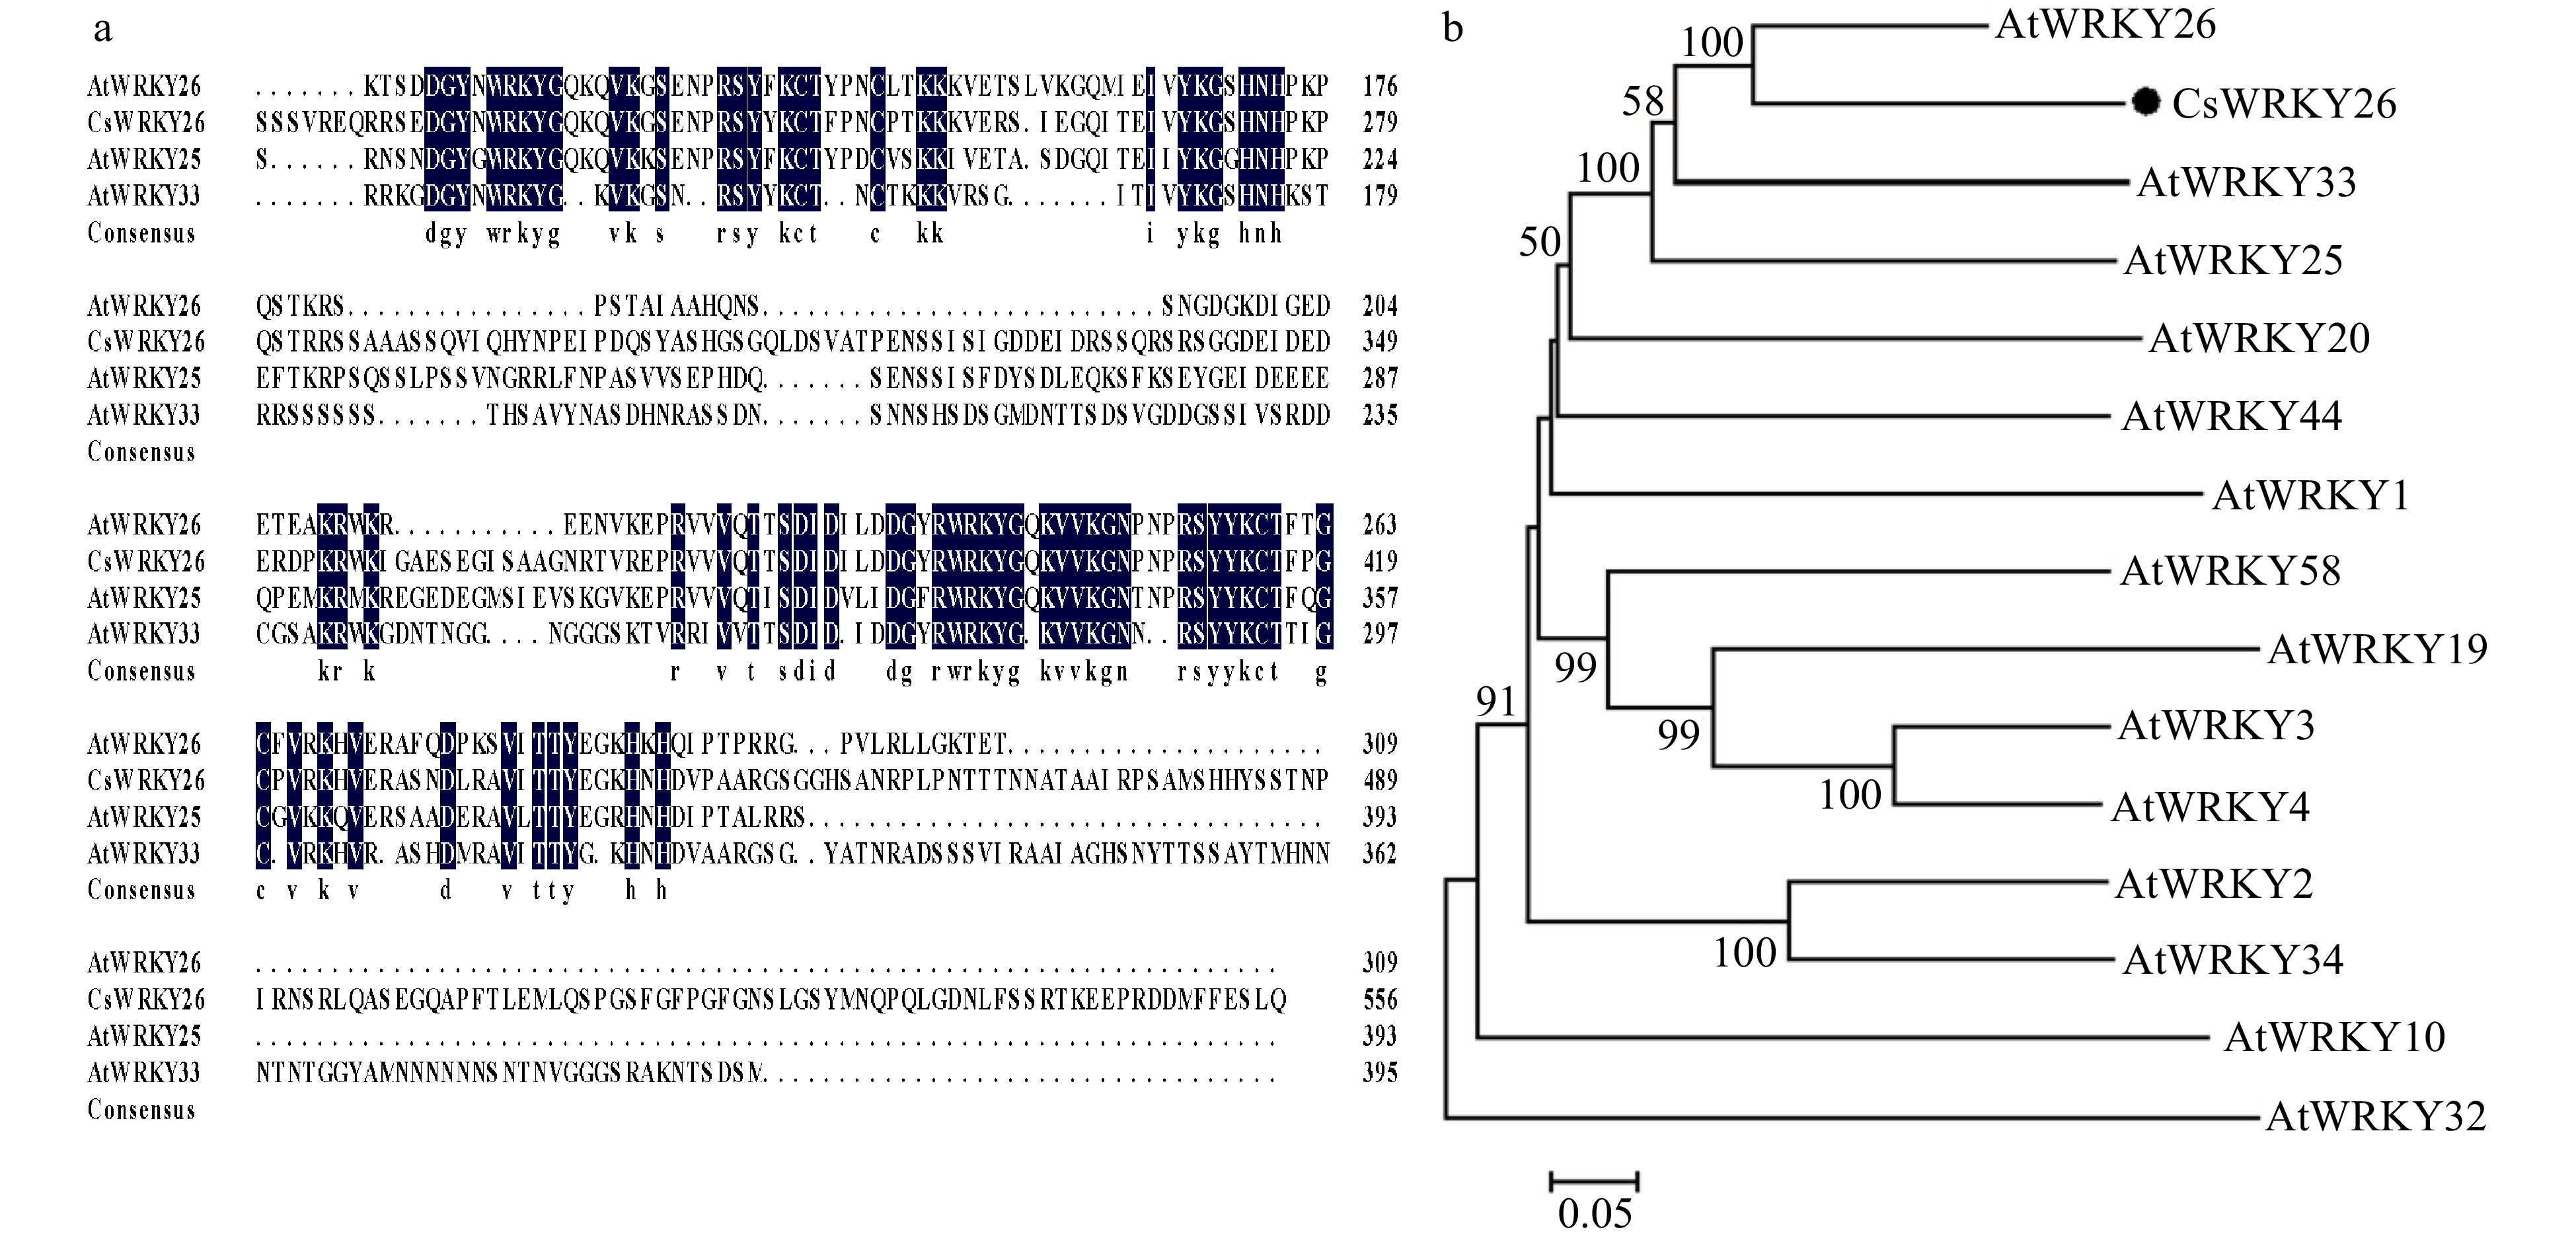
Figure 1. Sequence alignment and phylogenetic tree analysis of CsWRKY26. (a) Multiple sequence alignment of amino acid sequences of CsWRKY26 with homologous WRKYs from Arabidopsis. Sequences were aligned by the DNAMAN program. (b) Phylogenetic analysis of CsWRKY26 and Arabidopsis group I WRKY proteins, constructed using MEGA 6.0.
-
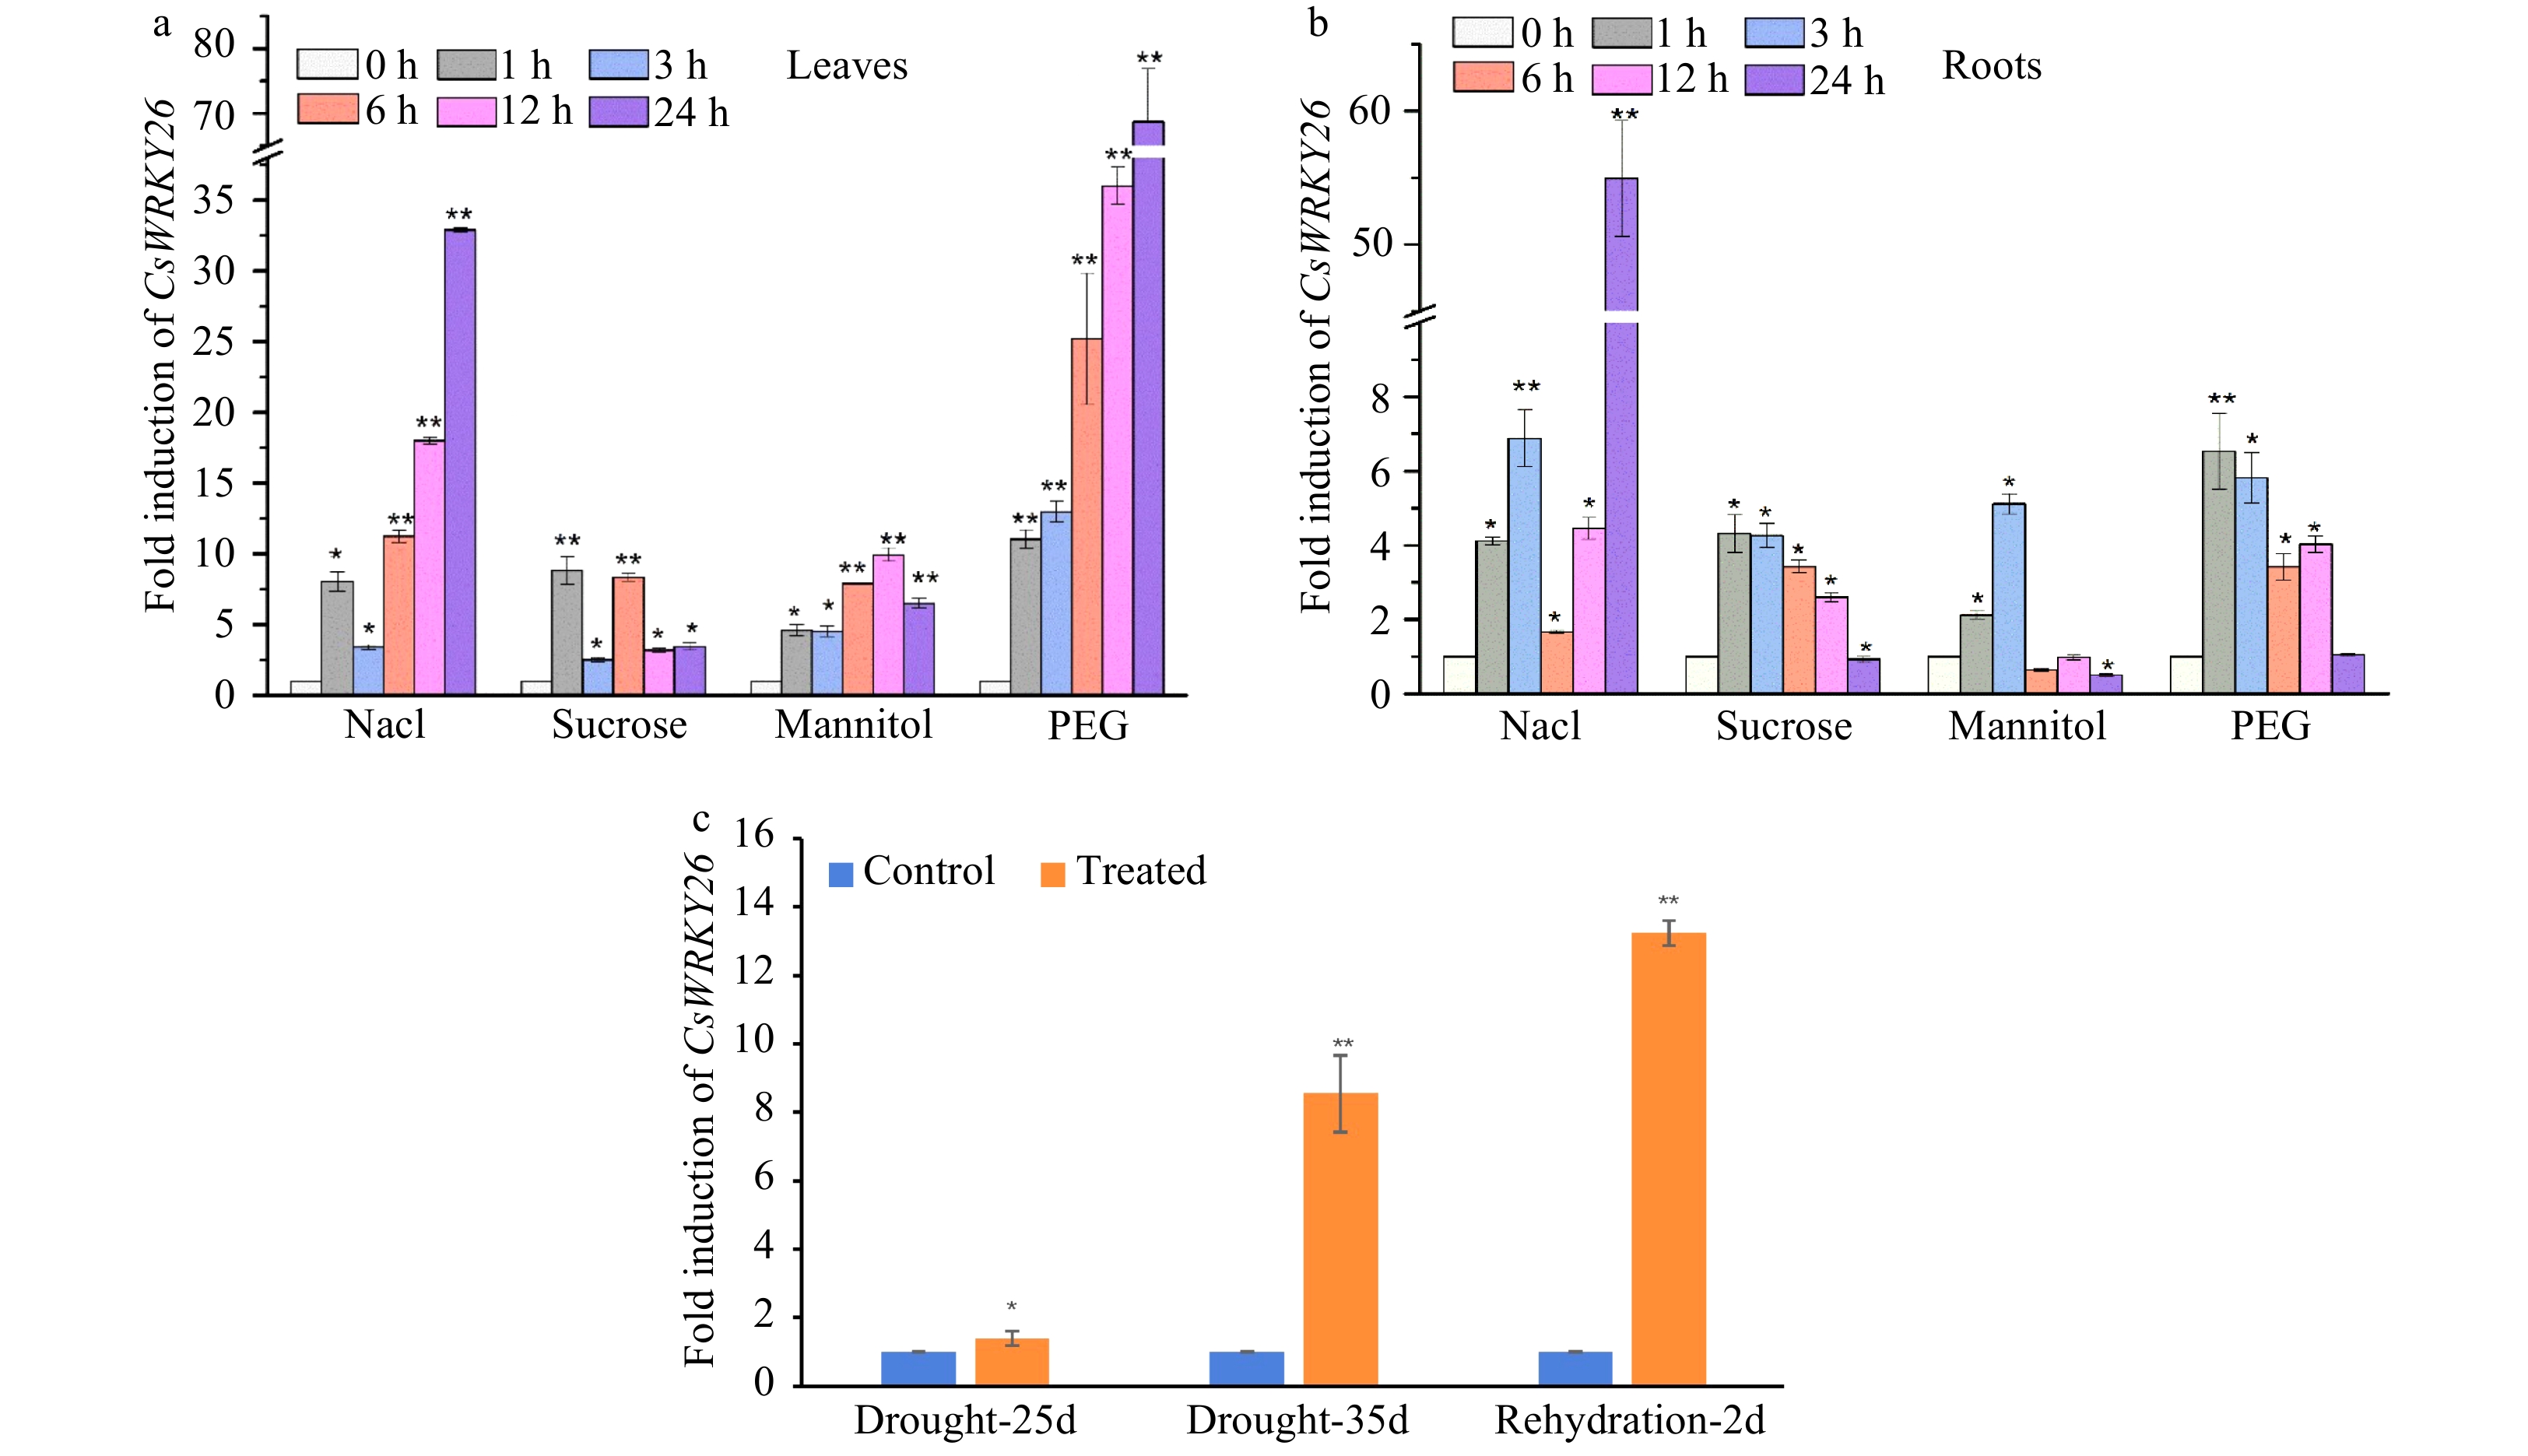
Figure 2. Expression patterns of CsWRKY26 gene in tea plants under different abiotic stress. (a) CsWRKY26 transcripts accumulate in leaves under 150 mM NaCl, 90 mM sucrose, 10% (W/V) PEG4000, 90 mM mannitol stresses. (b) CsWRKY26 transcripts accumulate in roots under the same stress as in (a). (c) The fold change of CsWRKY26 in leaves under natural drought stress. The relative expression levels of the CsWRKY26 gene were detected using a qRT-PCR approach. Asterisks indicate that the expression level is significantly different from the value of the control (*p < 0.05, **p < 0.01).
-
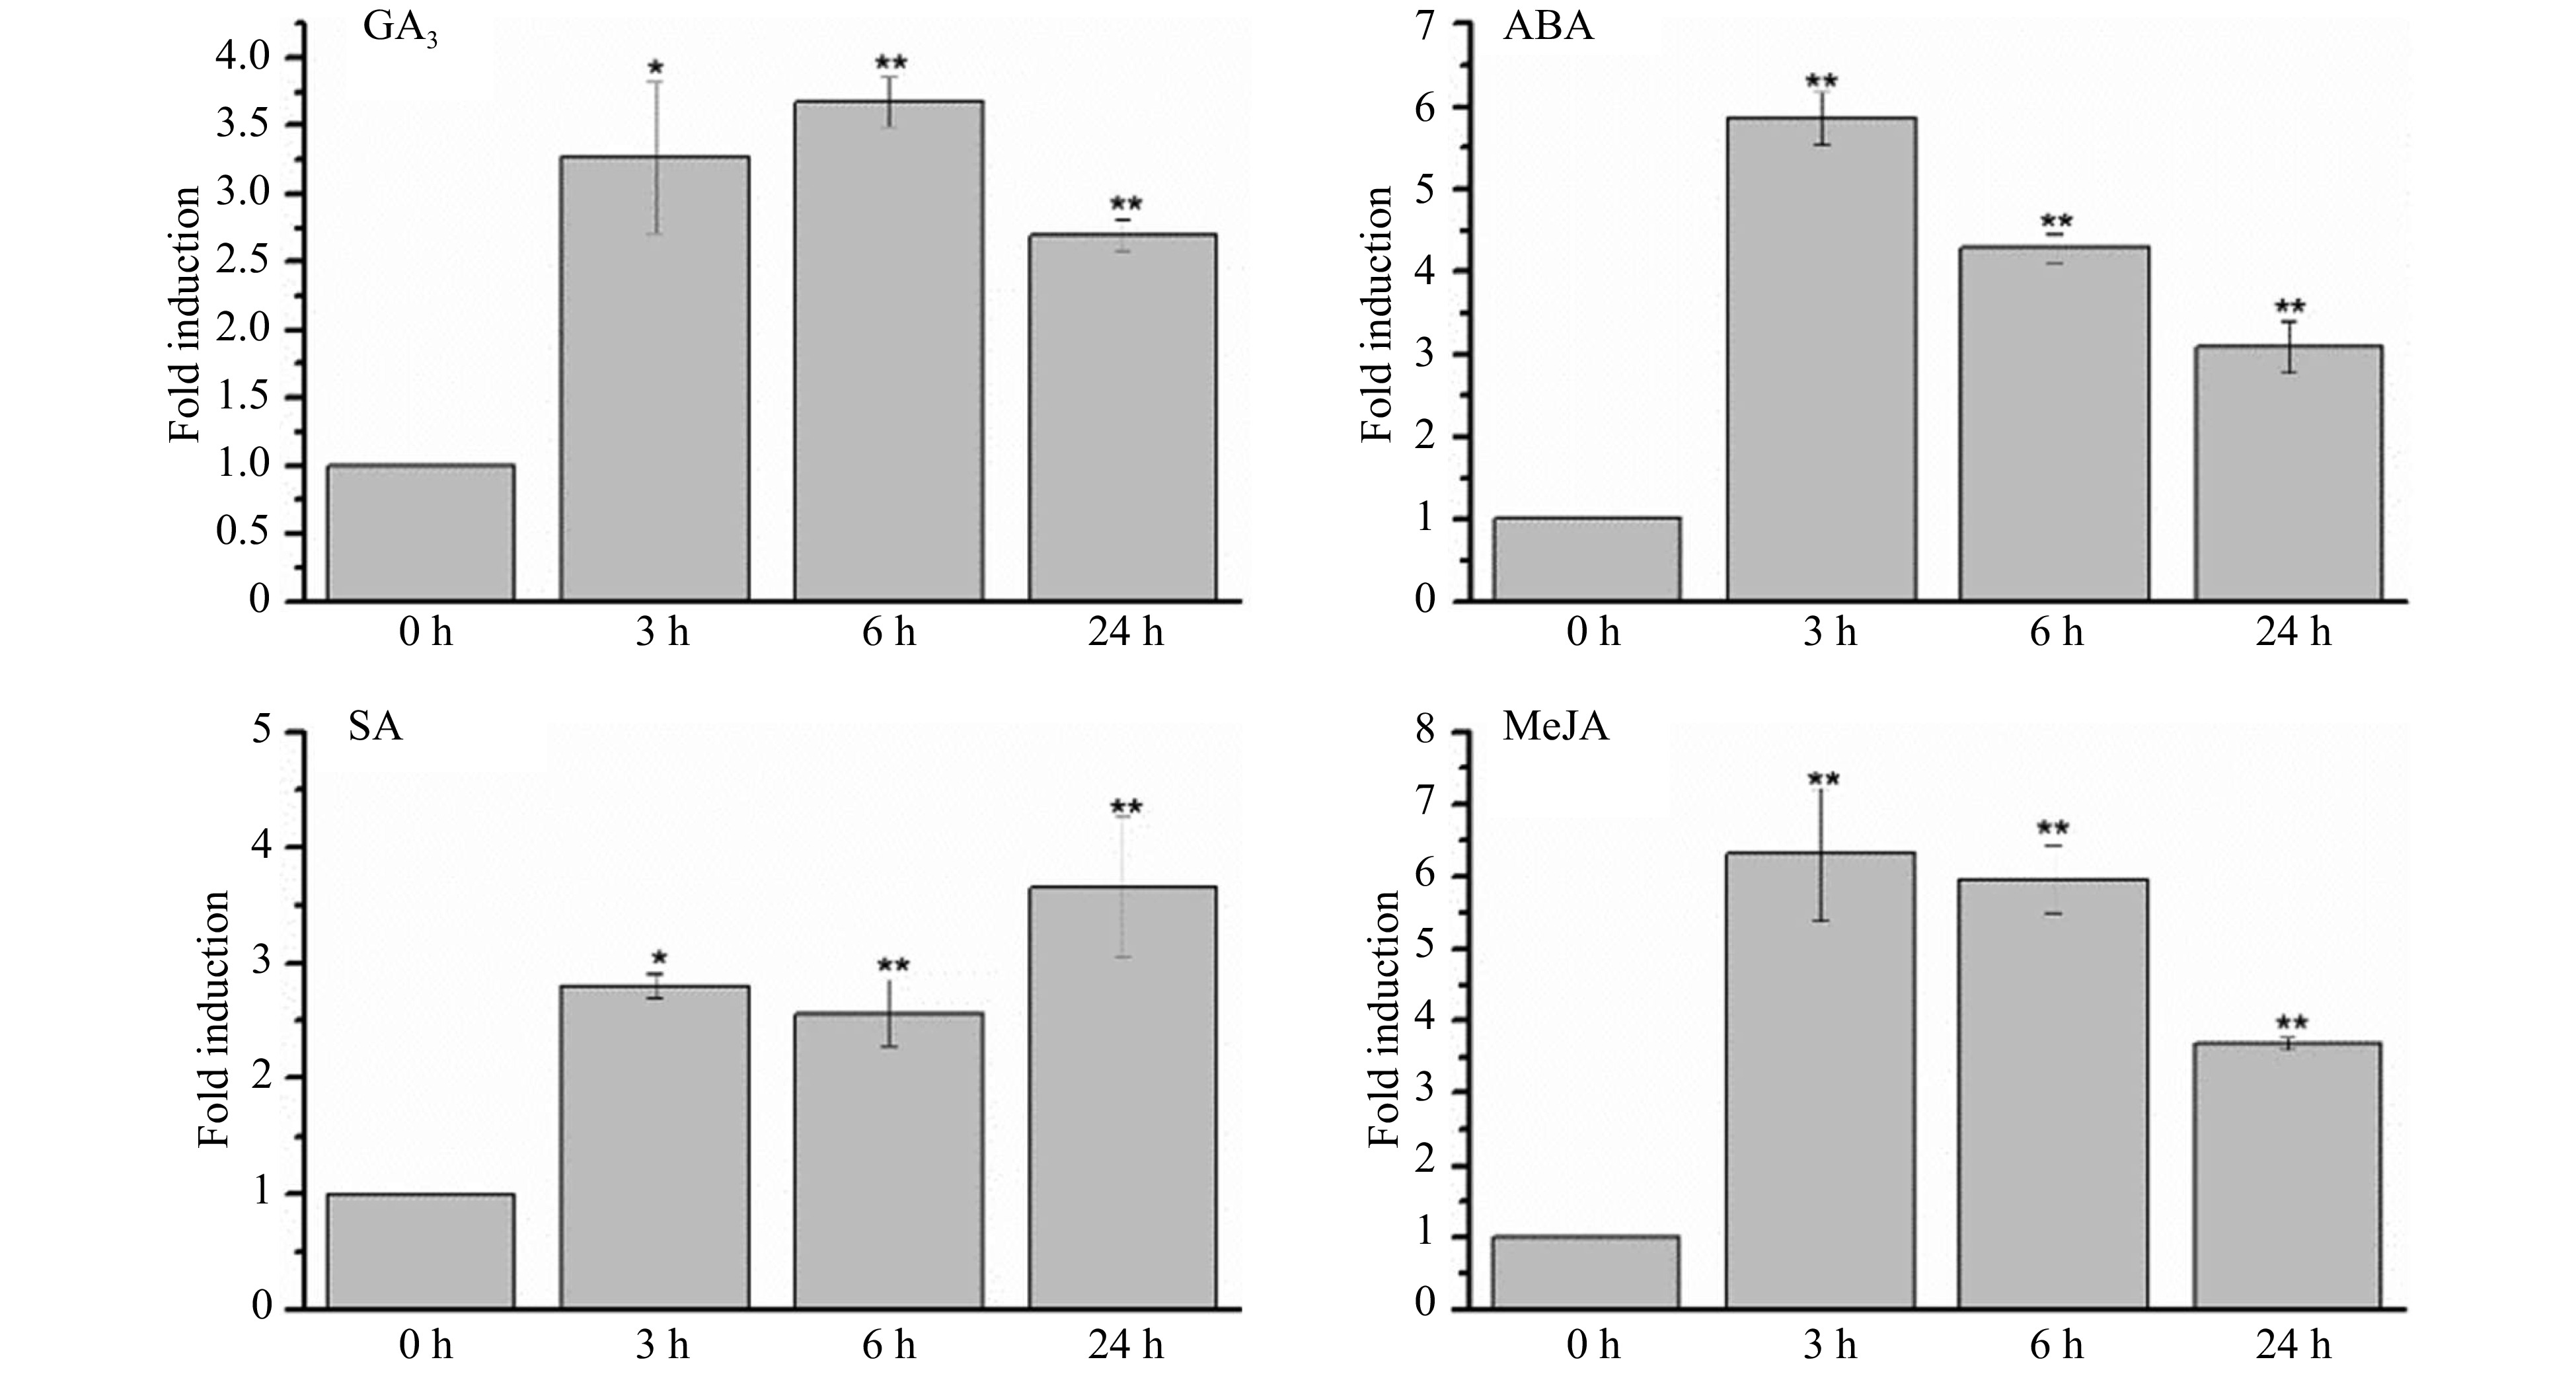
Figure 3. CsWRKY26 expression in leaves under various hormones treatments. The seedlings were treated with different hormones (100 µM GA3, 100 µM ABA, 5 mM SA and 50 µM MeJA), and leaves were harvested for expression analysis after 24 h of treatment. The level of CsWRKY26 expression were normalized to GAPDH and compared with control conditions. Data shown are averages of three biological replicates, with error bars representing SD. The asterisks indicate that the expression level is significantly different from the value of the control (*p < 0.05, **p < 0.01).
-
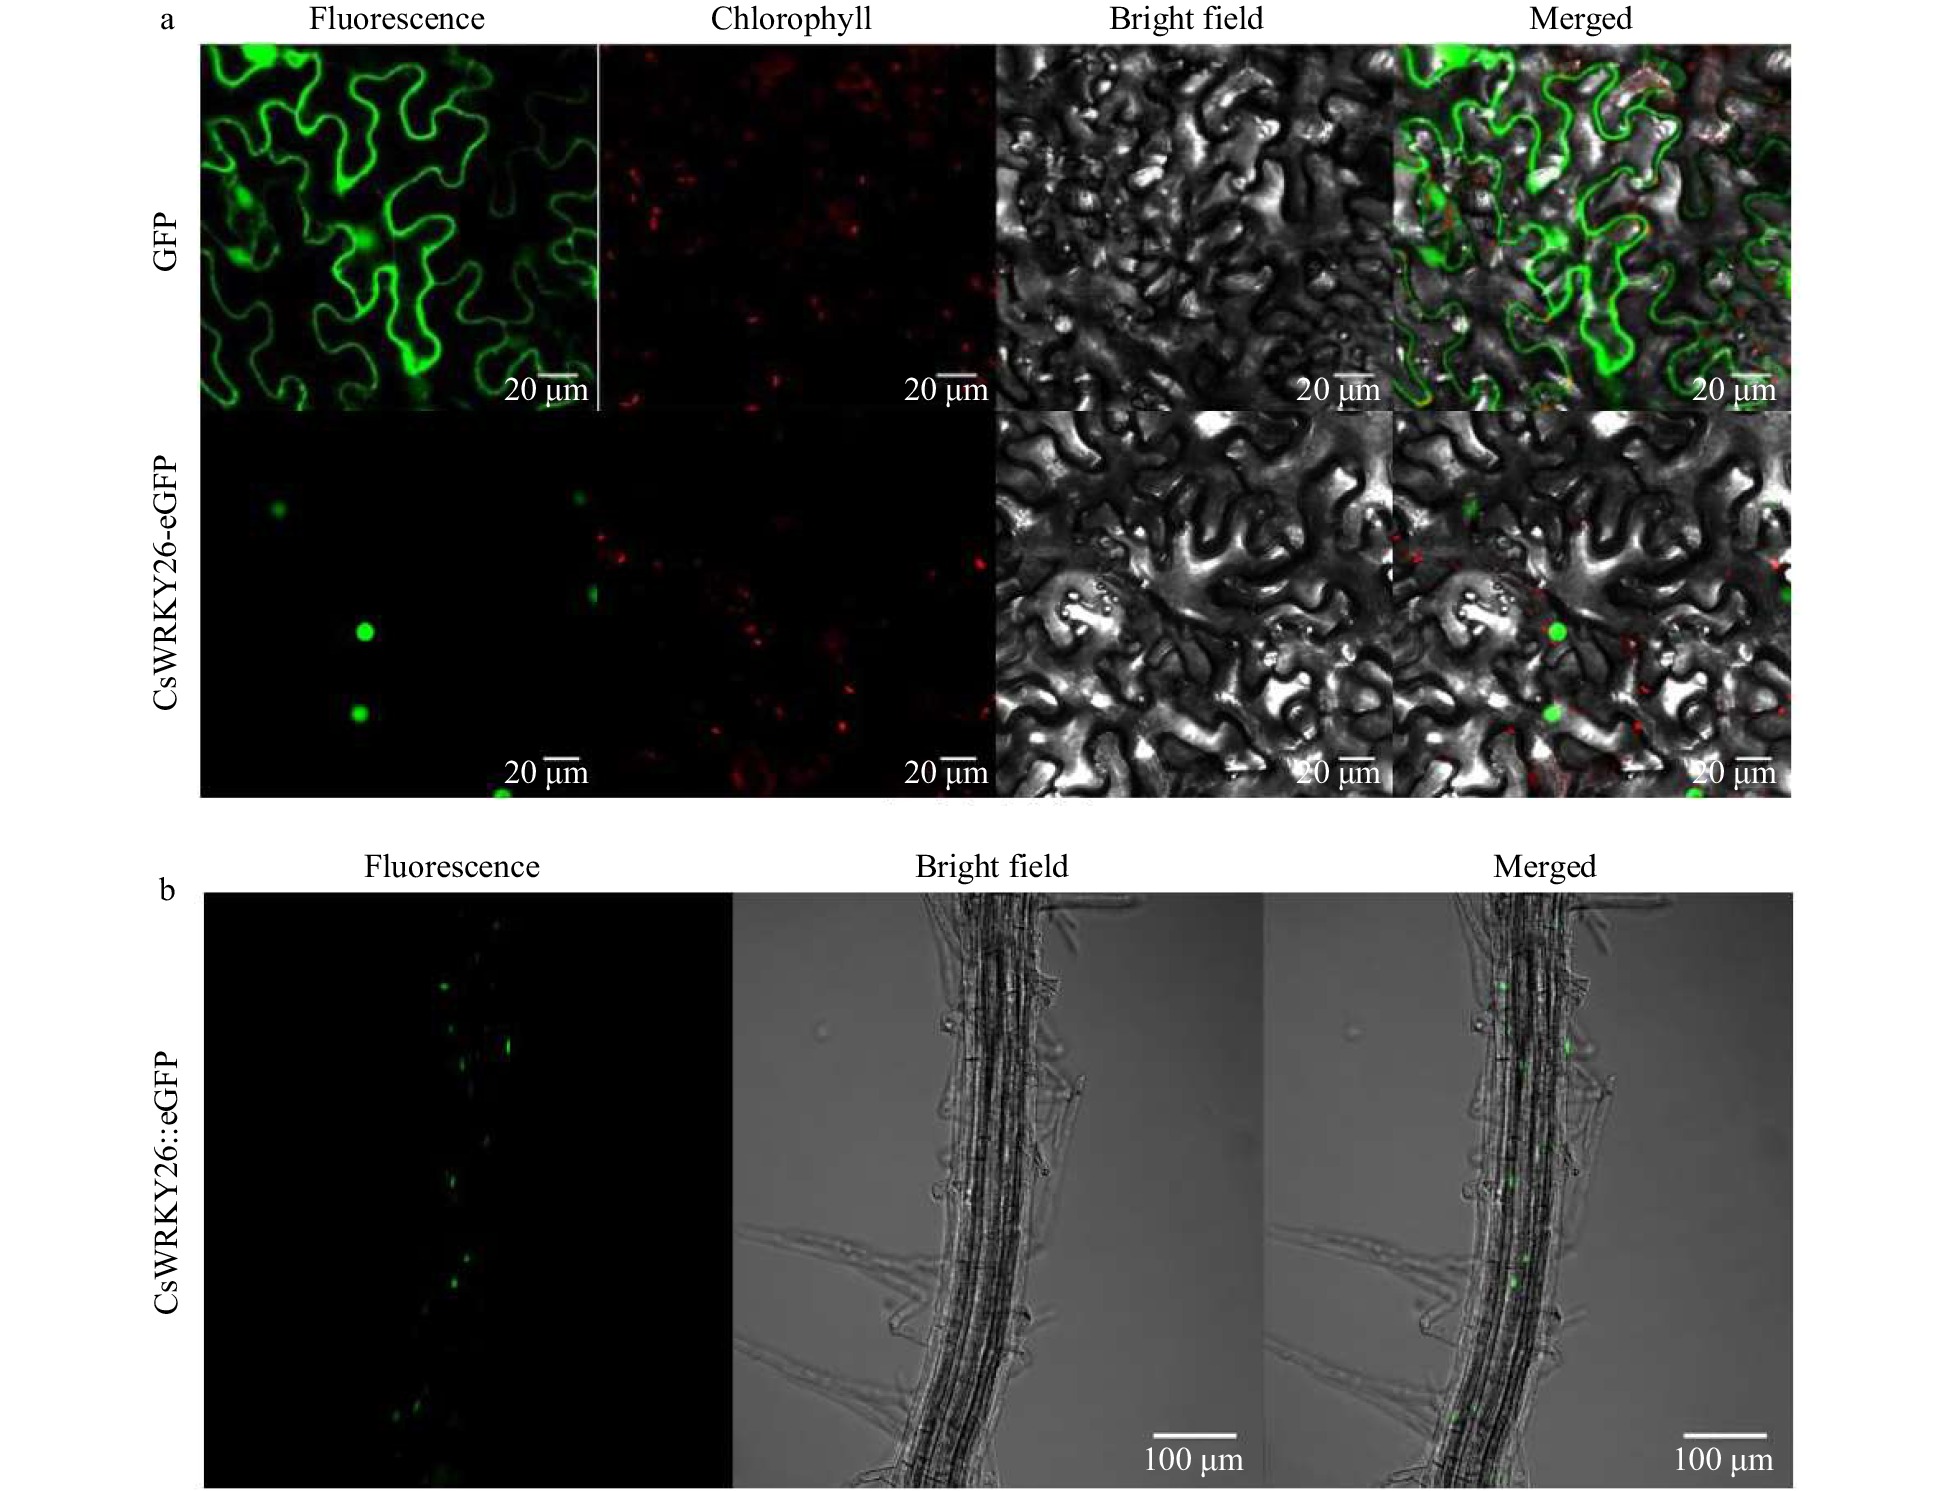
Figure 4. Subcellular localization analysis of CsWRKY26 protein. (a) GFP alone (upper panel) and CsWRKY26-eGFP (middle panel) were transiently expressed in tobacco epidermal cells. Representative images from left to right in each panel were taken under fluorescence, chlorophyll, transmitted light and an overlay of both channels. Scale bar = 20 µm. (b) Subcellular localization of CsWRKY26-eGFP in Arabidopsis roots. Representative images from left to right were taken under fluorescence, bright field and an overlay of both channels. Scale bar = 100 µm.
-
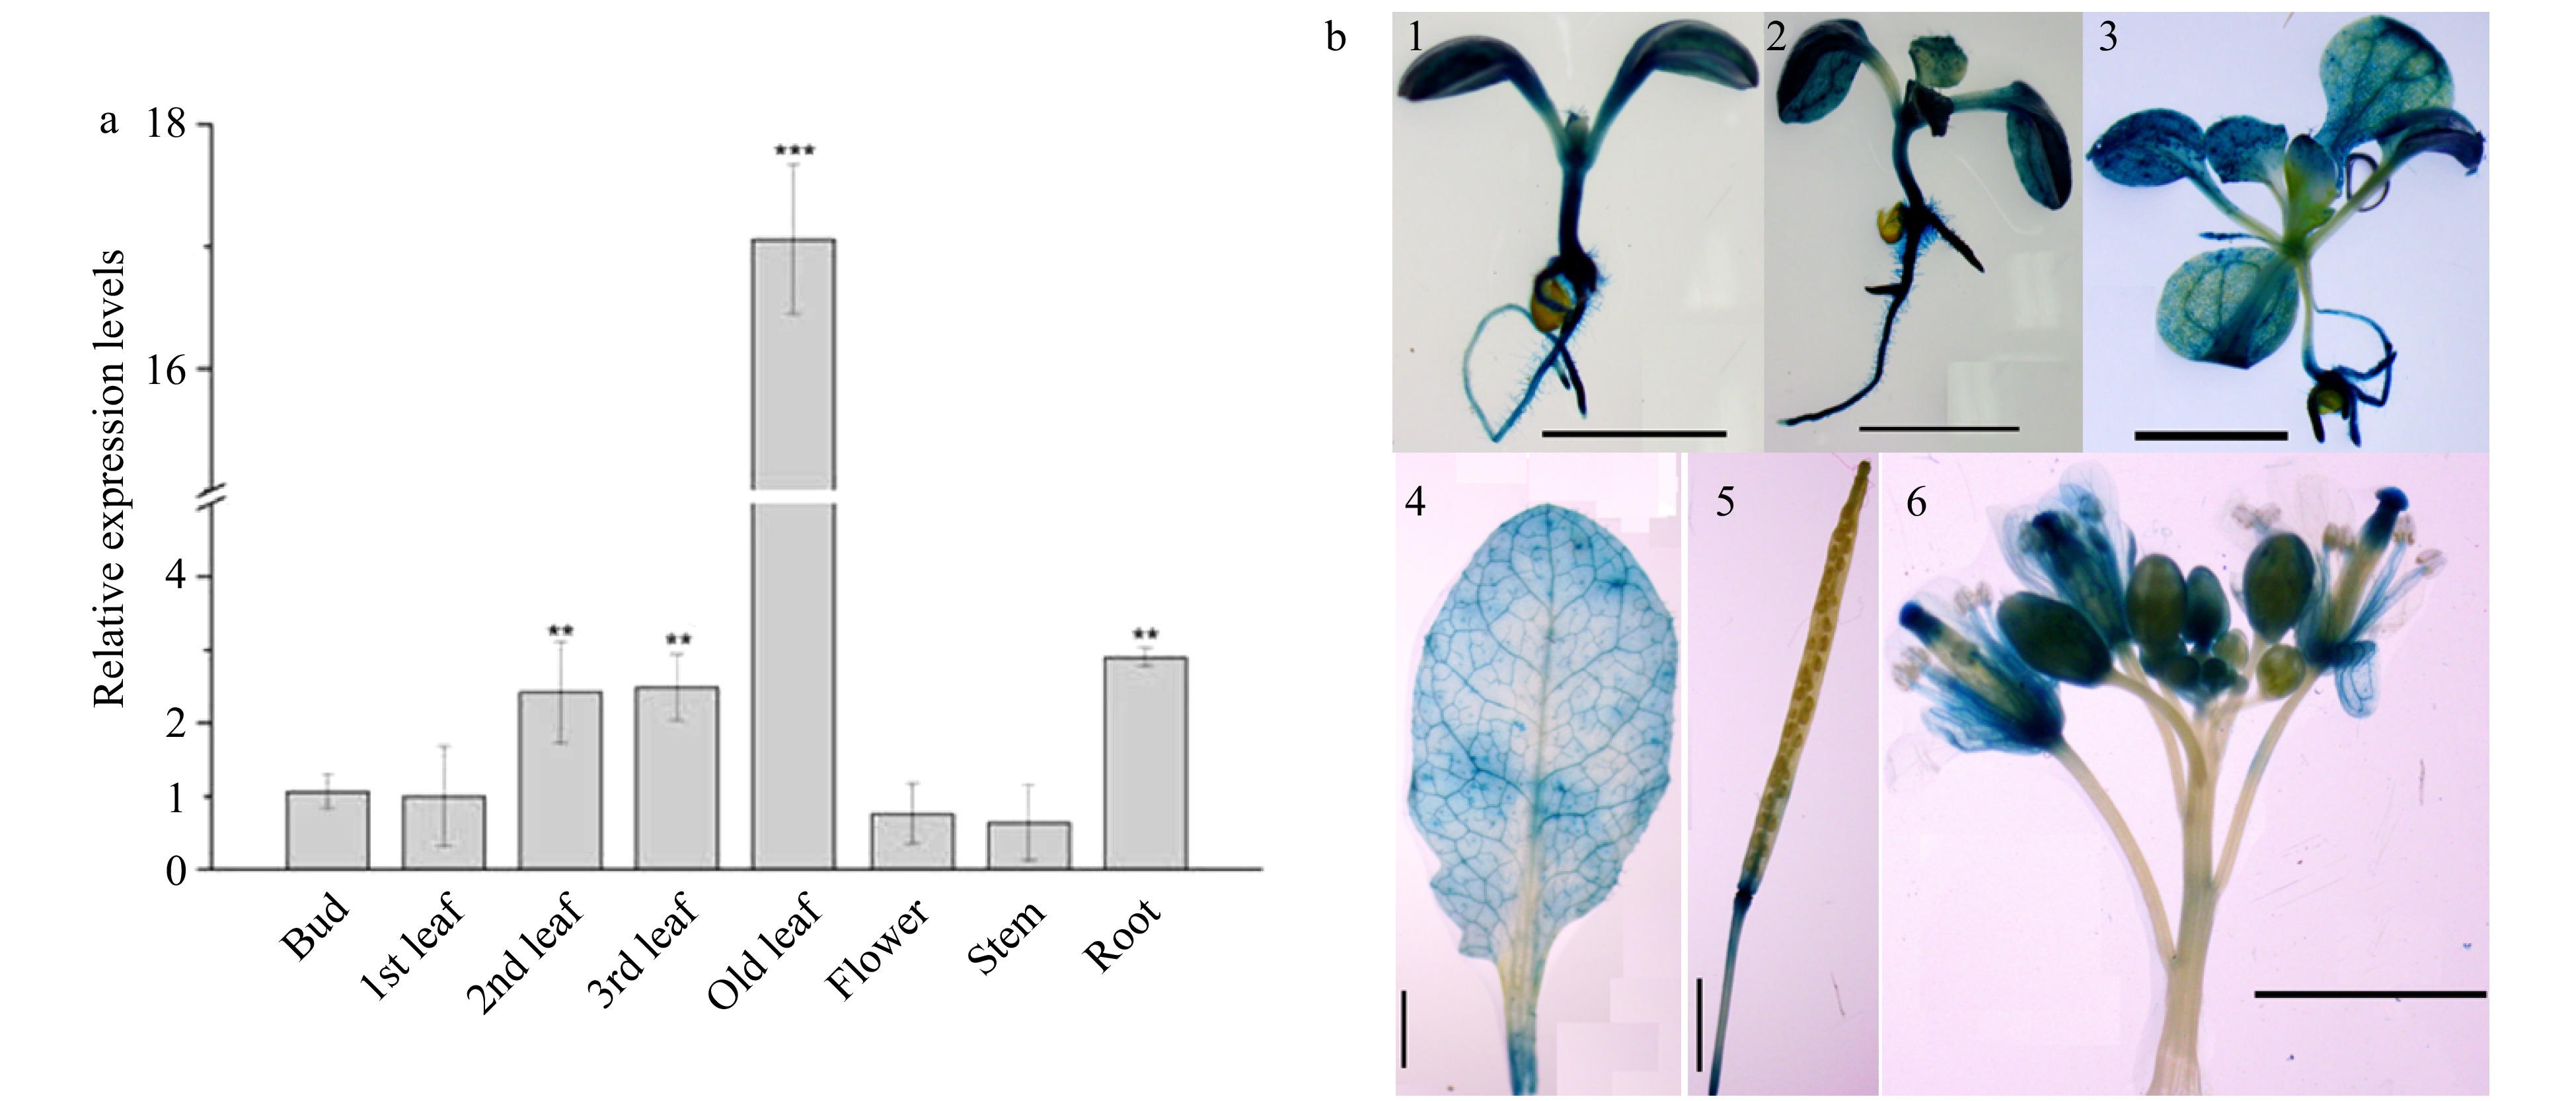
Figure 5. Tissue-specific expression patterns of CsWRKY26 gene. (a) Quantitative RT-PCR of CsWRKY26 expression in various tissues: bud, 1st leaf, 2nd leaf, 3rd leaf, old leaf, flower, stem and root. The transcript levels of CsWRKY26 gene in various tissues were related to GAPDH and compared with that of bud. Asterisks indicate that the expression level is significantly different from the value of the control (*p < 0.05, **p < 0.01). (b) Histochemical staining of transgenic Arabidopsis with ProCsWRKY26::GUS, (1) 7-d-old seedling, (2) 10-d-old seedling, (3) 20-d-old seedling, (4) mature rosette leaf, (5) silique, (6) flowers. Scale bars = 2 mm.
-
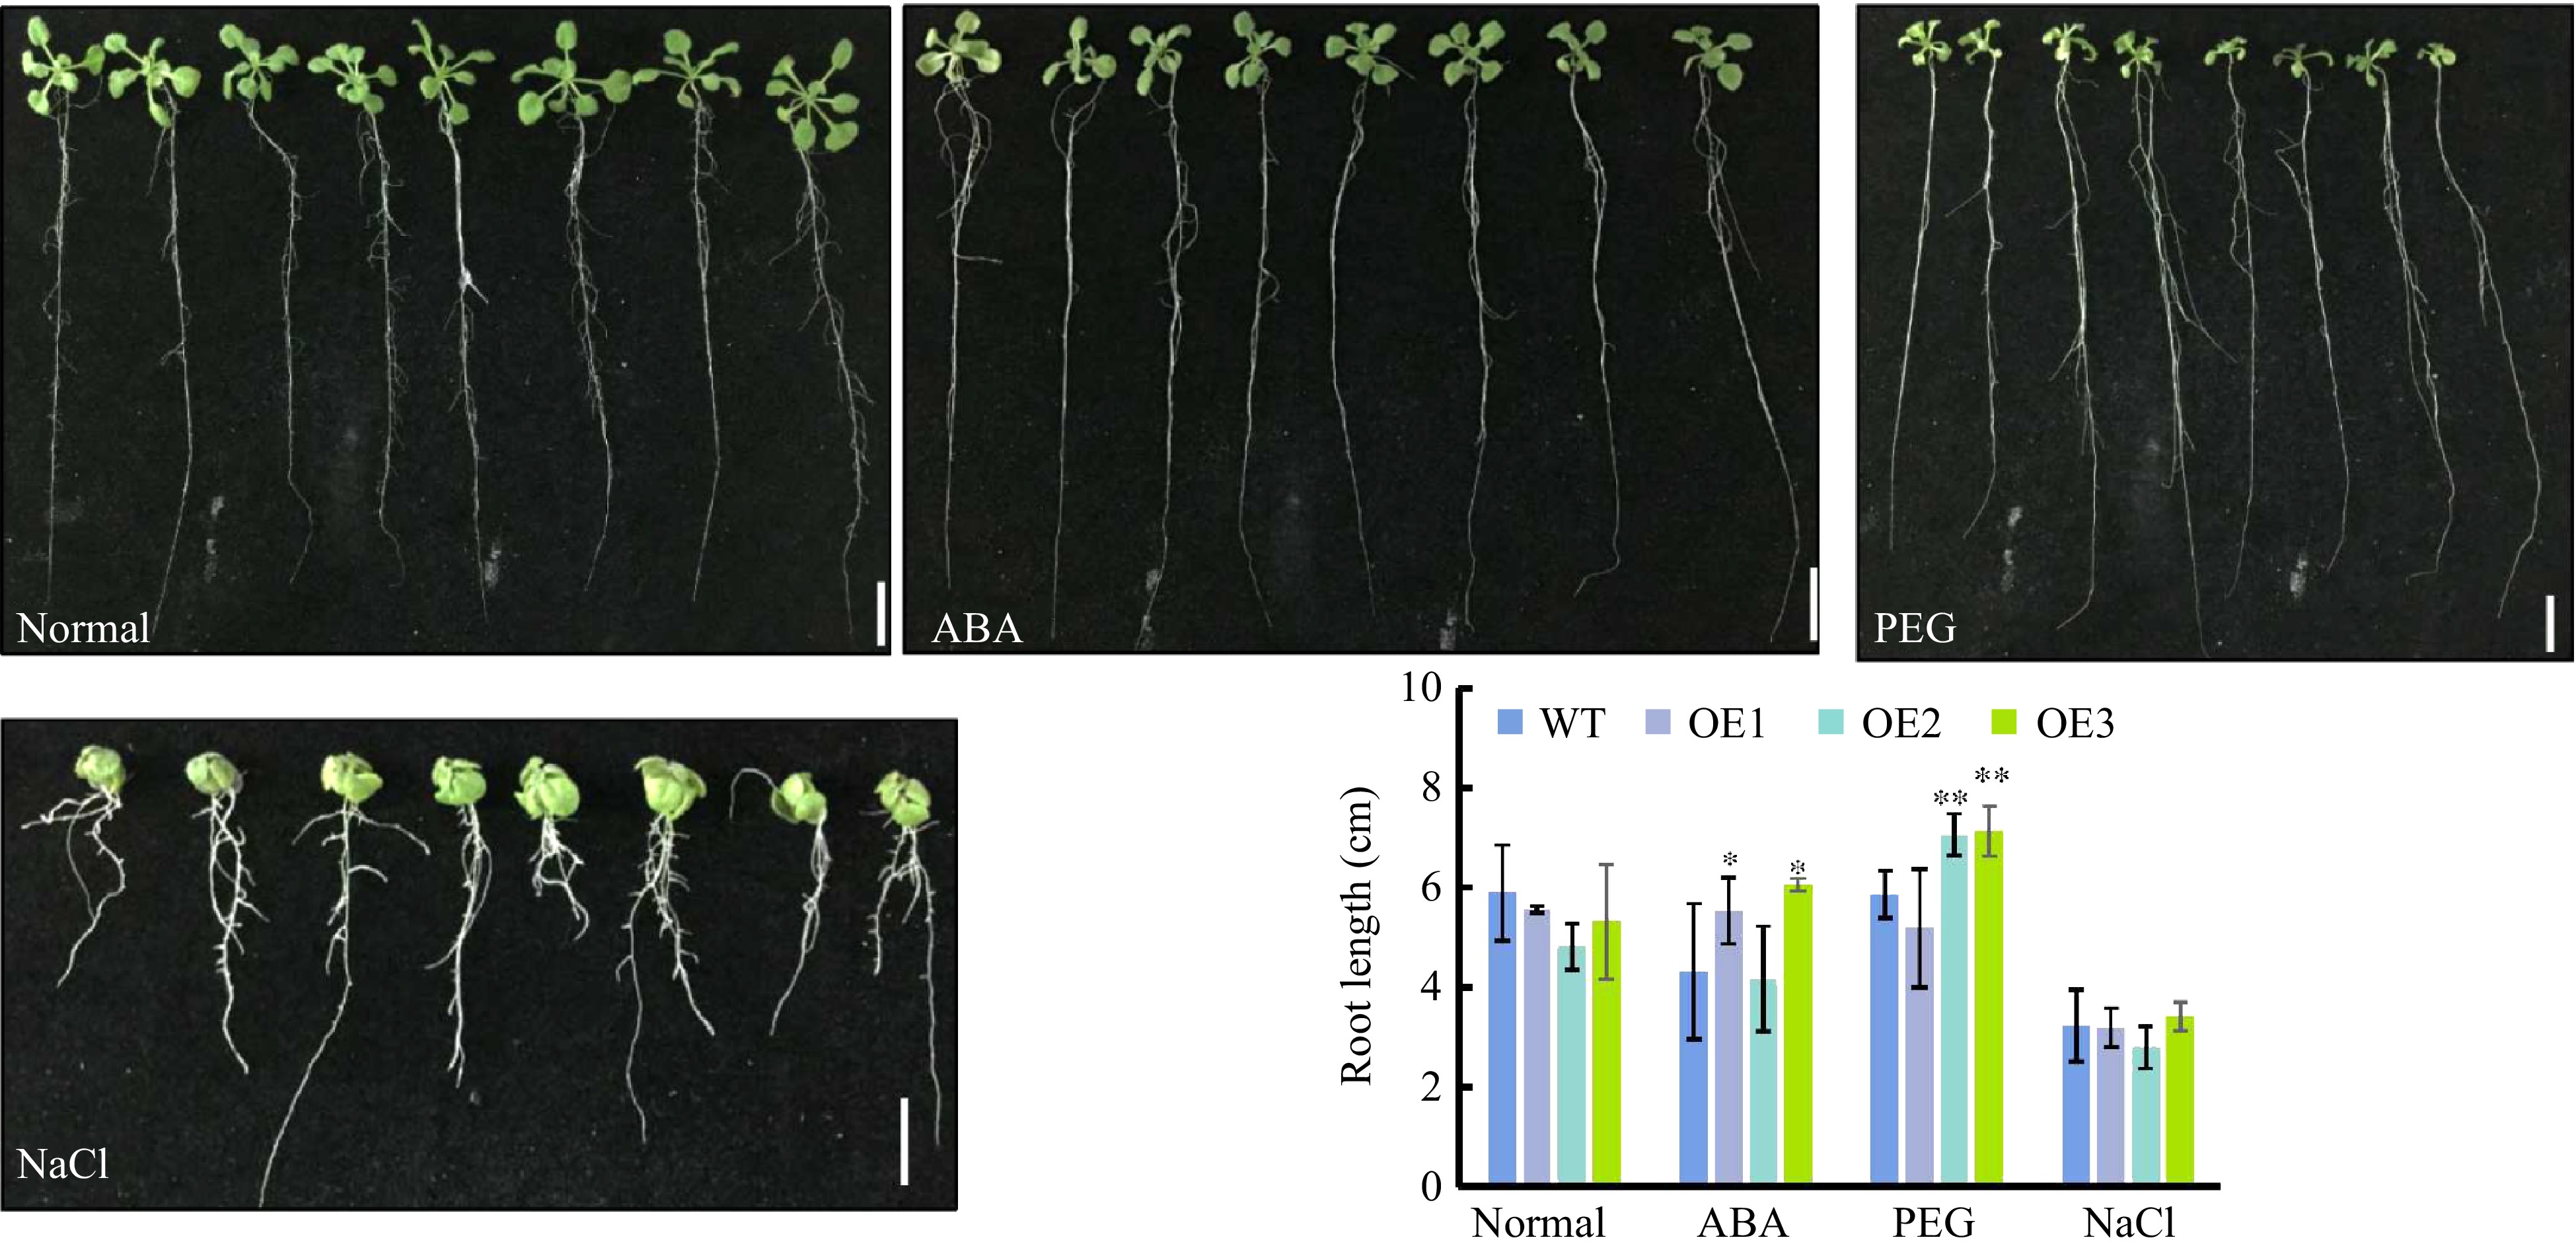
Figure 6. Root elongation of CsWRKY26-overexpressing Arabidopsis lines under various stress conditions. Four-d-old seedlings were transferred onto plates with or without 0.3 μM ABA, 15% PEG6000, 150 mM NaCl for 10 d, and numbers of root length were determined after 10 d of vertical growth (n > 12). Bars and error bars represent mean ± SE, scale bars =1 cm.
-
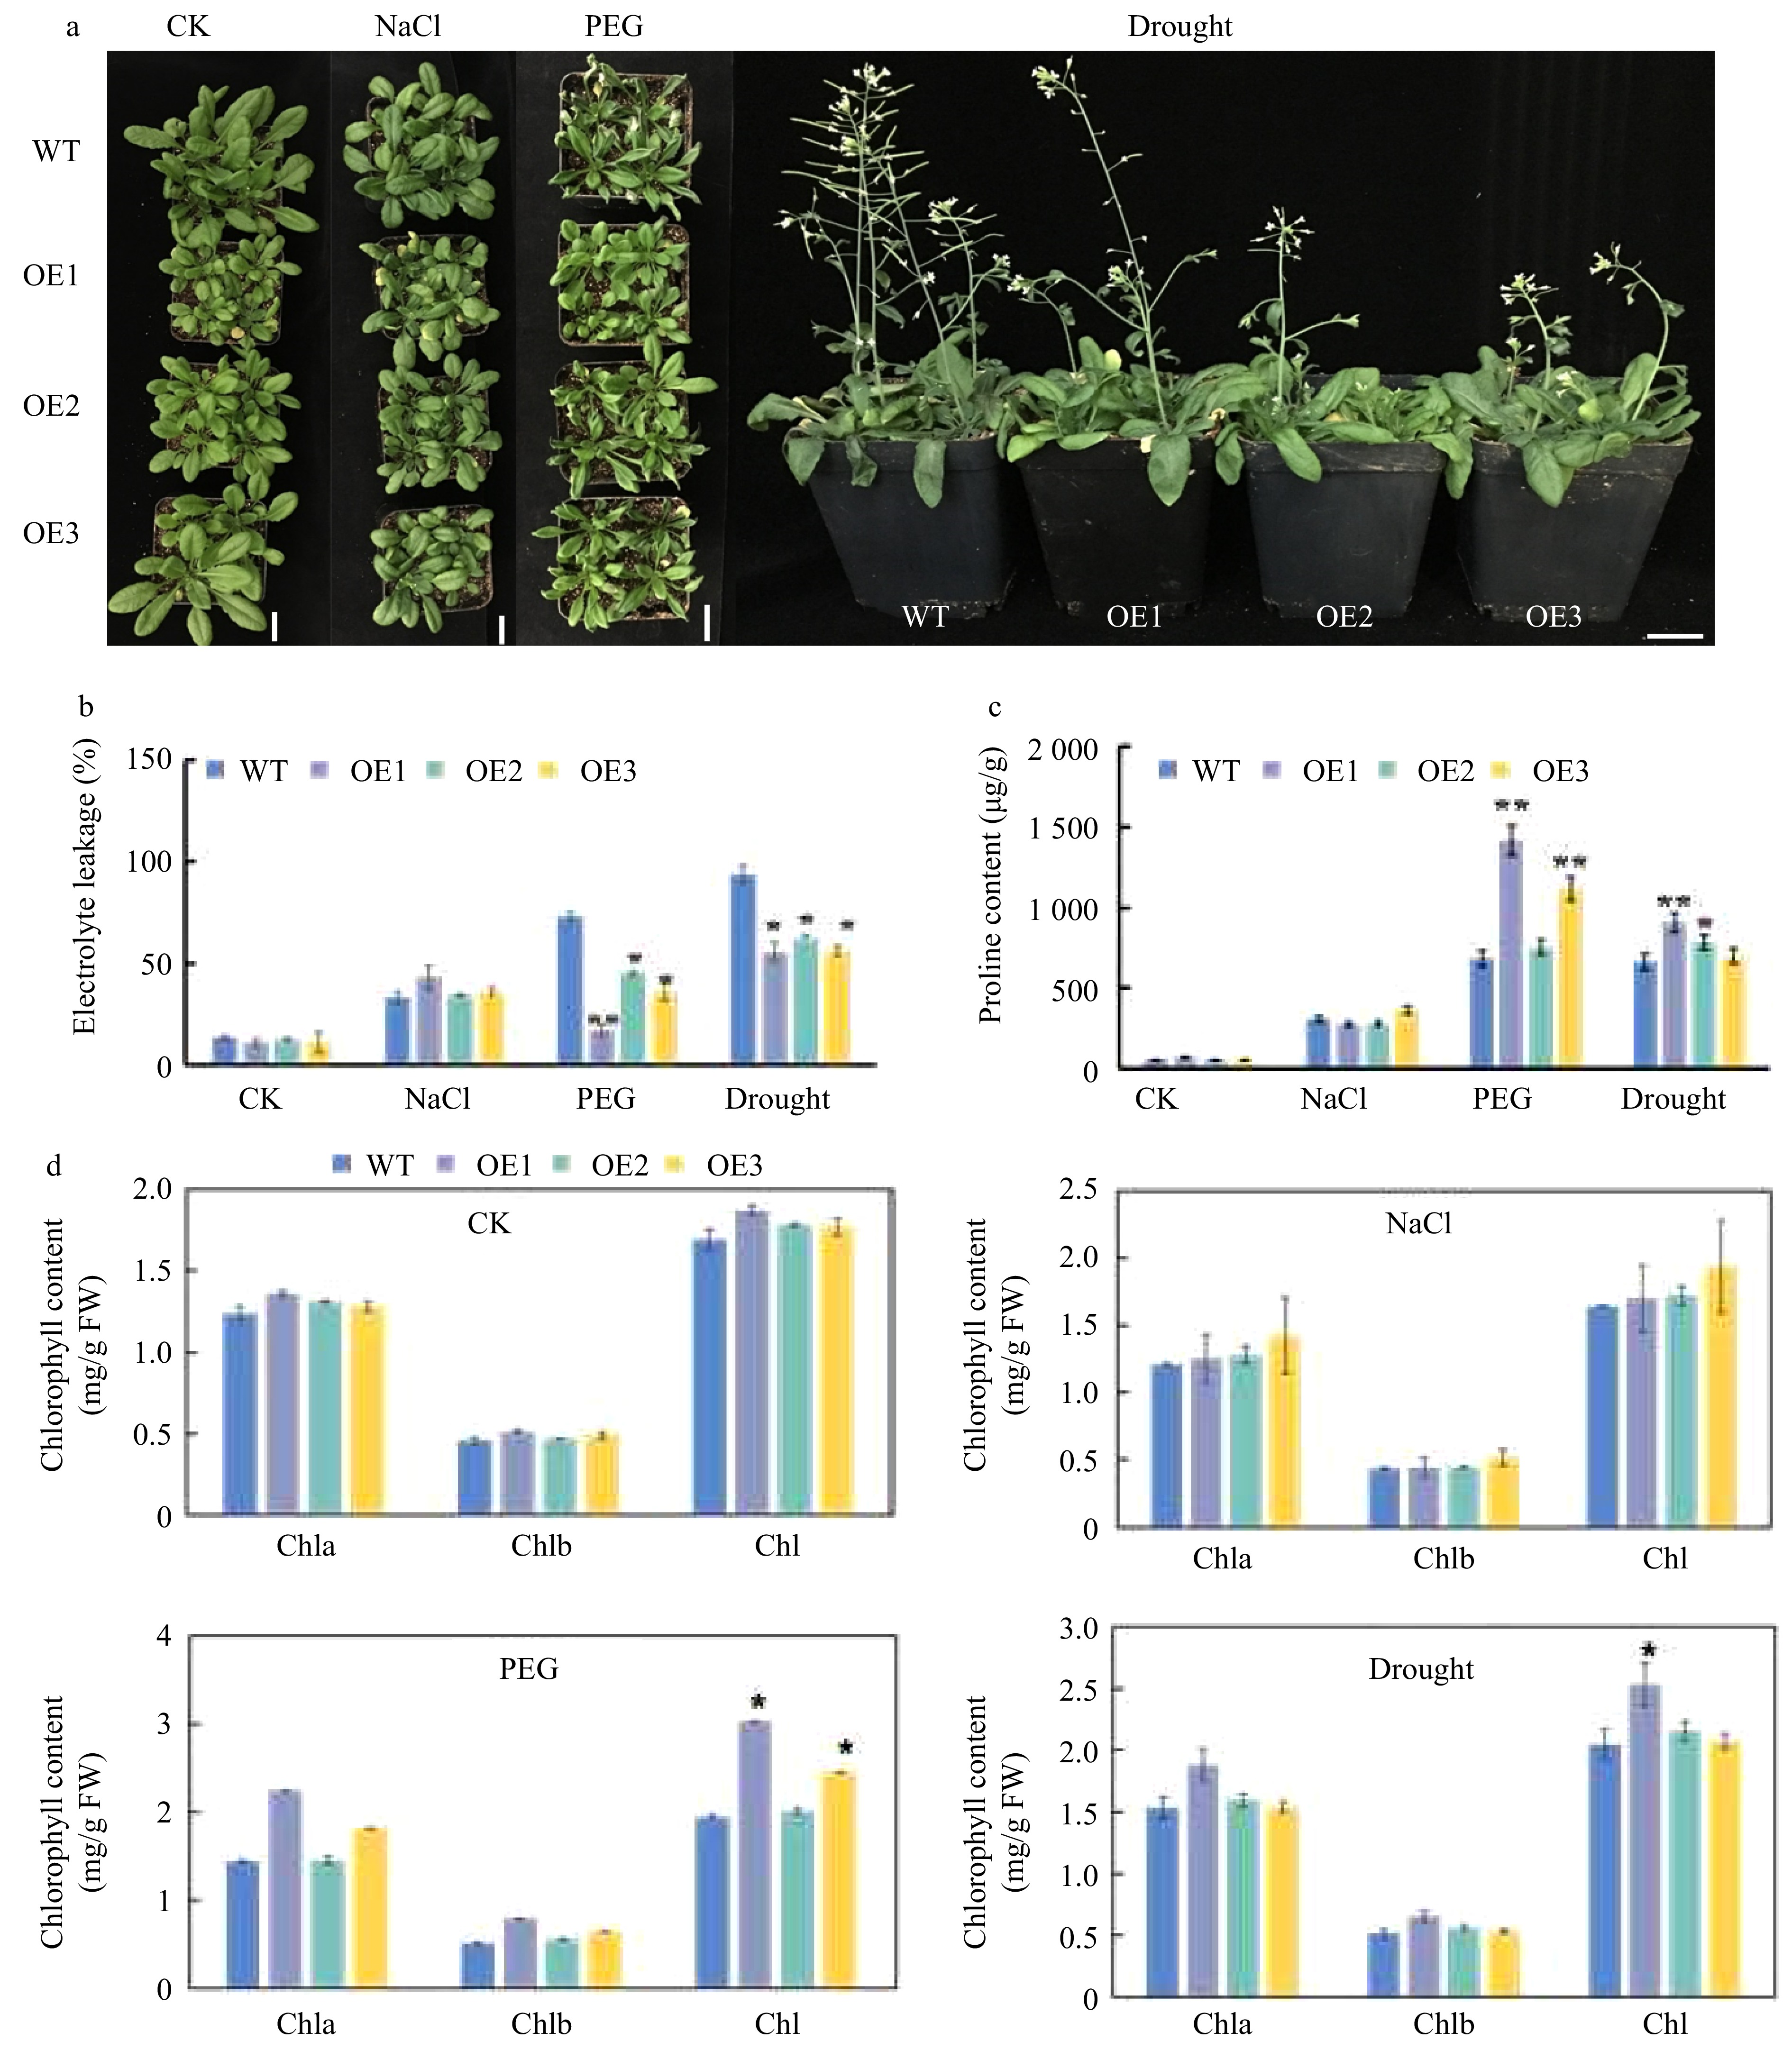
Figure 7. Phenotype of CsWRKY26-overexpressing transgenic plants and WT plants under different stress conditions. (a) Phenotype of WT and of CsWRKY26-overexpression Arabidopsis lines grown with or without exposure to salt treatment for 7 d, 15% PEG6000 treatment for 7 d, and a natural 15-d drought. (b−d) Determination of physiological indicators: relative electrolyte leakage, proline content, and chlorophyll content. Scale bars = 2 cm.
-
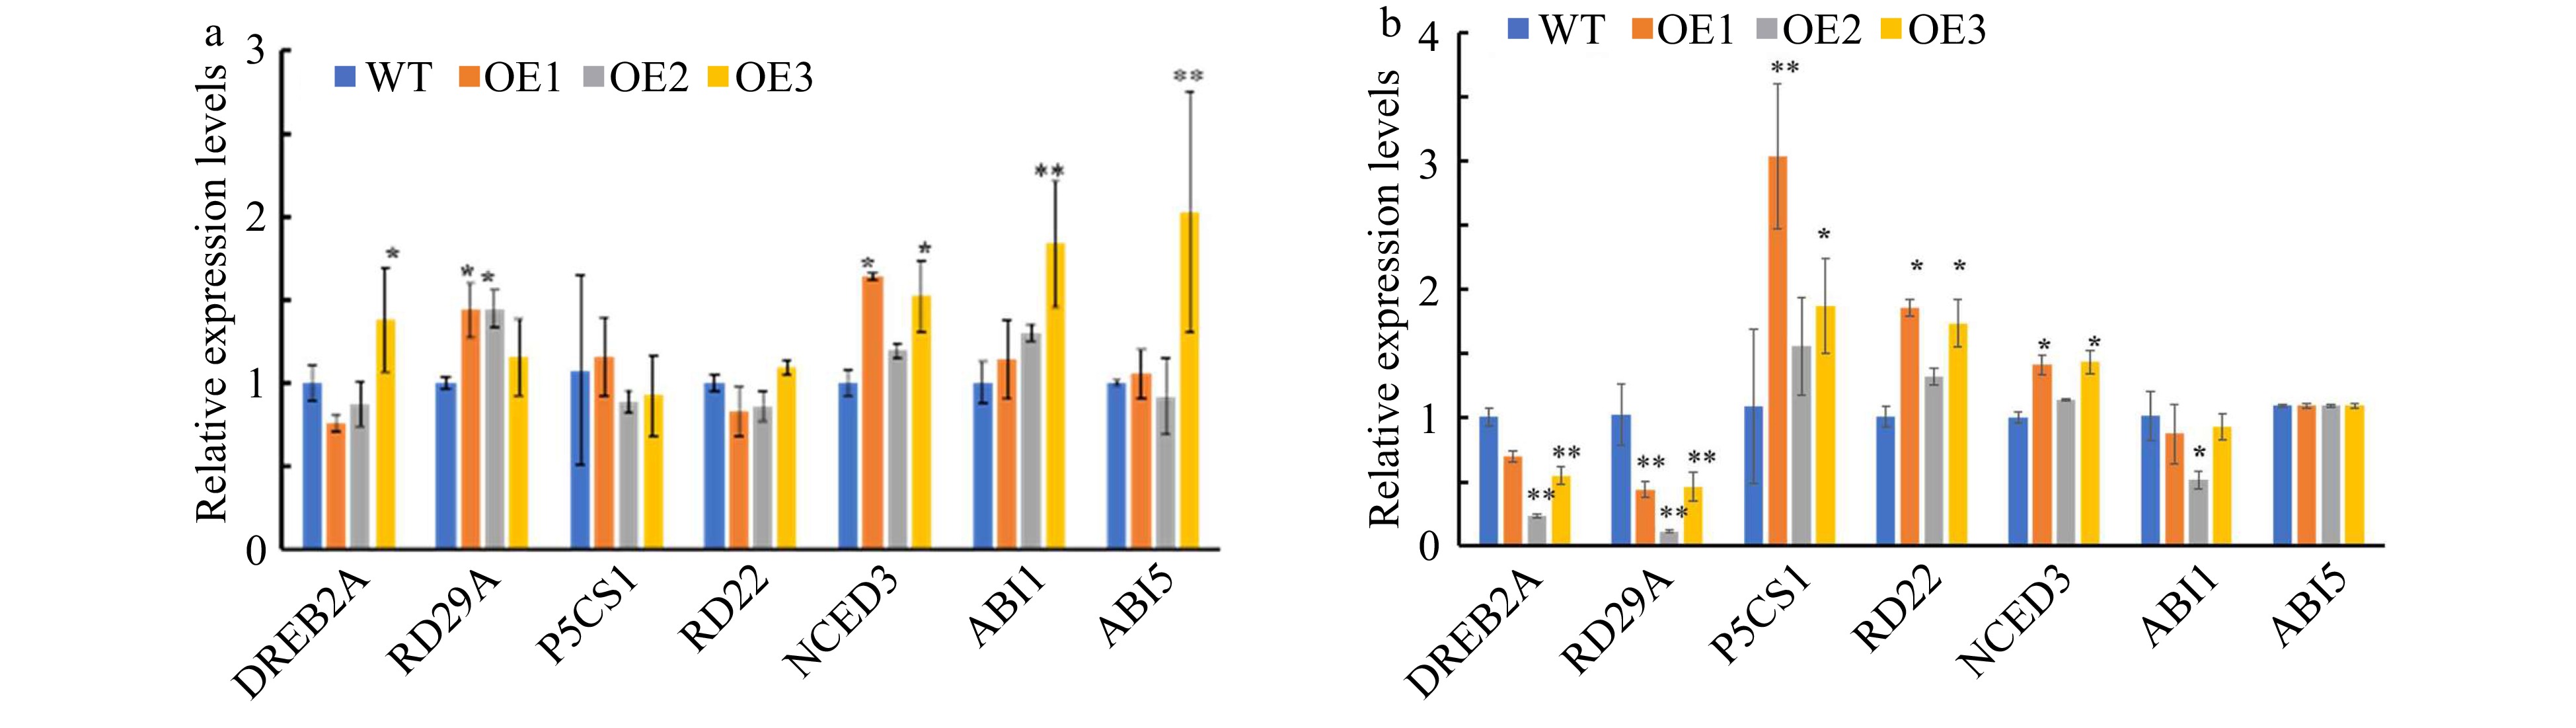
Figure 8. Analysis of expression levels for stress-related genes in CsWRKY26-overexpressing Arabidopsis lines and WT plants under normal and 15% PEG6000 conditions. Transcript levels of these genes in the transgenic lines and WT plants were determined by quantitative RT-PCR using Actin2 as a quantification control. Asterisks indicated that the expression level is significantly different from that of the control (*p < 0.05, **p < 0.01). (a) Normal conditions. (b) Simulated drought conditions induced by15% PEG6000.
Figures
(8)
Tables
(0)