-
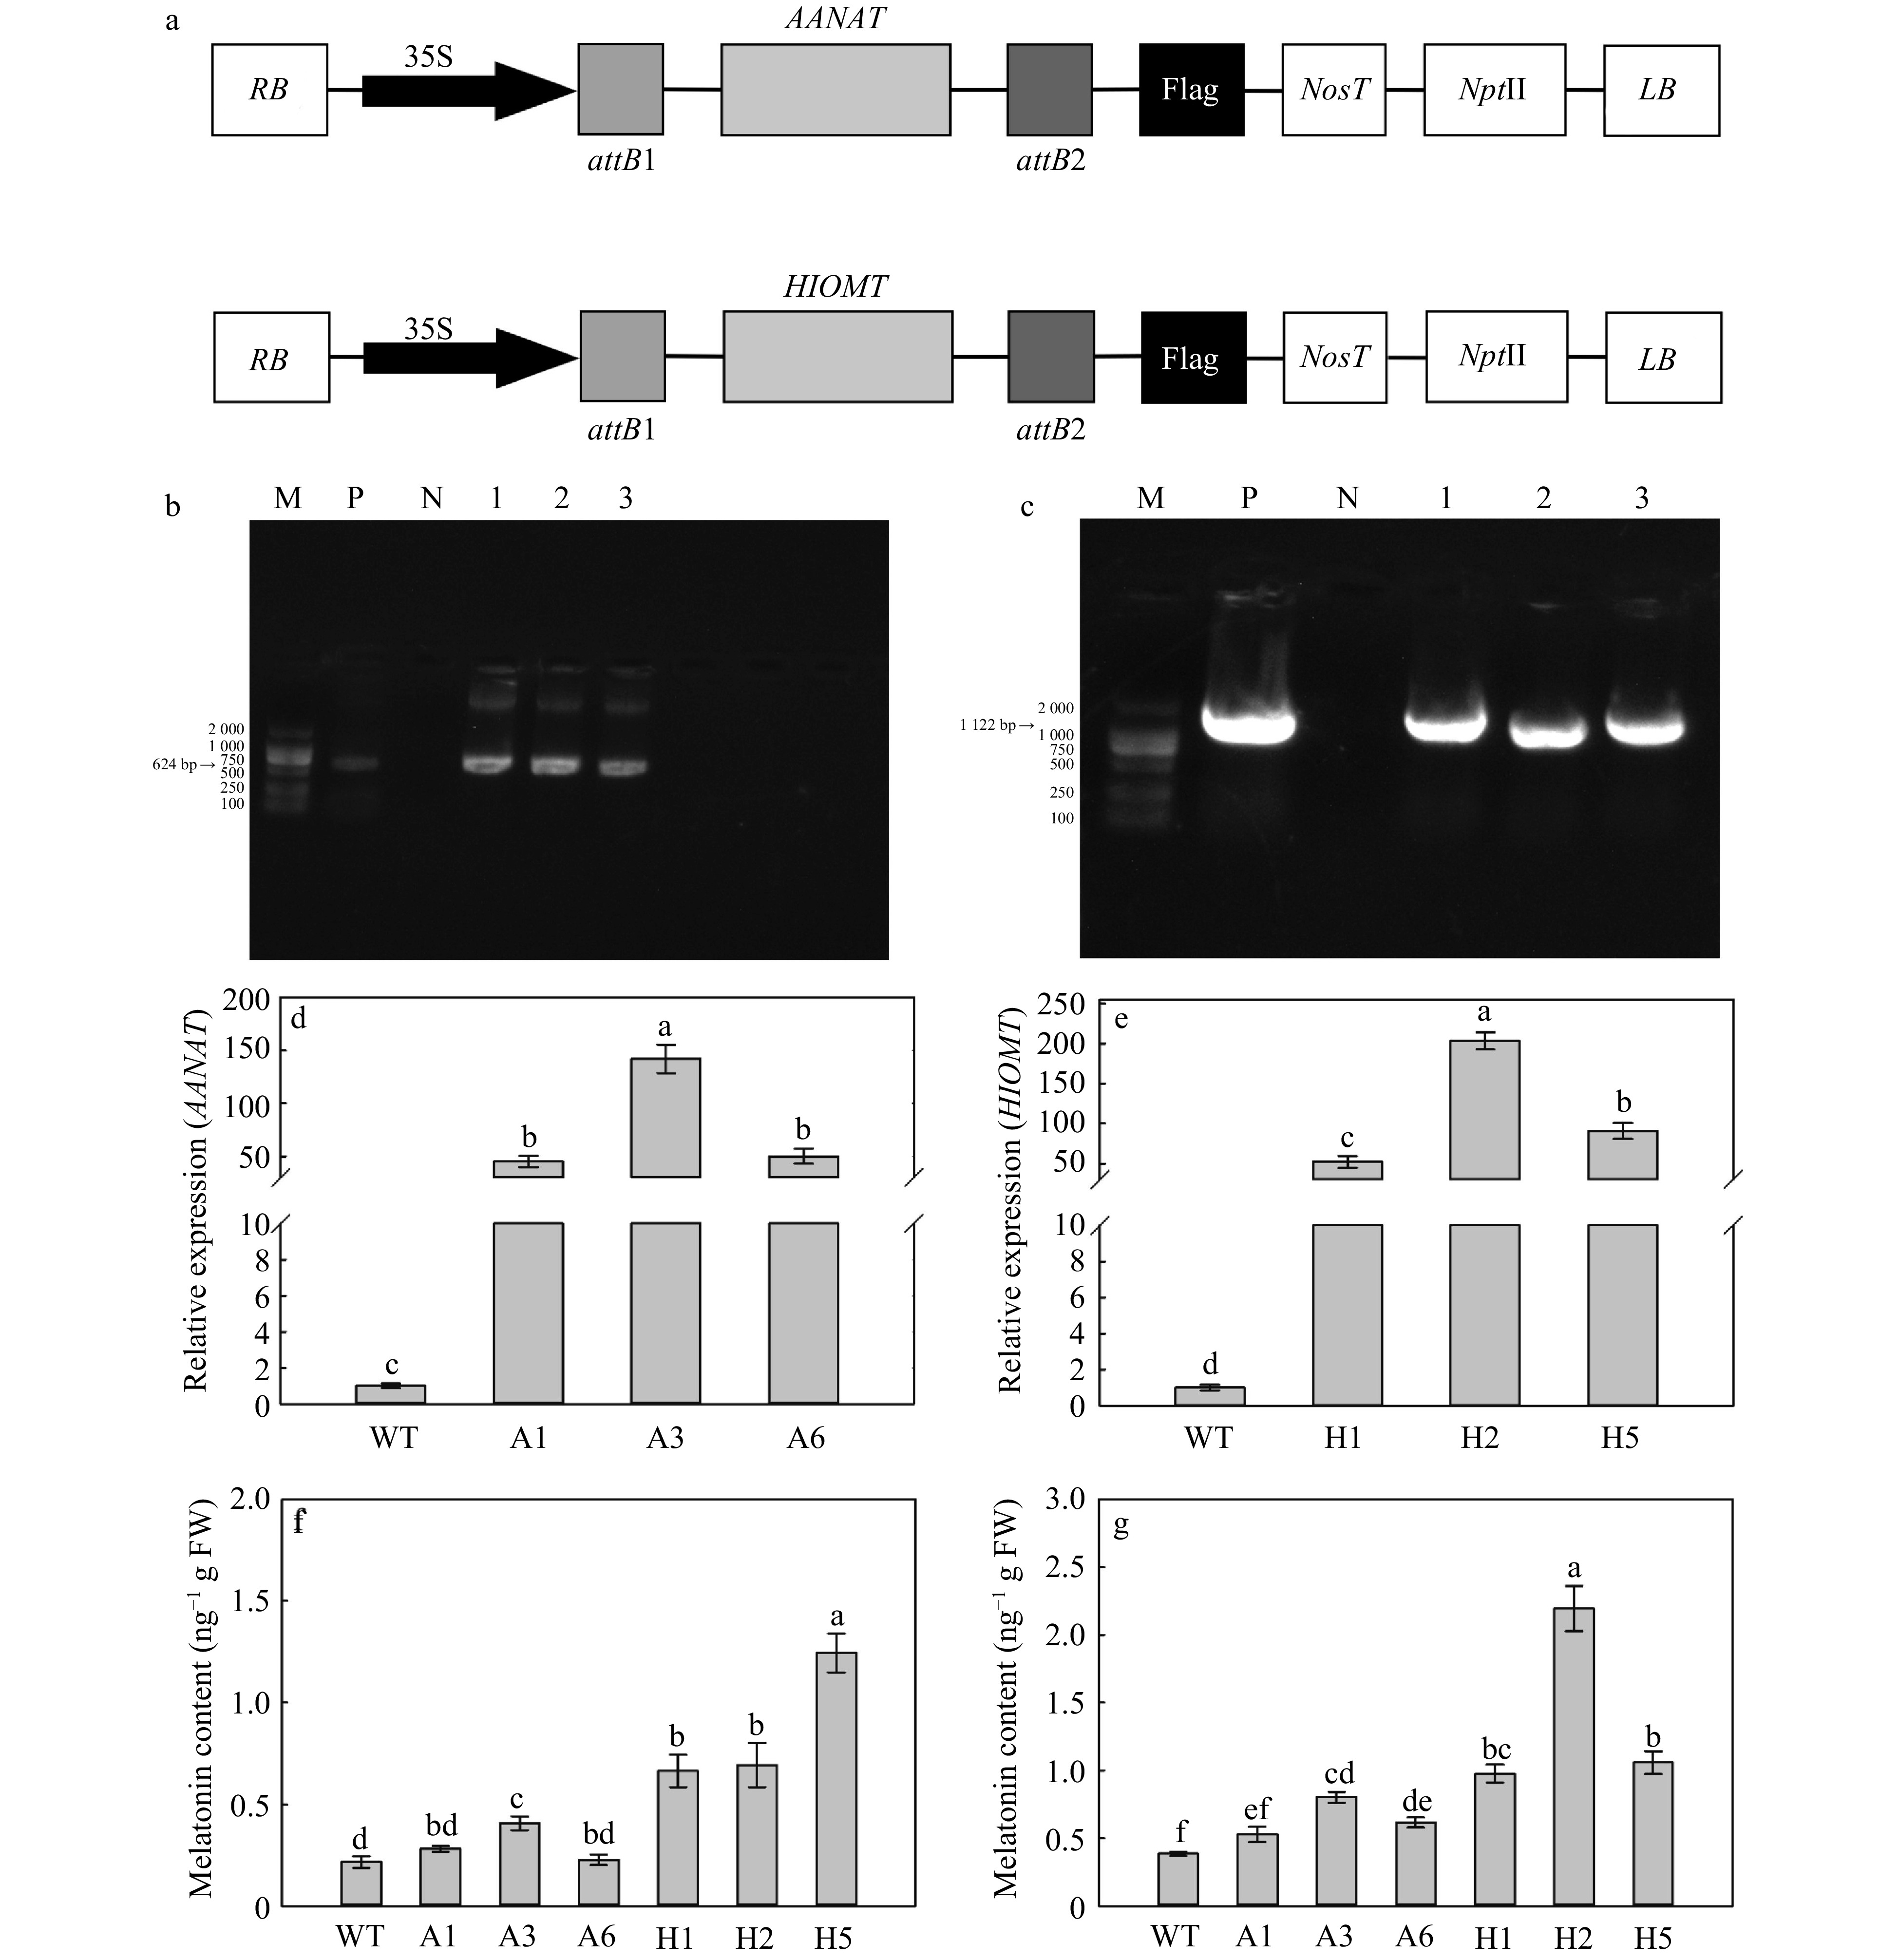
Figure 1. Identification and melatonin content of apple plants with ectopic expression of AANAT or HIOMT. (a) The structure of expression vectors of AANAT and HIOMT genes. PCR confirmation of apple plants with ectopic expression of AANAT (b) or HIOMT (c). Lanes: 1–3 (b) and 1–3 (c), transgenic lines to be tested; M, molecular marker DL 2000; P, positive control; N, negative control. Gene expression levels of AANAT (d) and HIOMT (e). Melatonin content under control (f) and UV-B conditions (g). Different letters indicate significant differences based on Tukey's multiple range test (p < 0.05). WT, wild type. A1, AANAT ectopic expression line 1. A3, AANAT ectopic expression line 3. A6, AANAT ectopic expression line 6. H1, HIOMT ectopic expression line 1. H2, HIOMT ectopic expression line 2. H5, HIOMT ectopic expression line 5.
-
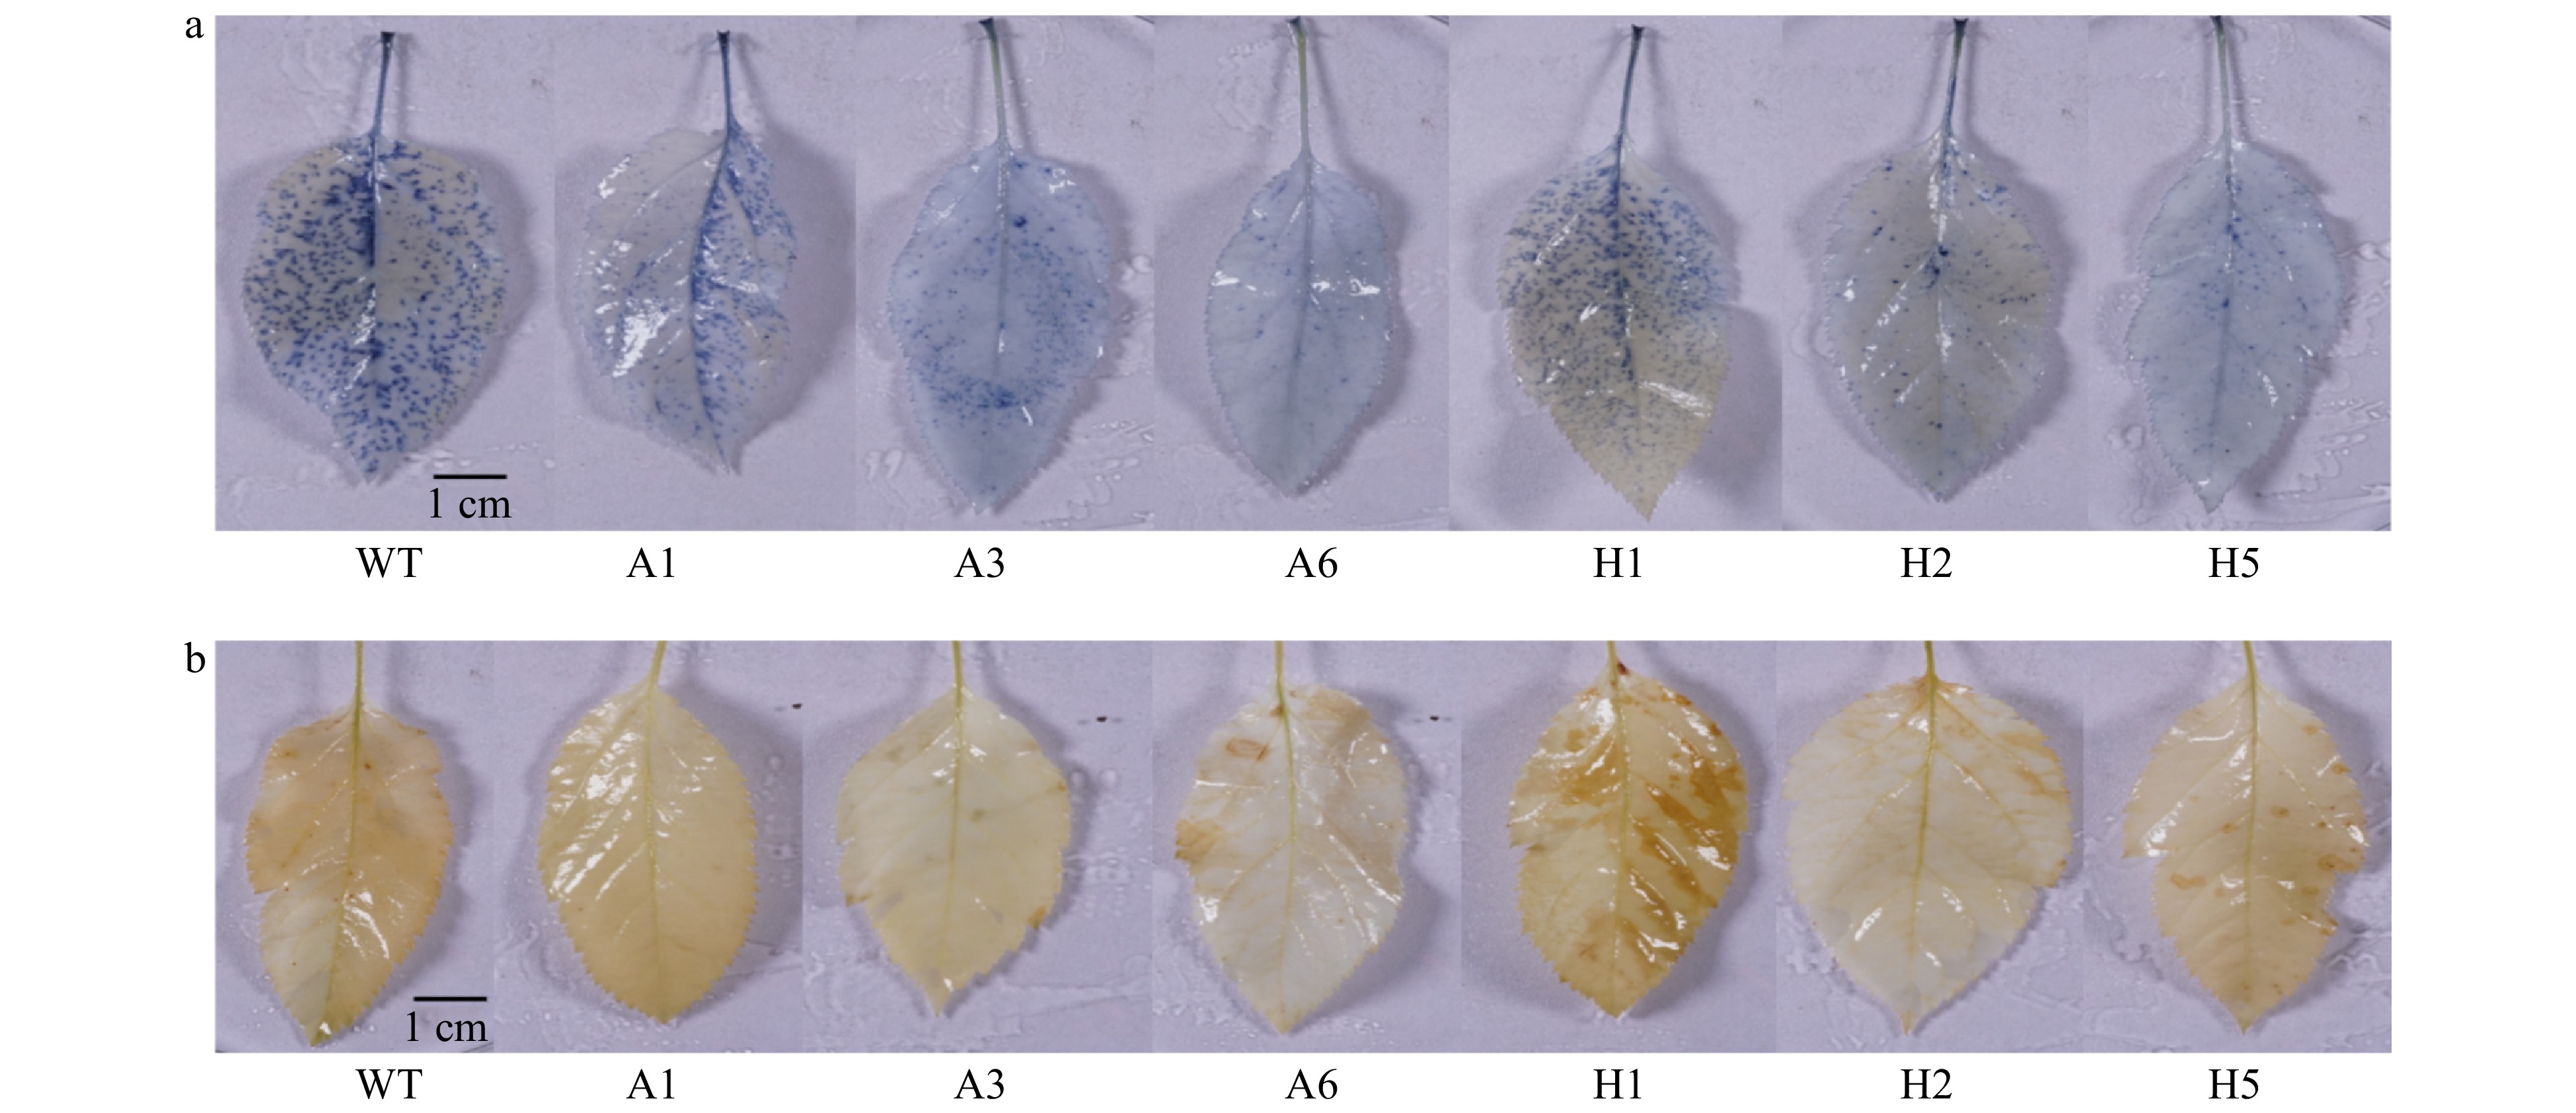
Figure 2. Chemical staining of
${{\text{O}}}_{\text{2}}^{\text{−}}$ (a) and H2O2 (b) in AANAT or HIOMT transgenic plants after UV-B treatment. WT, wild type. A1, AANAT ectopic expression line 1. A3, AANAT ectopic expression line 3. A6, AANAT ectopic expression line 6. H1, HIOMT ectopic expression line 1. H2, HIOMT ectopic expression line 2. H5, HIOMT ectopic expression line 5. -
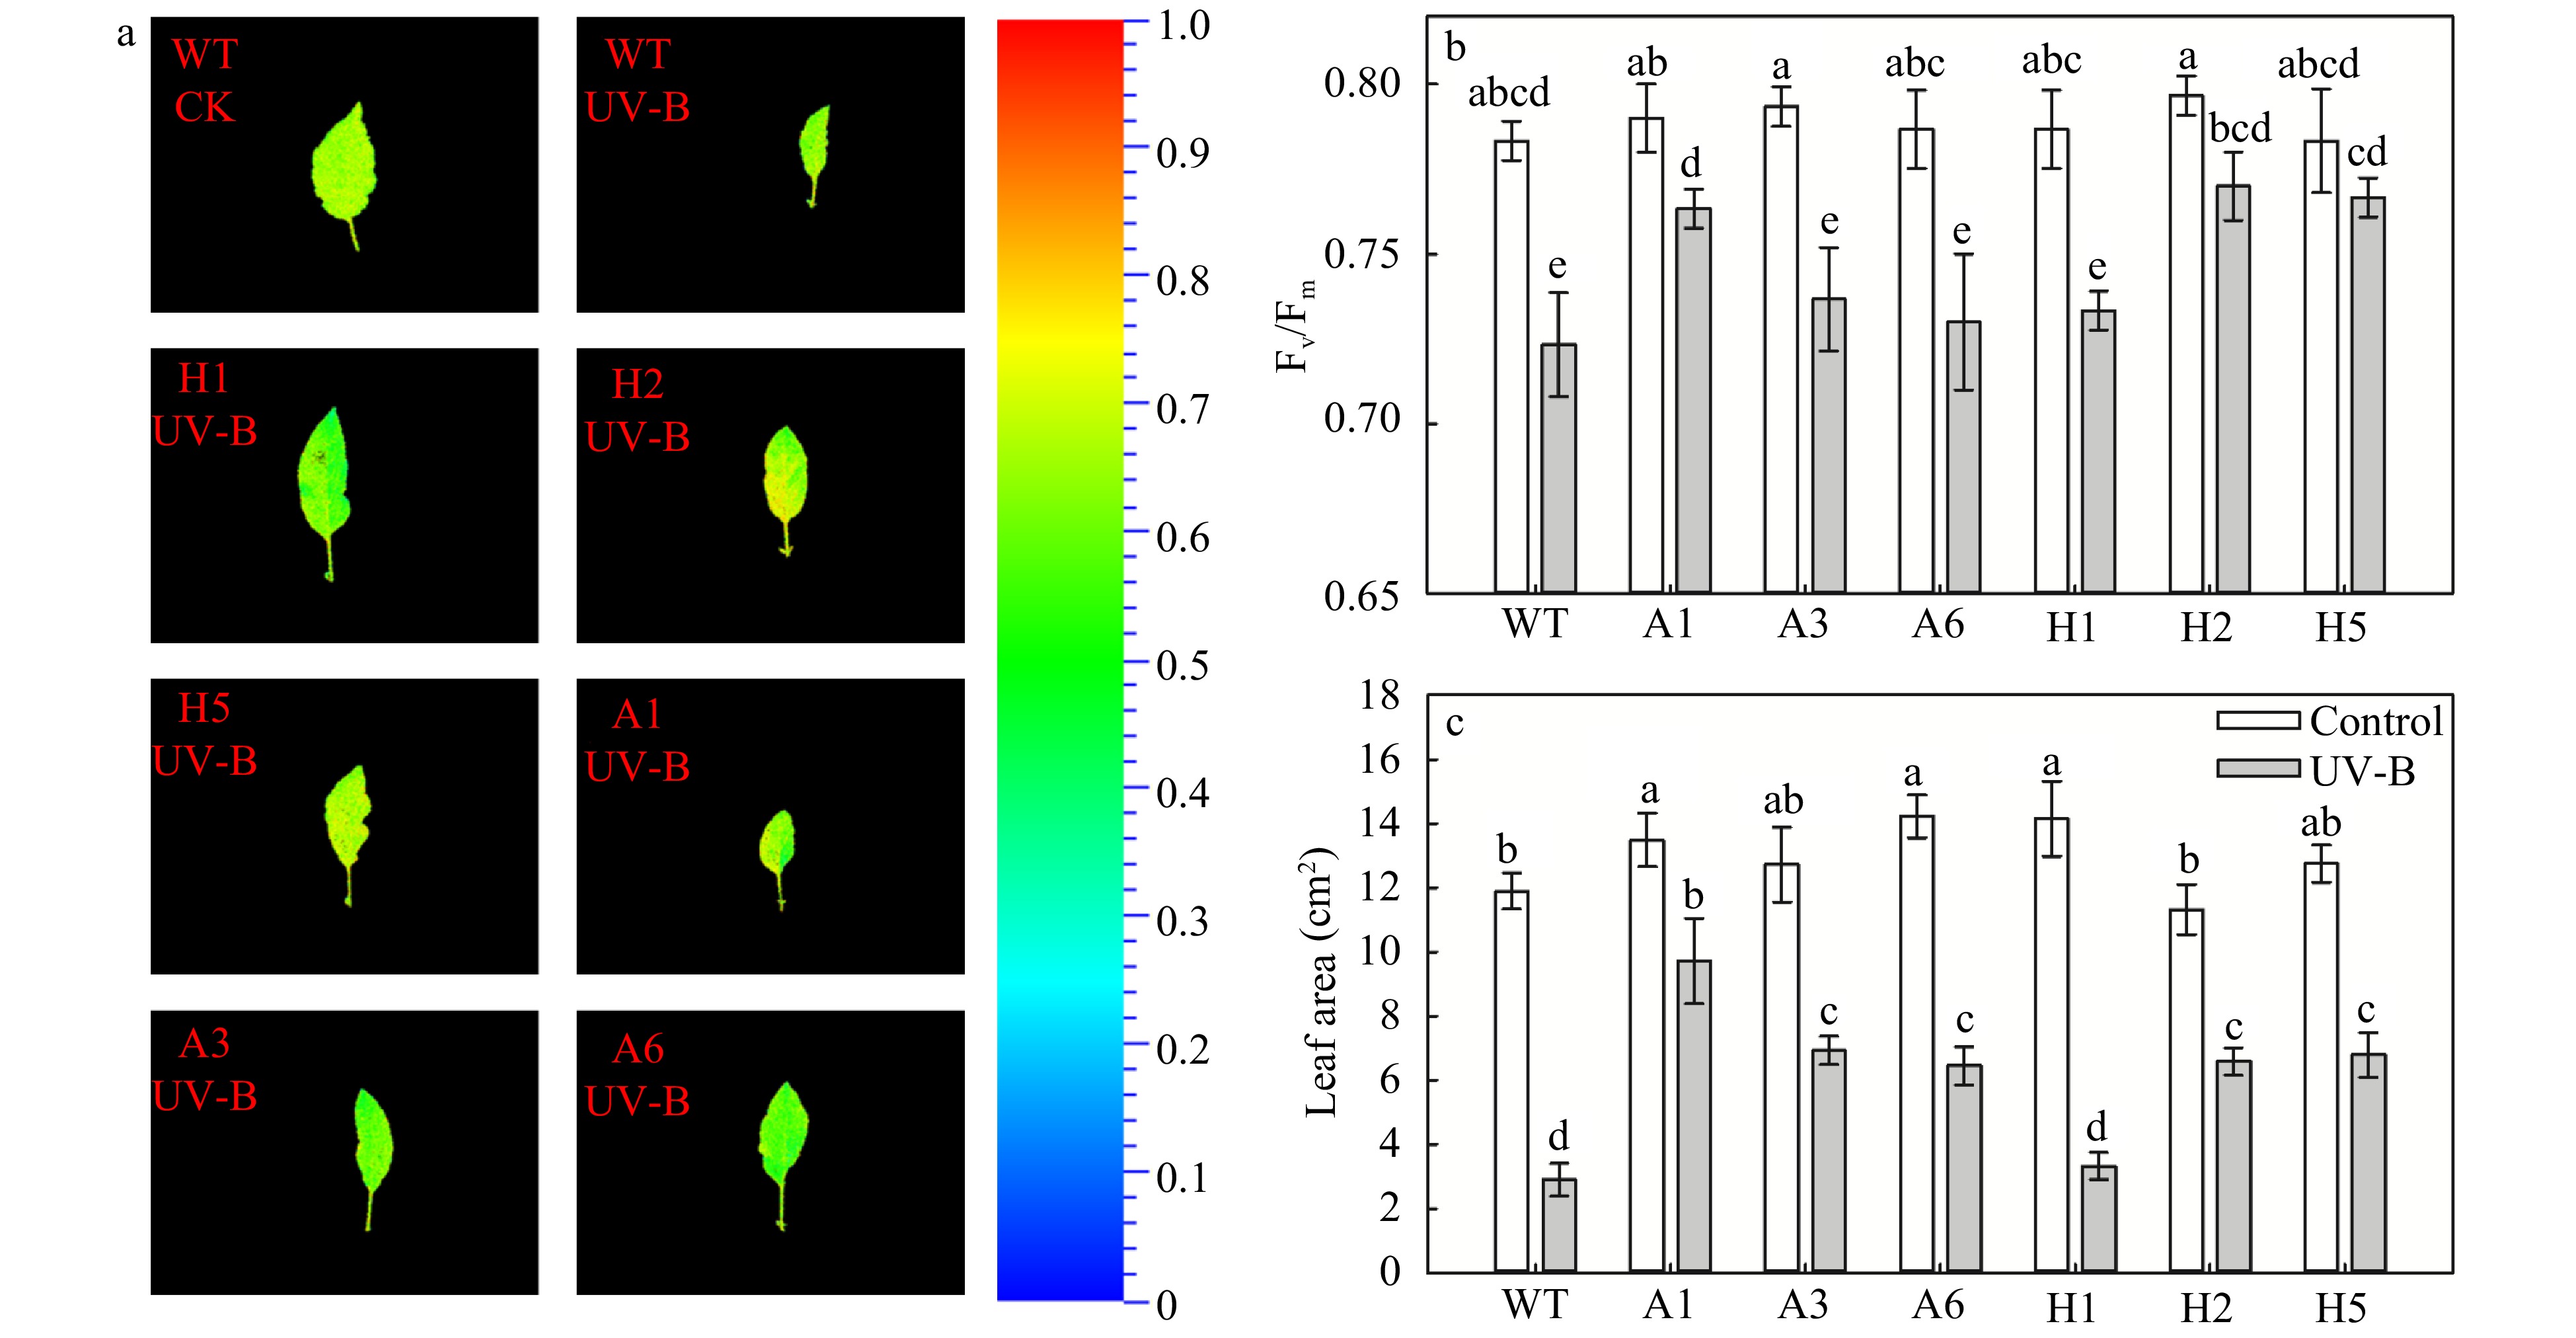
Figure 3. Analysis of chlorophyll fluorescence images (a), Fv/Fm (b), and leaf area (c) in AANAT or HIOMT transgenic plants after UV-B treatment. Different letters indicate significant differences based on Tukey's multiple range test (p < 0.05). WT, wild type. A1, AANAT ectopic expression line 1. A3, AANAT ectopic expression line 3. A6, AANAT ectopic expression line 6. H1, HIOMT ectopic expression line 1. H2, HIOMT ectopic expression line 2. H5, HIOMT ectopic expression line 5.
-
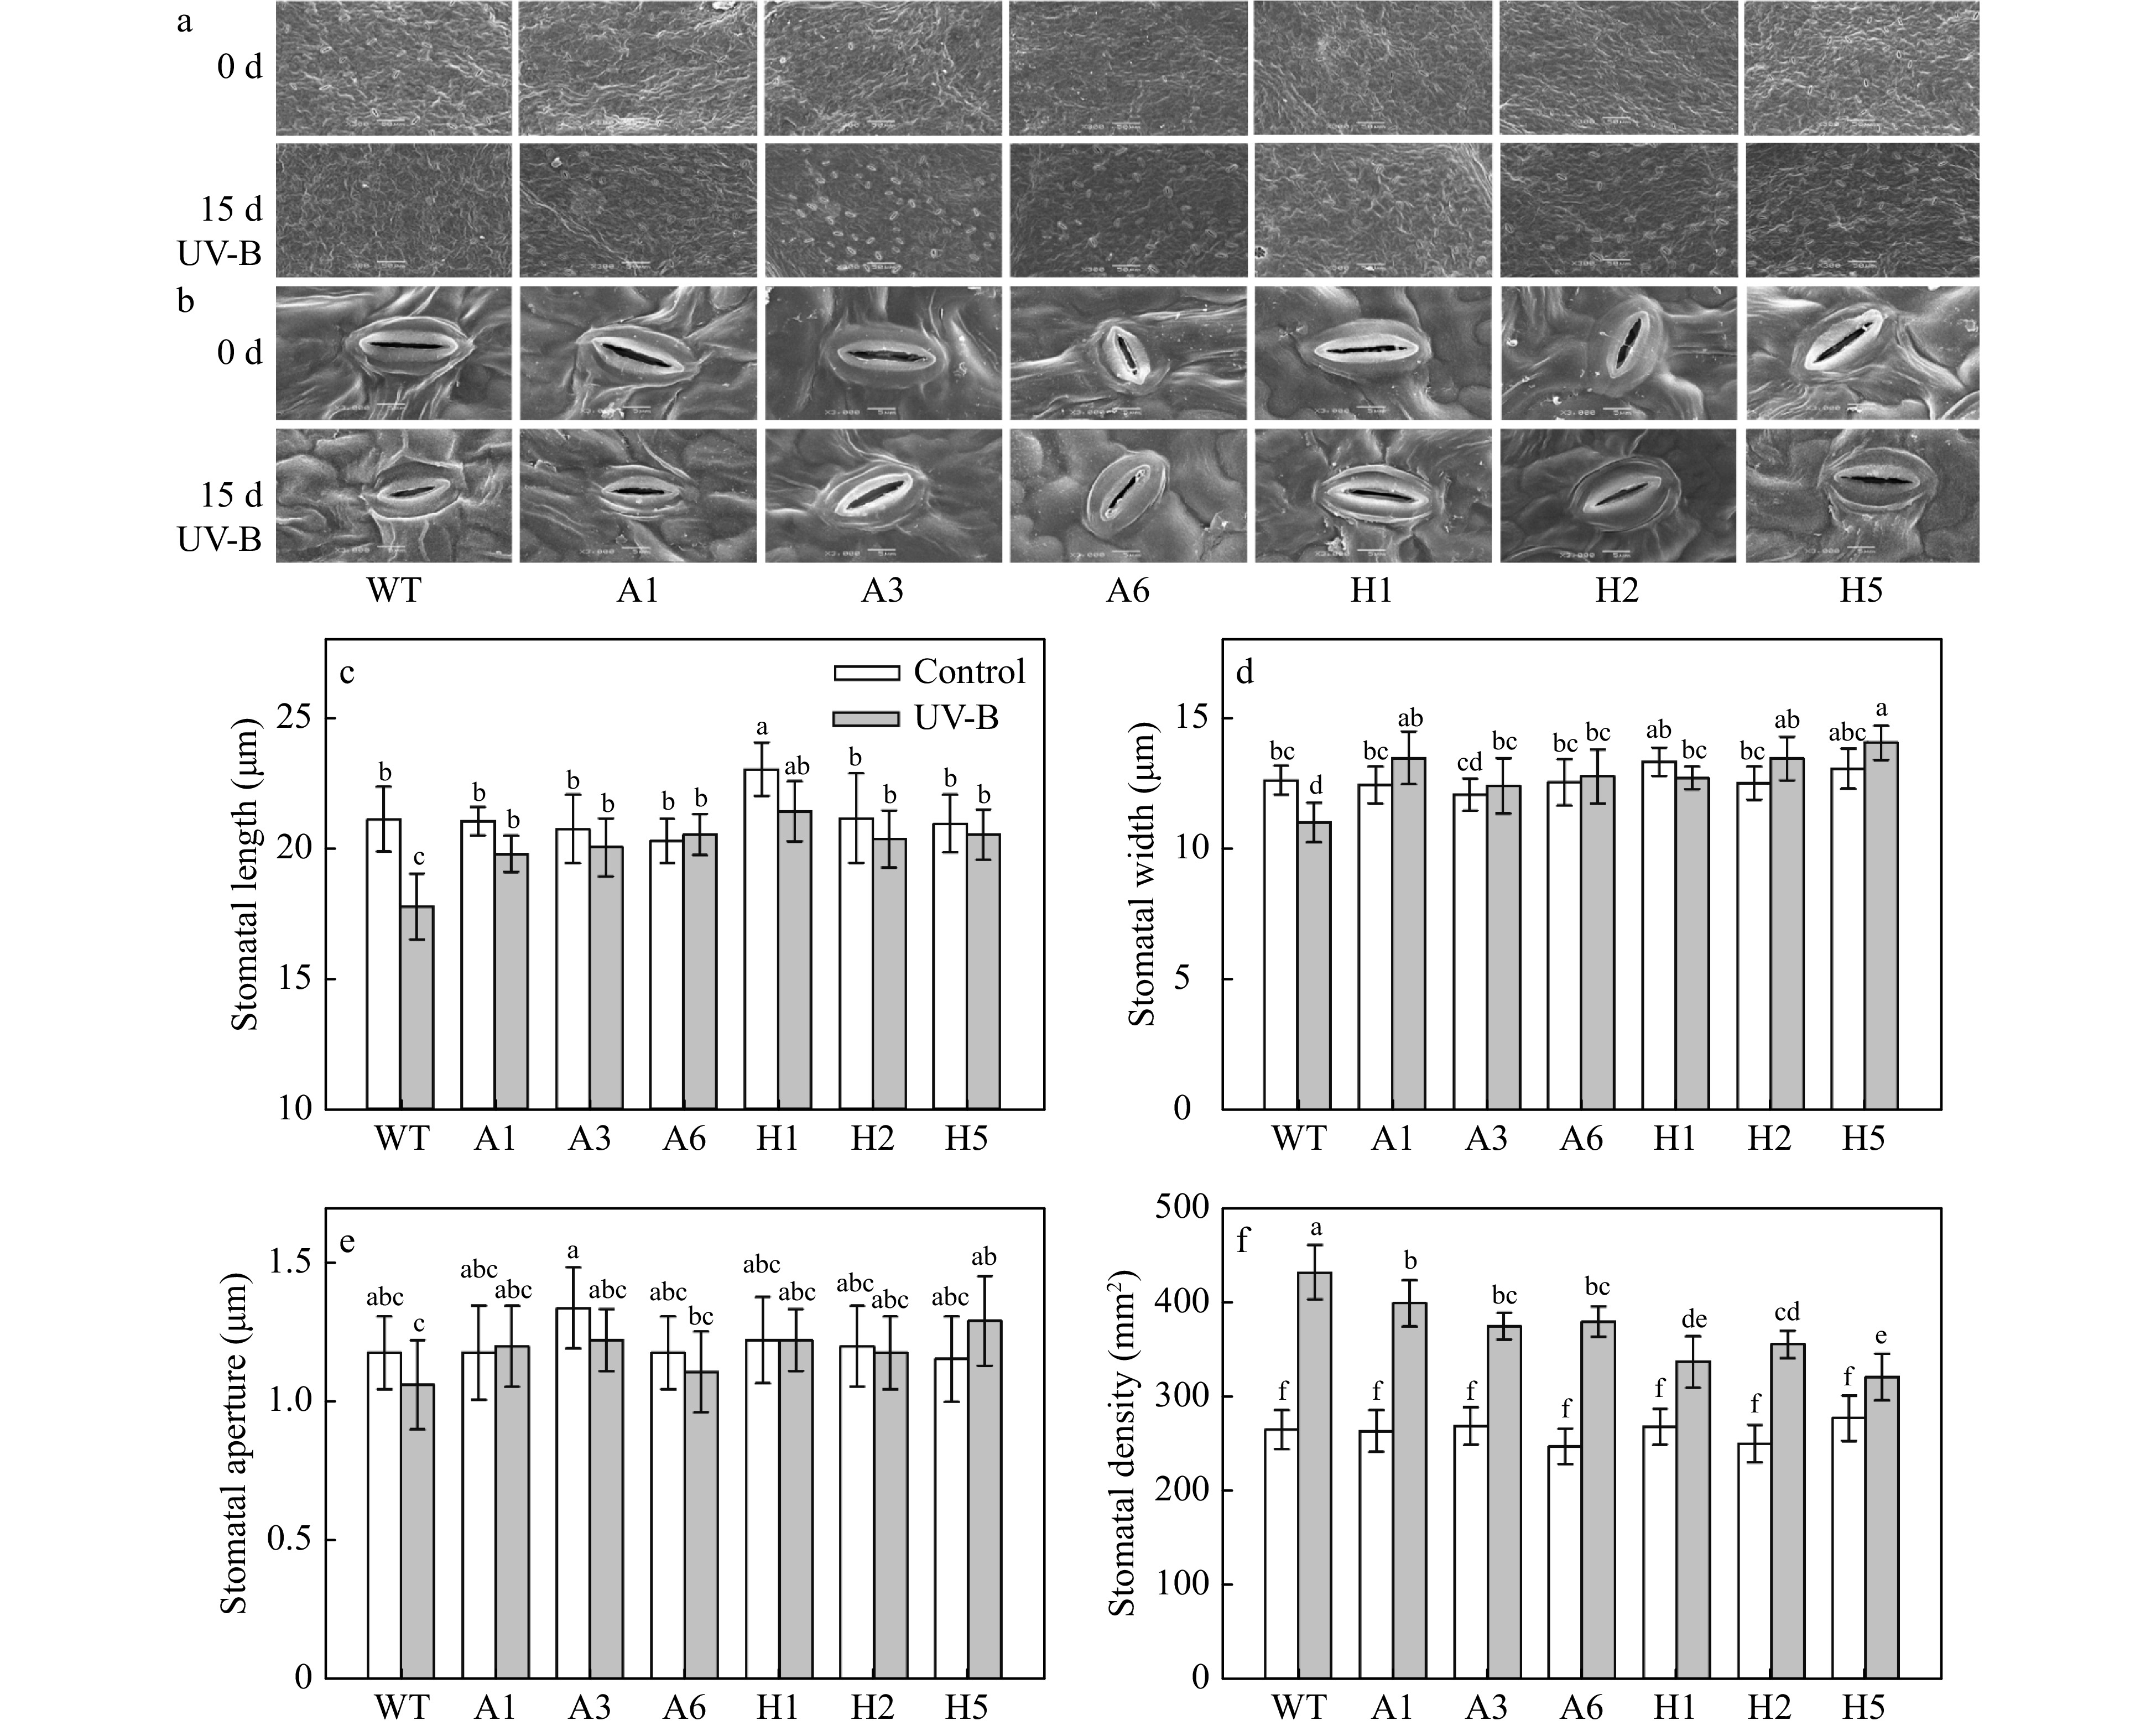
Figure 4. SEM images (a, 300×; b, 3,000×) and properties (c–f) of stomata from transgenic plants after UV-B treatment. (c) Stomatal length, (d) stomatal width, (e) stomatal aperture and (f) stomatal density. Different letters indicate significant differences based on Tukey's multiple range test (p < 0.05). WT, wild type. A1, AANAT ectopic expression line 1. A3, AANAT ectopic expression line 3. A6, AANAT ectopic expression line 6. H1, HIOMT ectopic expression line 1. H2, HIOMT ectopic expression line 2. H5, HIOMT ectopic expression line 5.
-
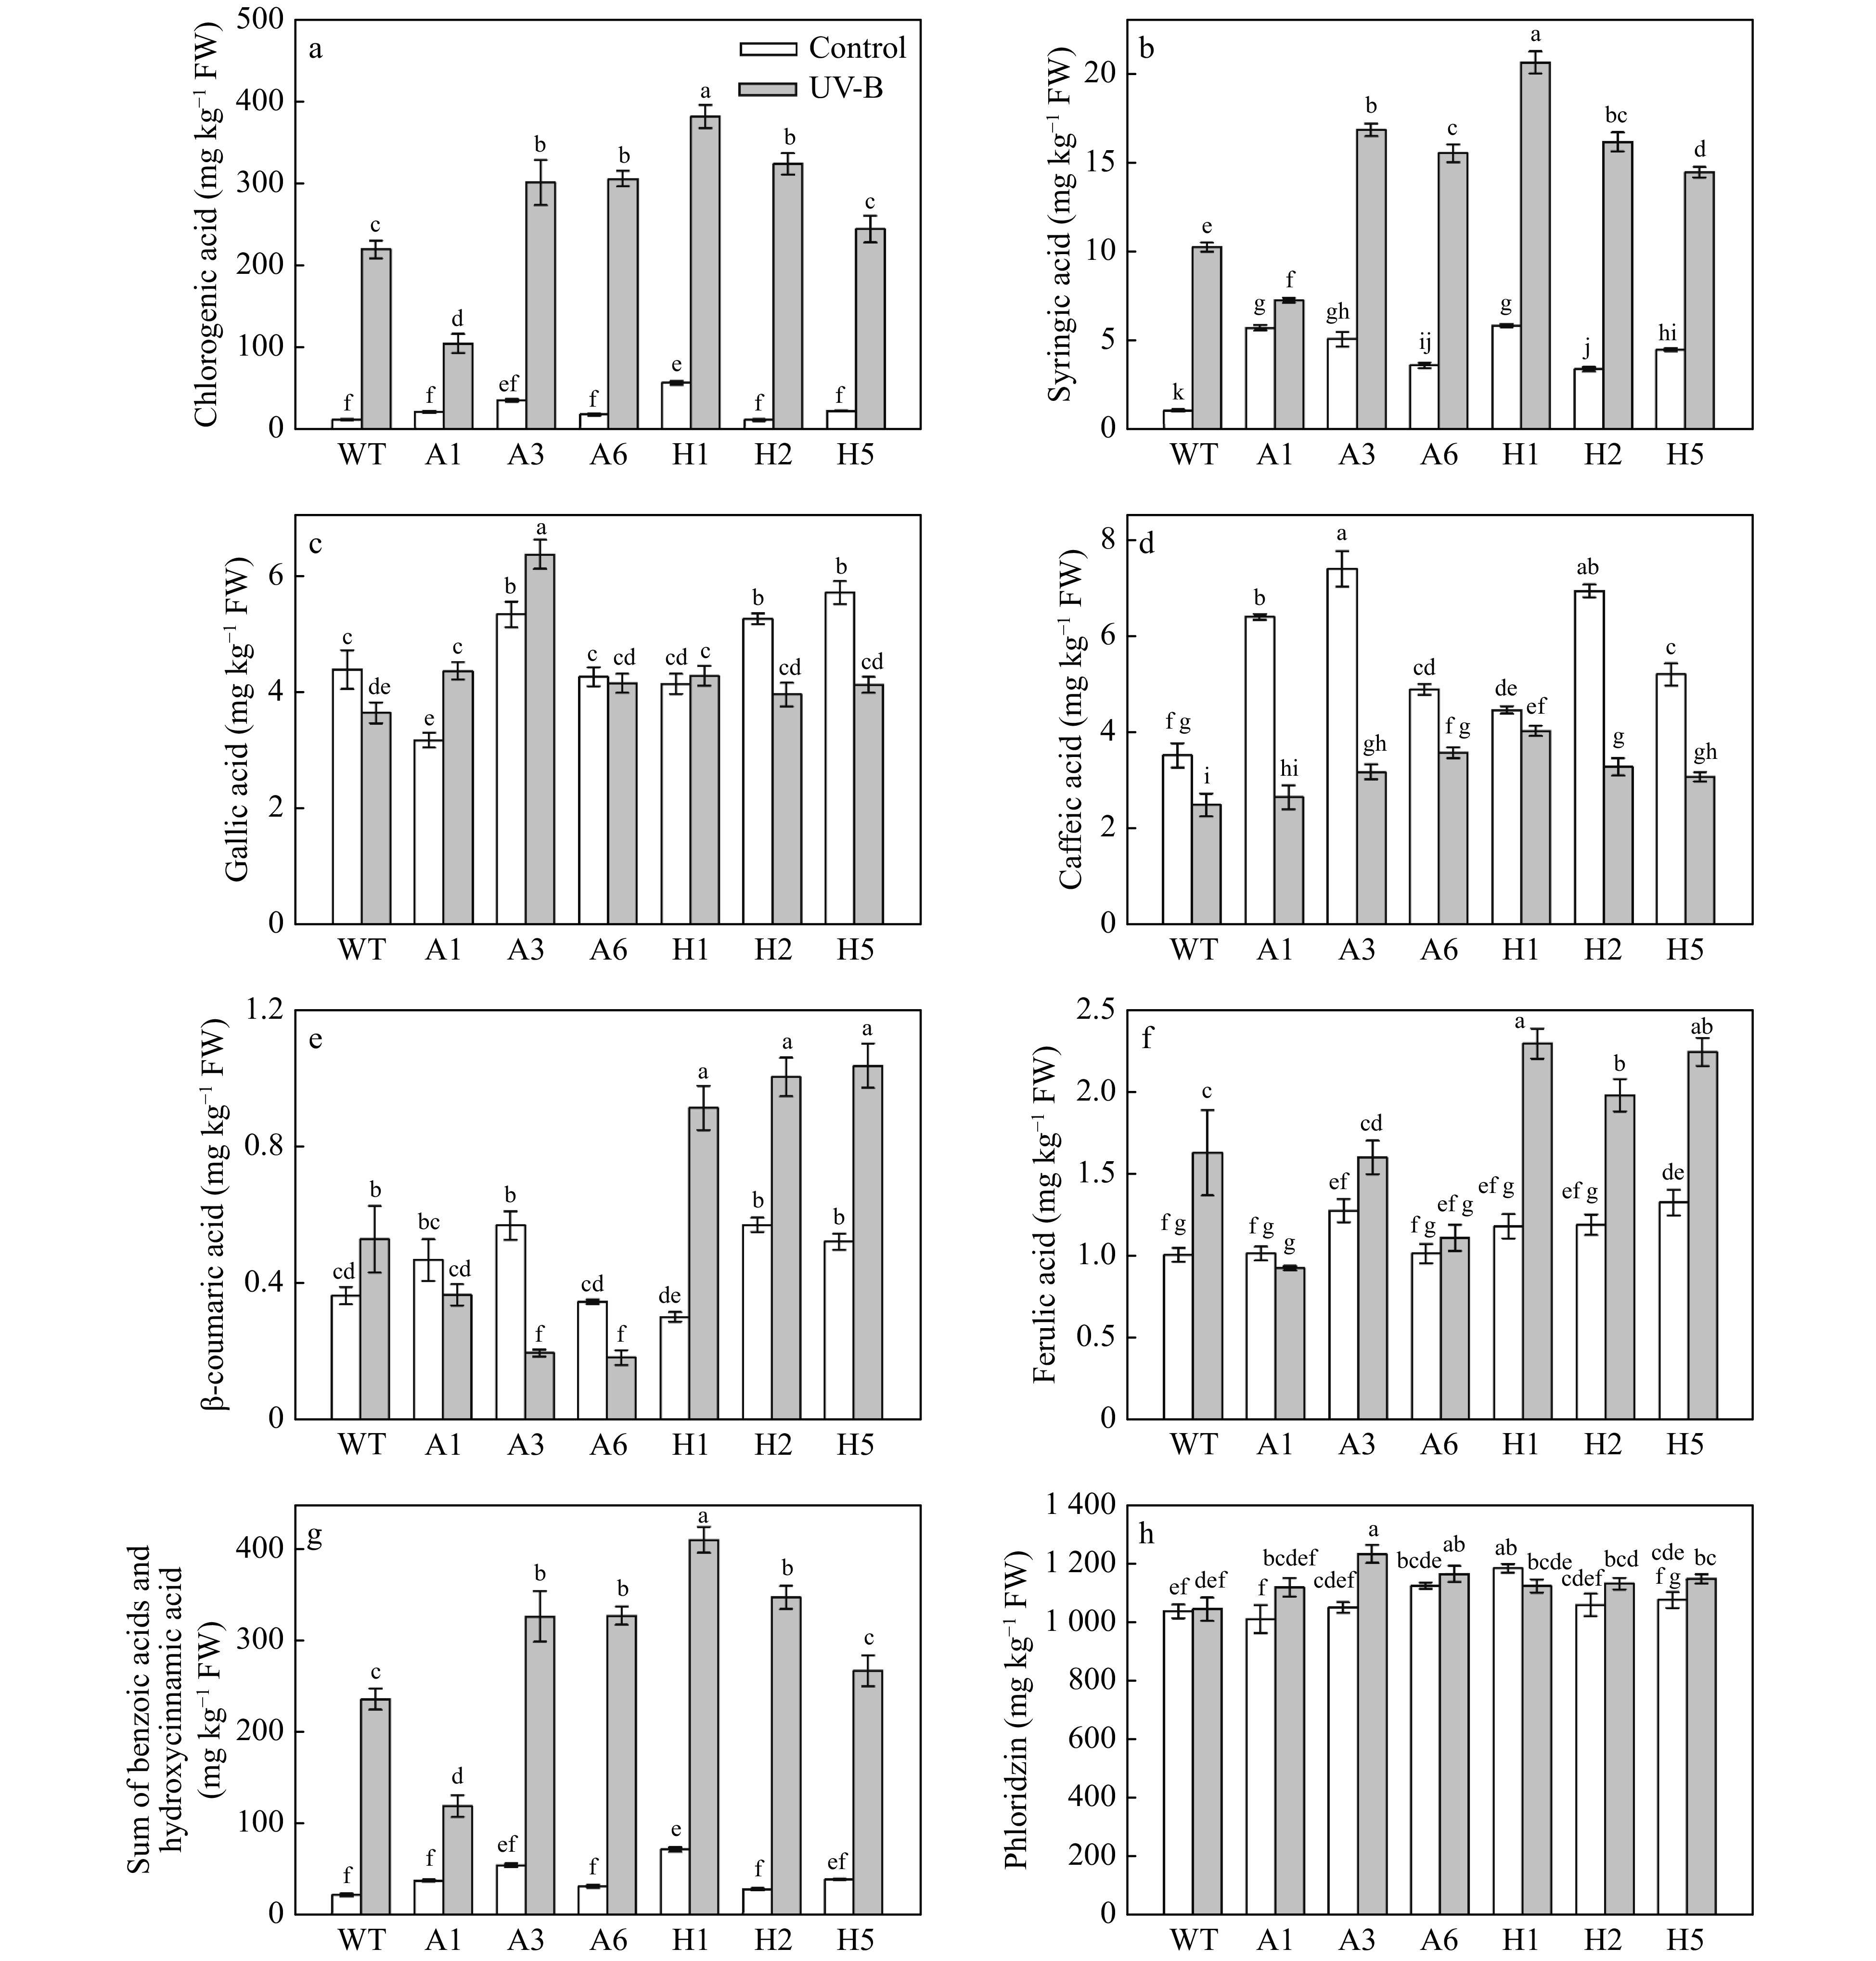
Figure 5. Analysis of benzoic acids, hydroxycinnamic acids and phloridzin in AANAT or HIOMT transgenic apple leaves after UV-B treatment. (a) Chlorogenic acid, (b) syringic acid, (c) gallic acid, (d) caffeic acid, (e) β-coumaric acid, (f) ferulic acid, (g) sum of benzoic acids and hydroxycinnamic acids and (h) phloridzin. Different letters indicate significant differences based on Tukey's multiple range test (p < 0.05). WT, wild type. A1, AANAT ectopic expression line 1. A3, AANAT ectopic expression line 3. A6, AANAT ectopic expression line 6. H1, HIOMT ectopic expression line 1. H2, HIOMT ectopic expression line 2. H5, HIOMT ectopic expression line 5.
-
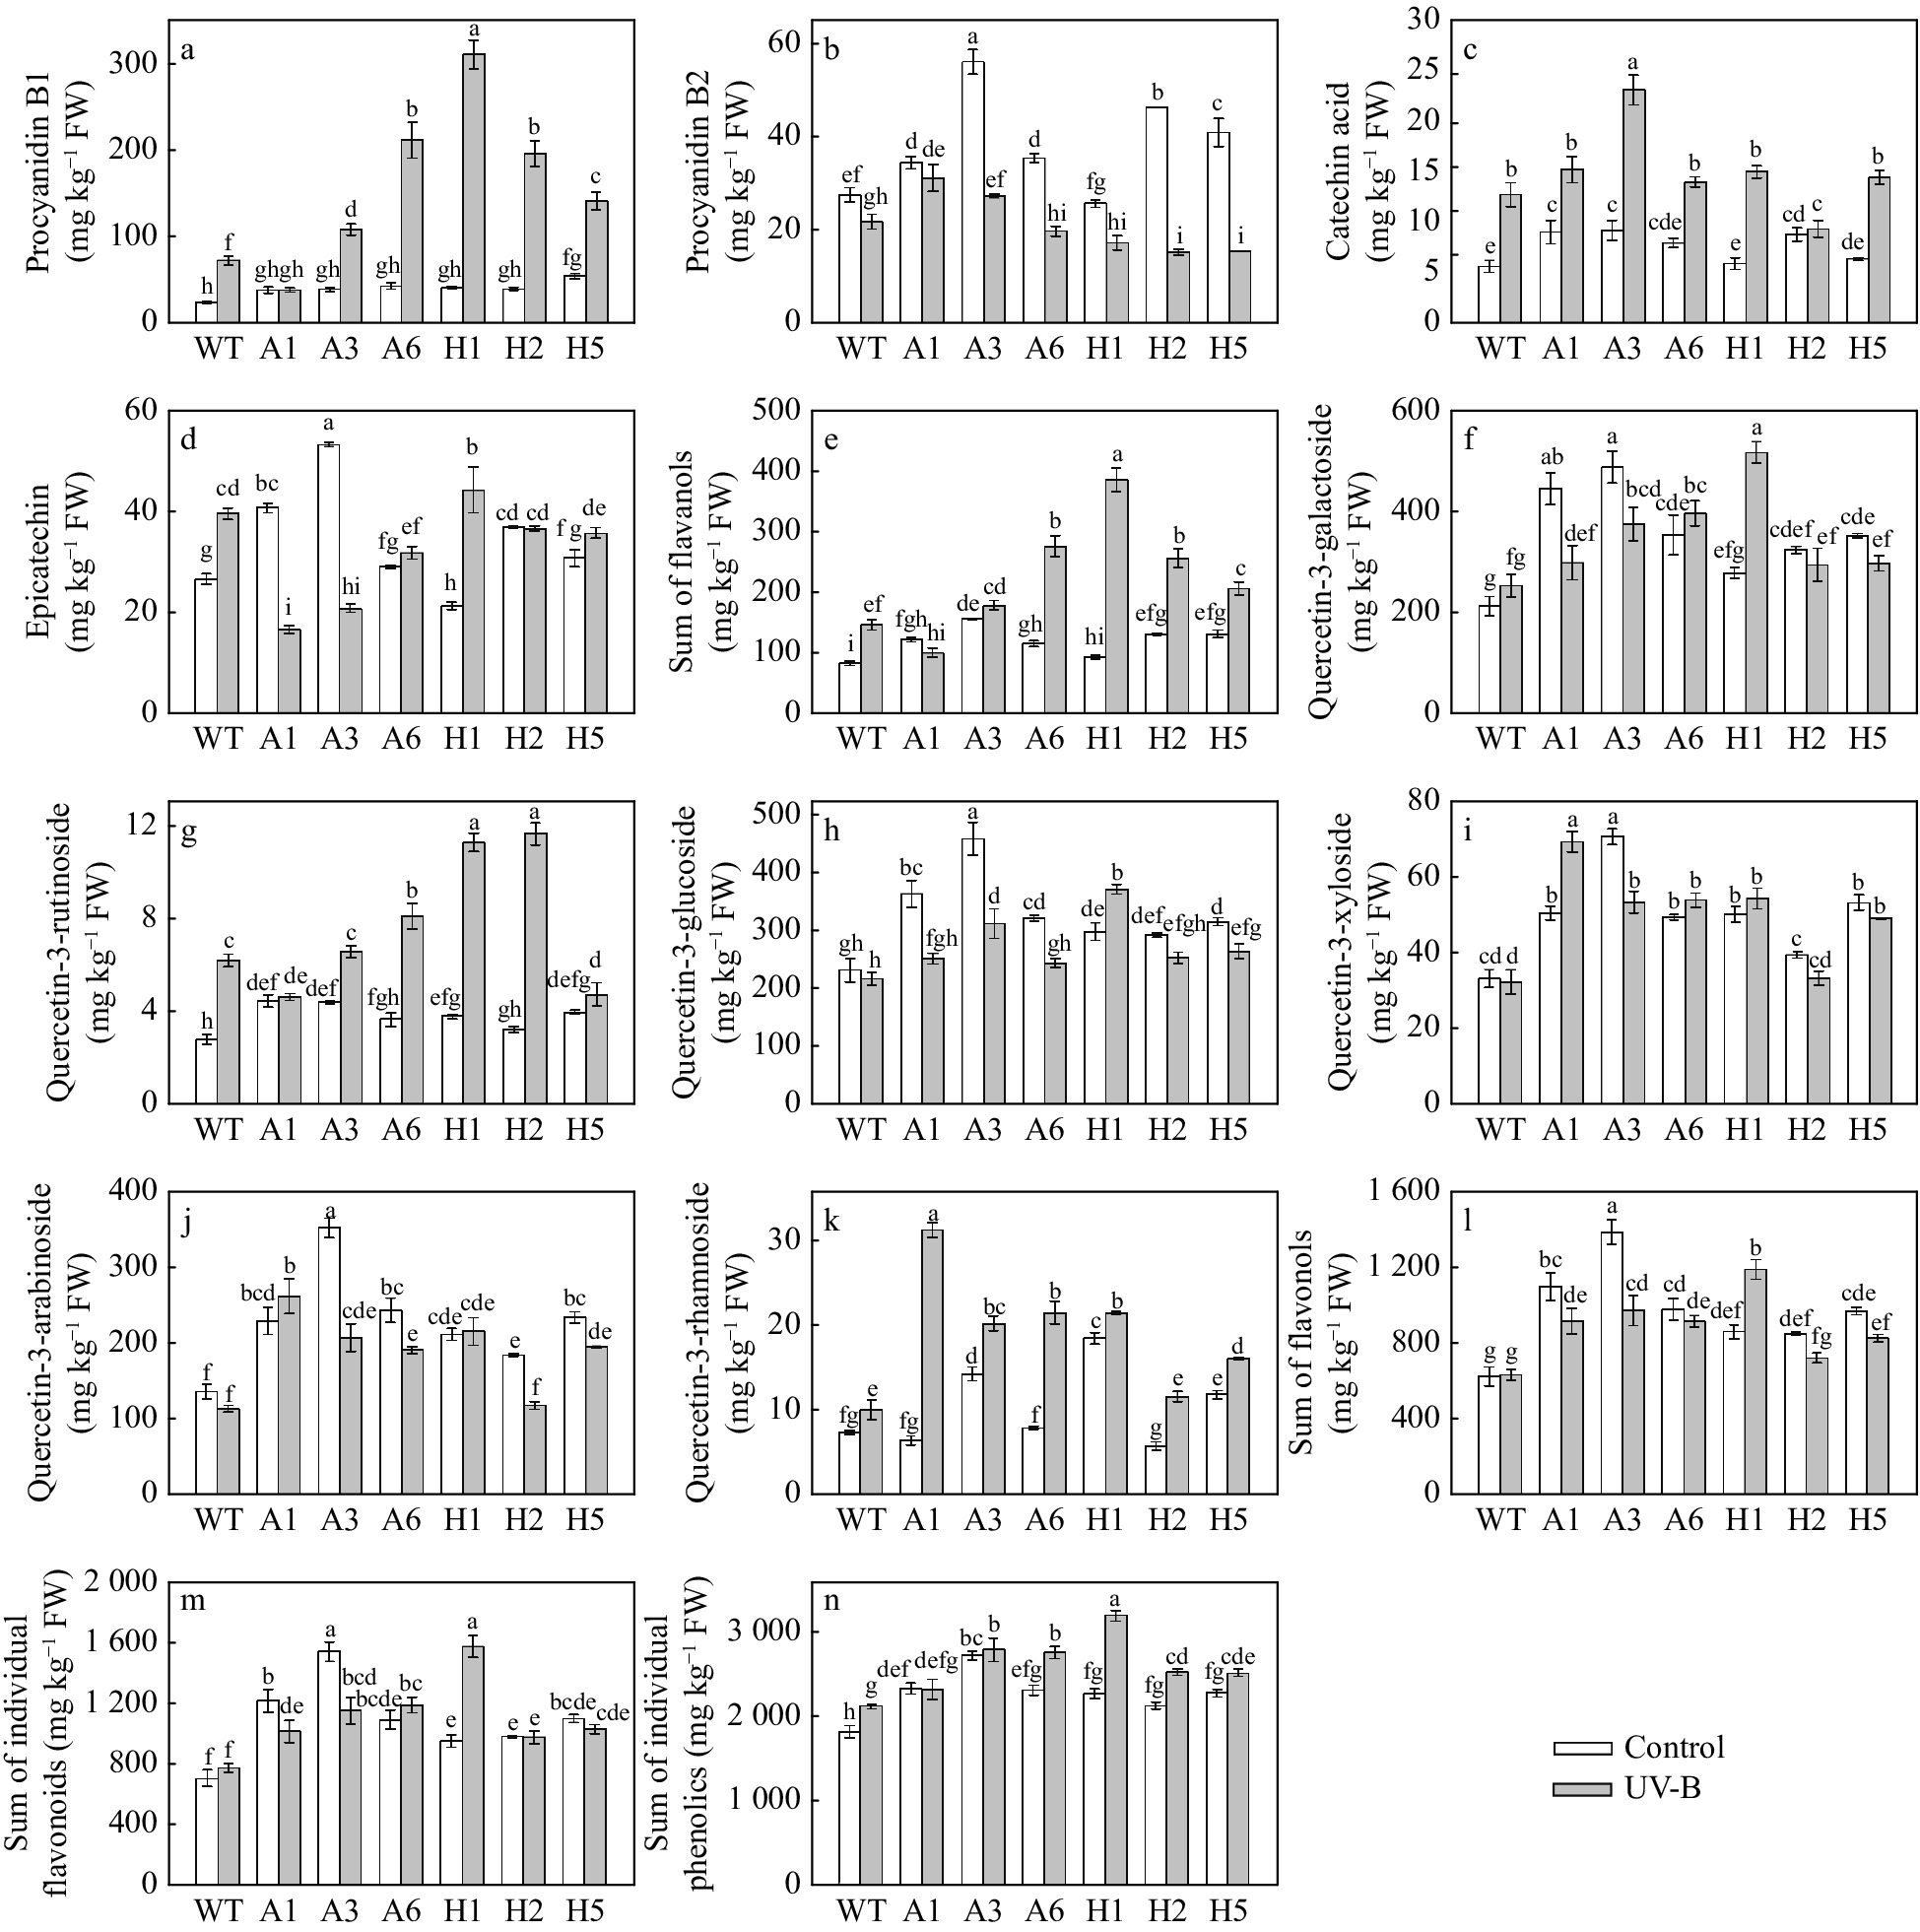
Figure 6. Analysis of flavanols, flavonols and sum of individual phenolics in AANAT or HIOMT transgenic apple leaves after UV-B treatment. (a) Procyanidin B1, (b) procyanidin B2, (c) catechin acid, (d) epicatechin, (e) sum of flavanols, (f) quercetin-3-galactoside, (g) quercetin-3-rutinoside, (h) quercetin-3-glucoside, (i) quercetin-3-xyloside, (j) quercetin-3-arabinoside, (k) quercetin-3-rhamnoside, (l) sum of flavonols, (m) sum of individual flavonoids and (n) sum of individual phenolics. Different letters indicate significant differences based on Tukey's multiple range test (P < 0.05). WT, wild type. A1, AANAT ectopic expression line 1. A3, AANAT ectopic expression line 3. A6, AANAT ectopic expression line 6. H1, HIOMT ectopic expression line 1. H2, HIOMT ectopic expression line 2. H5, HIOMT ectopic expression line 5.
-
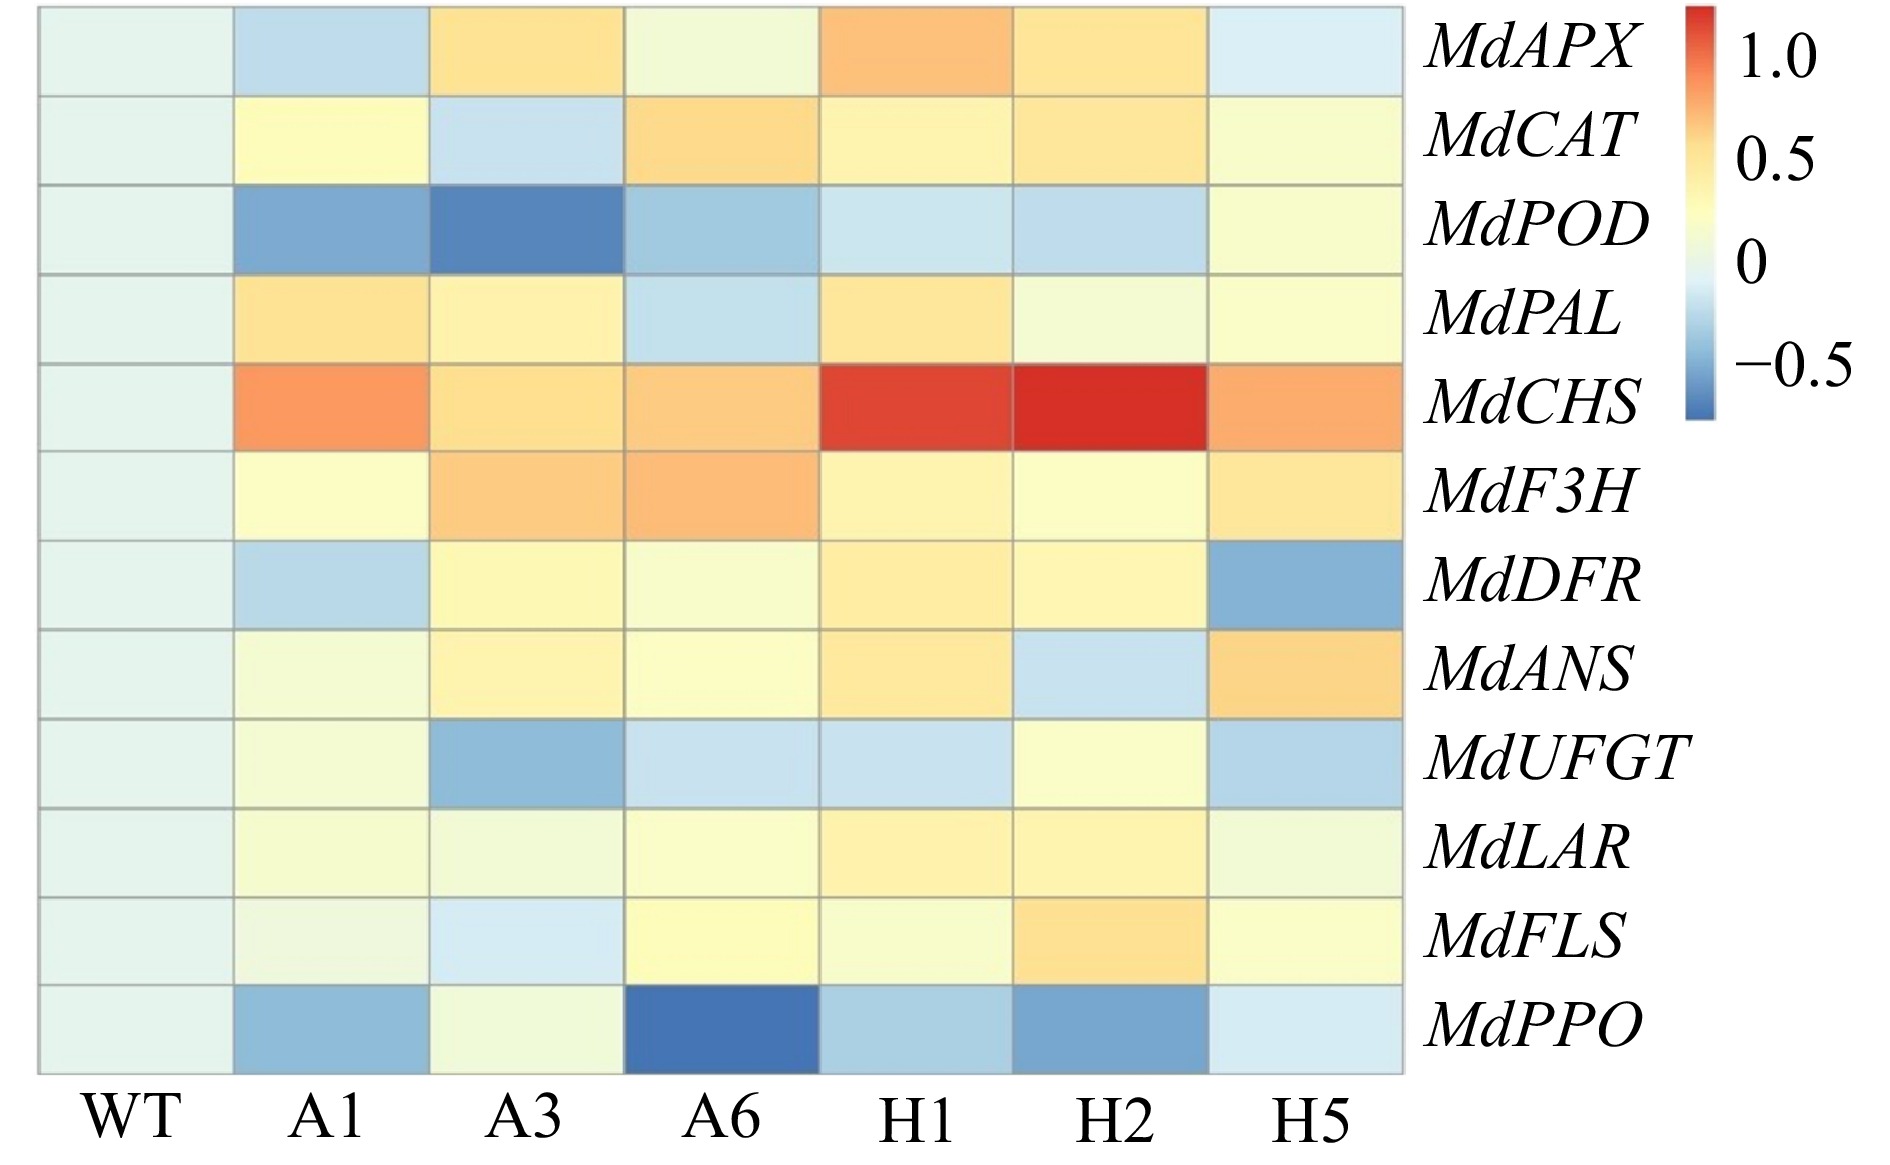
Figure 7. Heatmap showing transcripts of 3 antioxidant enzyme-related genes (MdAPX MdCAT and MdPOD) and 9 phenolic metabolism enzyme-related genes (MdPAL, MdCHS, MdF3H, MdDFR, MdANS, MdUFGT, MdLAR, MdFLS and MdPPO) in AANAT or HIOMT transgenic apple leaves after UV-B treatment. WT, wild type. A1, AANAT ectopic expression line 1. A3, AANAT ectopic expression line 3. A6, AANAT ectopic expression line 6. H1, HIOMT ectopic expression line 1. H2, HIOMT ectopic expression line 2. H5, HIOMT ectopic expression line 5.
-
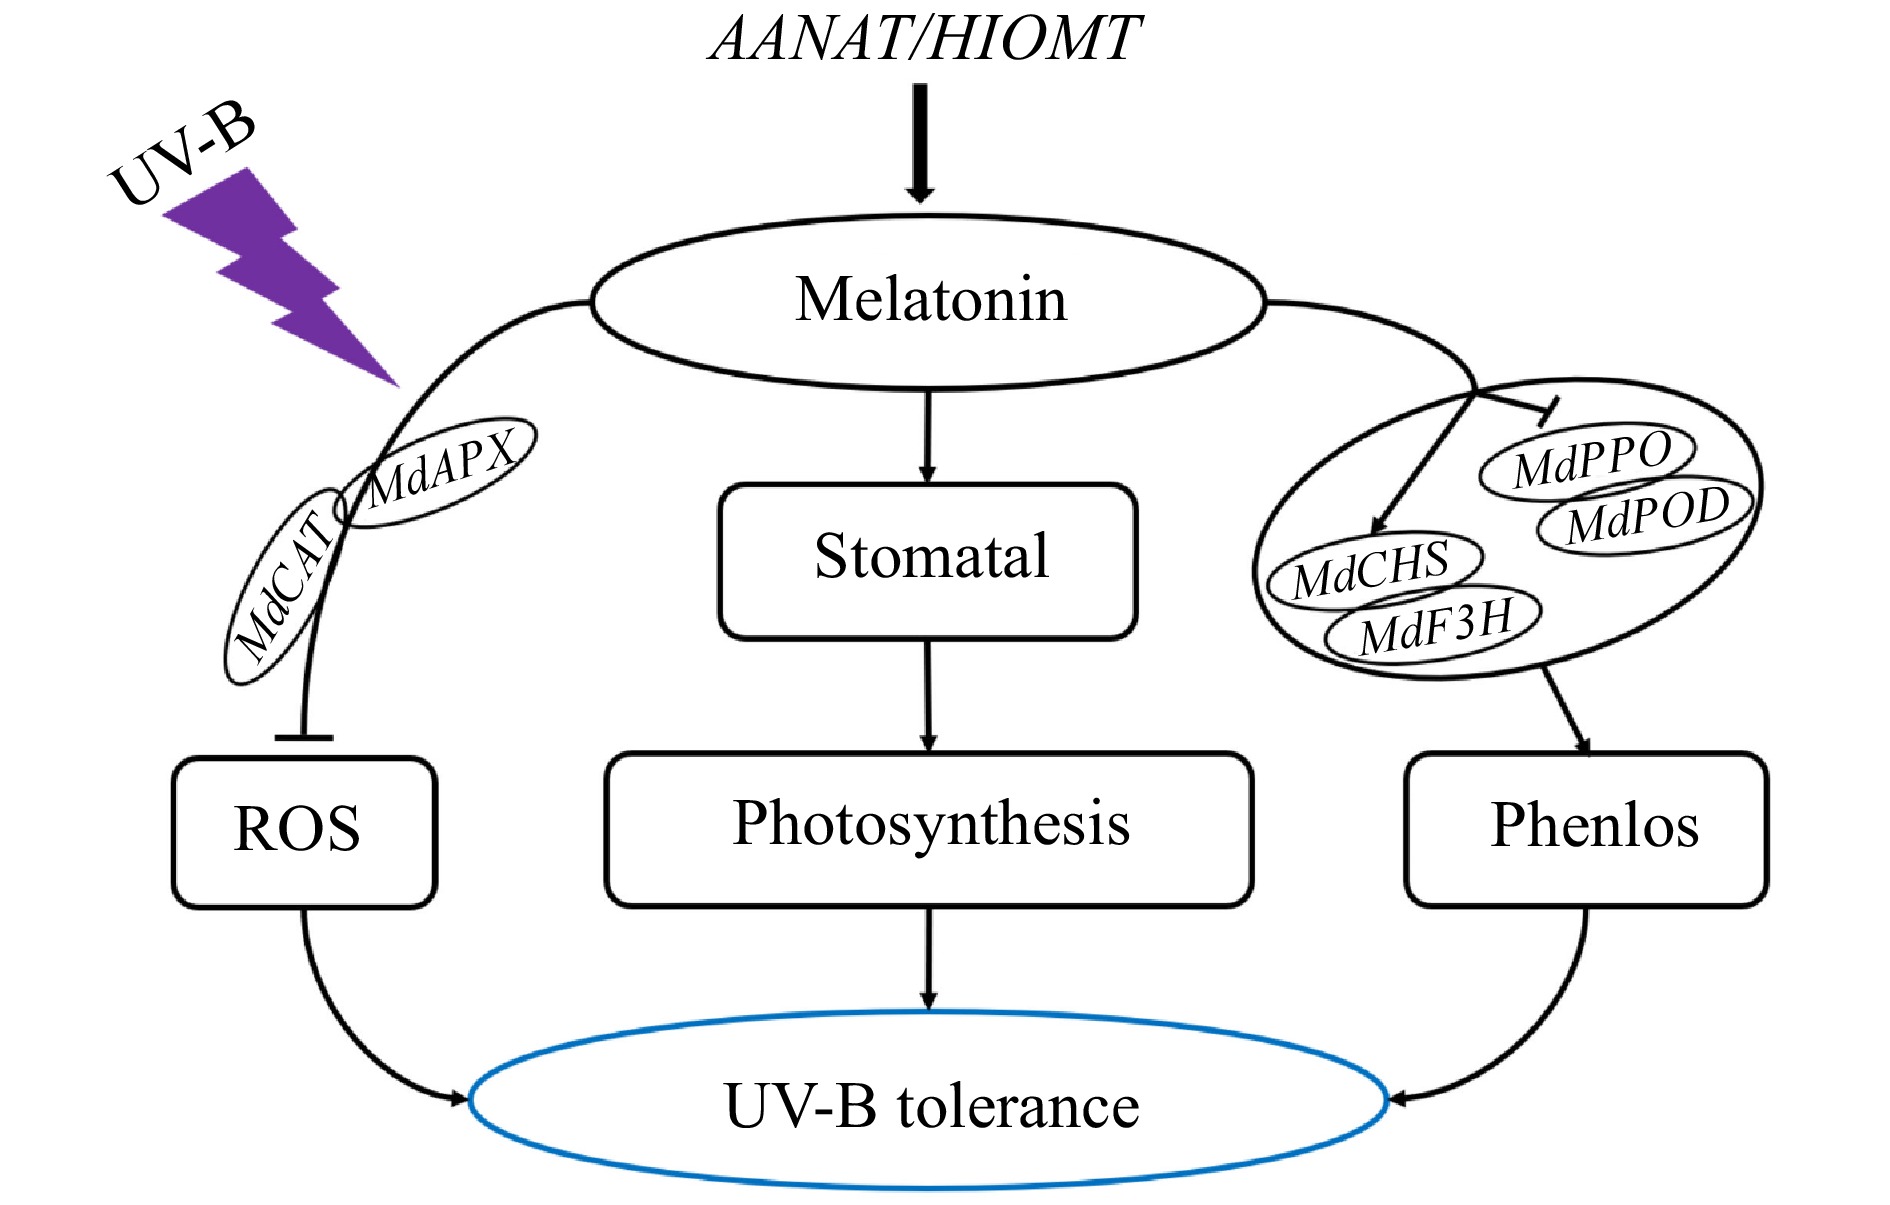
Figure 8. A model of the regulatory effect of AANAT or HIOMT on apple's UV-B stress response. Under UV-B stress, the melatonin content of apple lines with ectopic expression of AANAT or HIOMT was significantly increased. Thus, the expression of antioxidant enzyme-related genes was increased, and ROS levels were reduced; the stomatal shrinkage of transgenic lines caused by UV-B stress was alleviated, and the photosynthetic capacity was enhanced. In addition, the ectopic expression of AANAT or HIOMT not only increased the expression of genes related to phenolic synthesis but also inhibited the expression of genes related to phenolic degradation, thus increasing phenolic content. Therefore, the tolerance of transgenic apple plants to UV-B stress was improved.
Figures
(8)
Tables
(0)