-
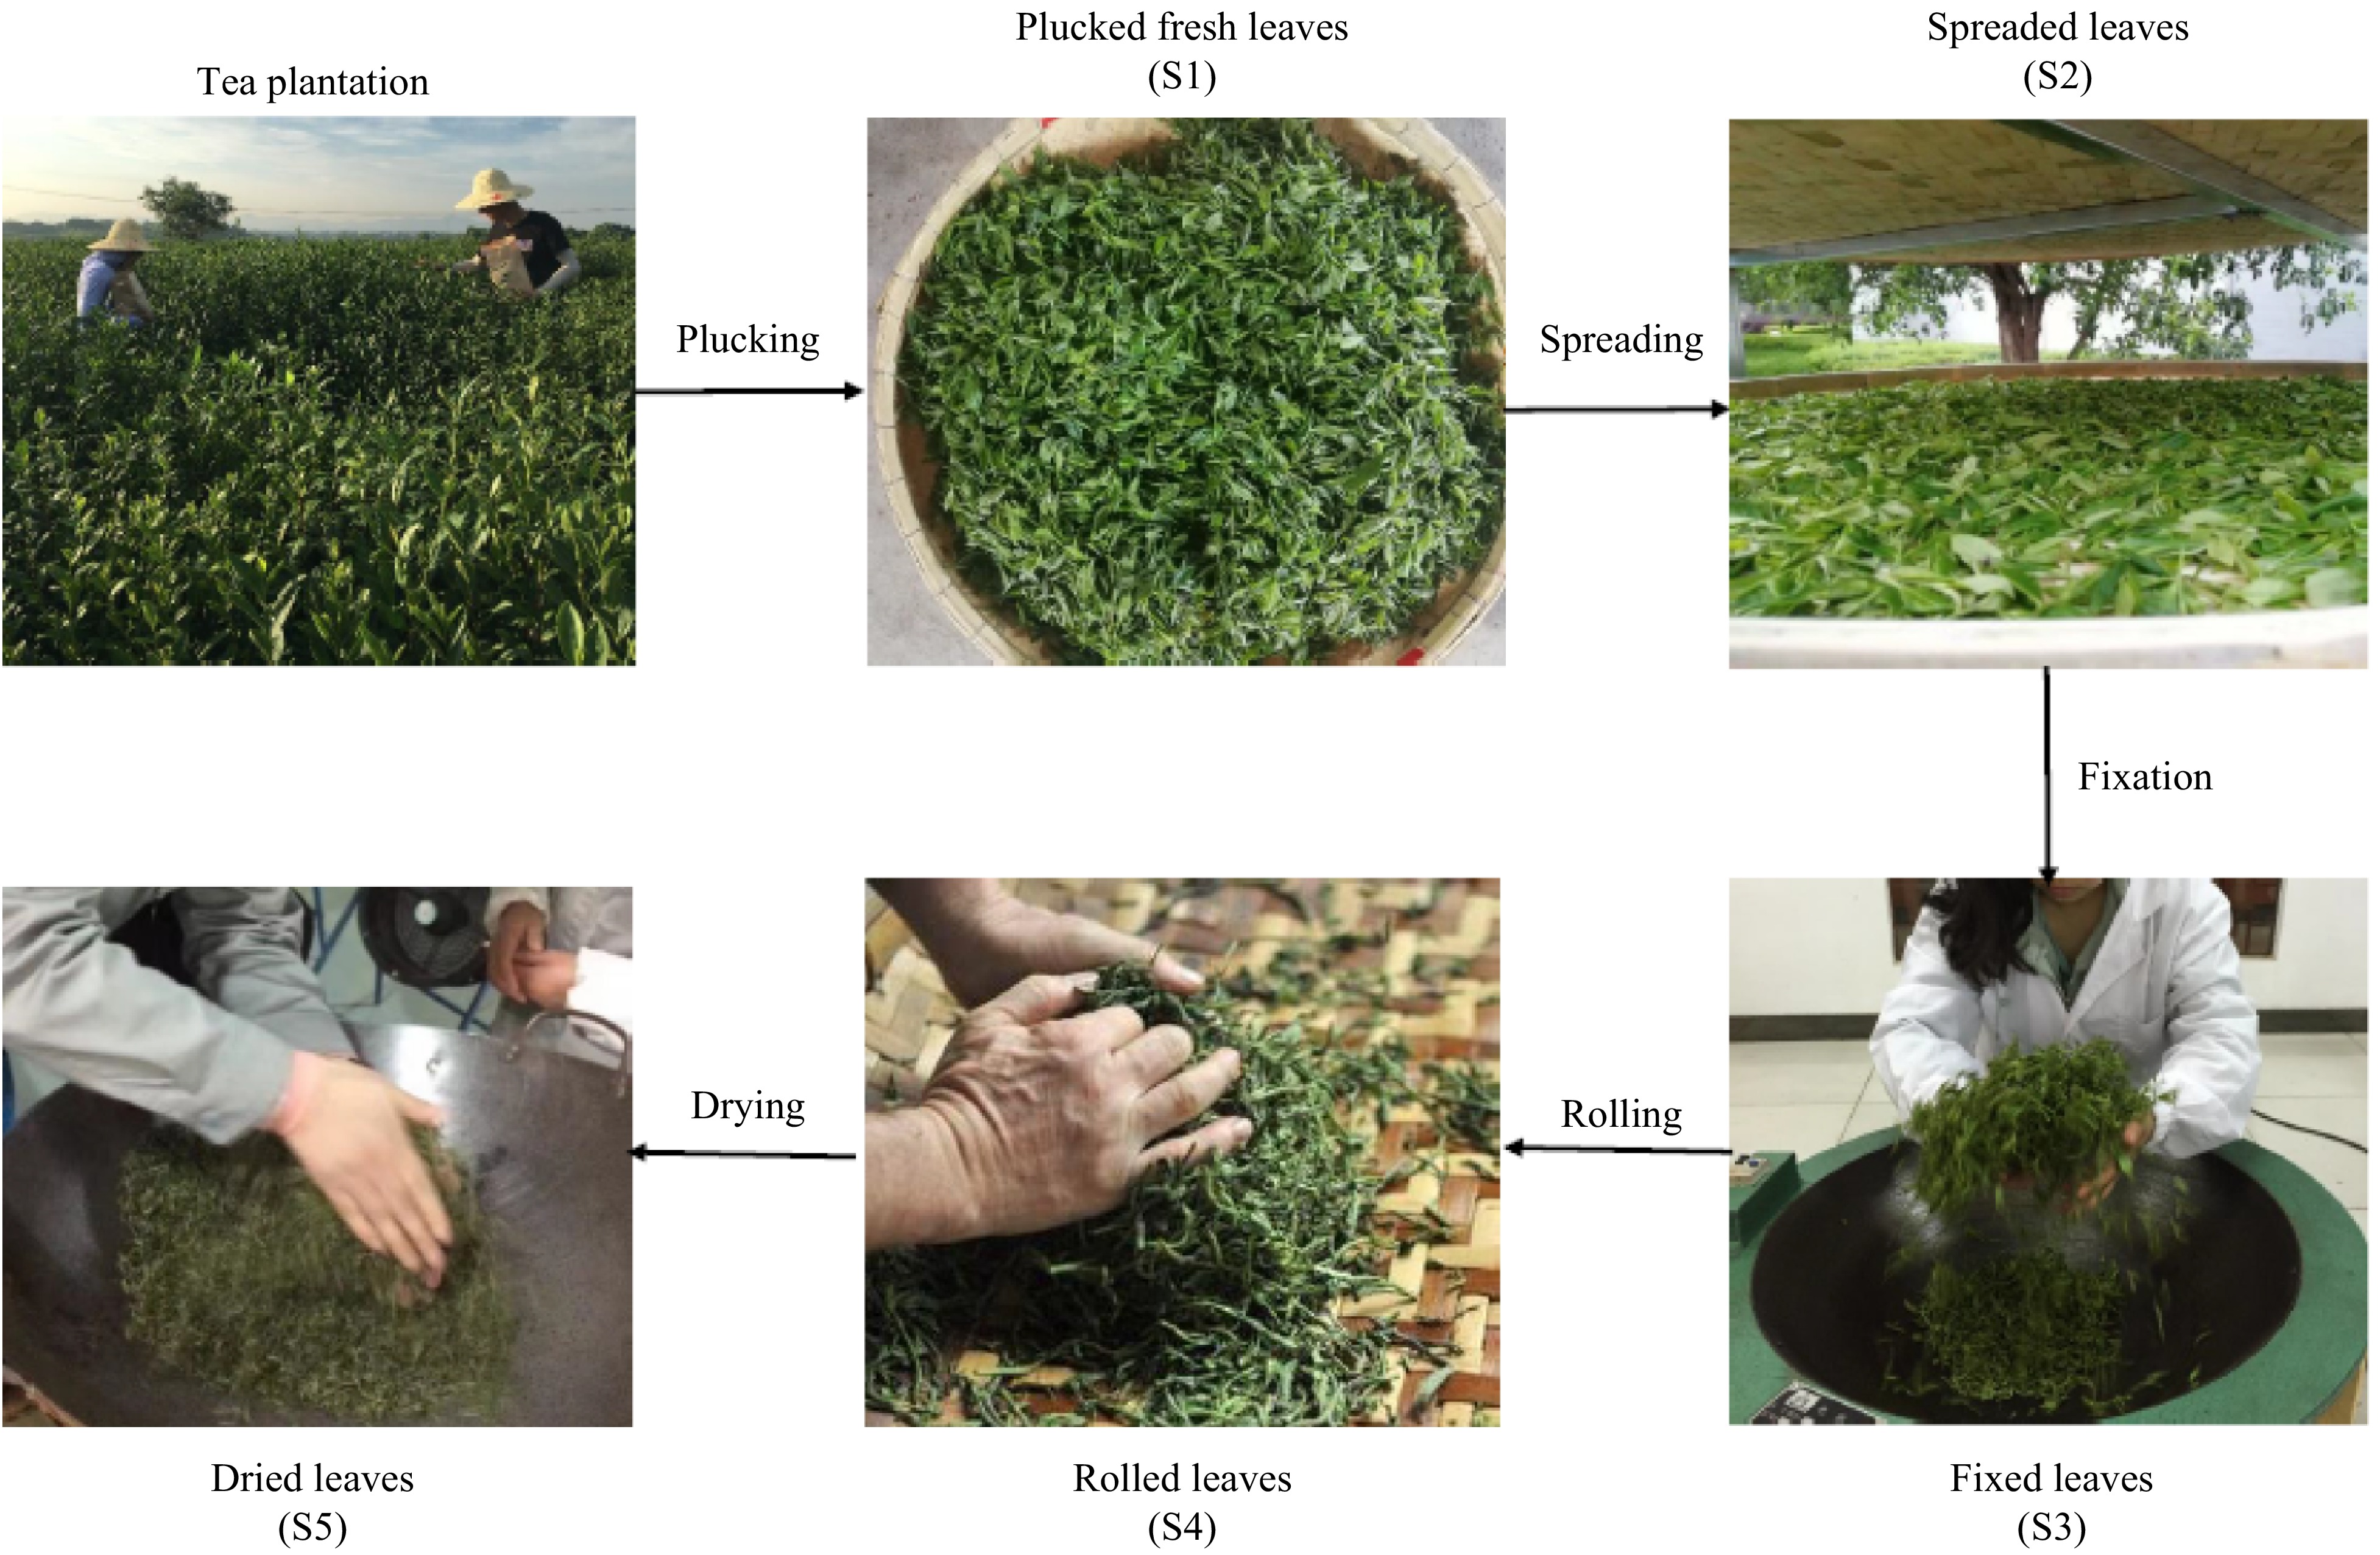
Figure 1.
The Yuhua tea (stir-fried green tea) processing of 'Yinshuang' tea leaves. Photographs show the five major stages of the Yuhua tea manufacturing process: plucking (S1), spreading (S2), fixation (S3), rolling (S4) and drying (S5).
-

Figure 2.
Heatmap and principal component analysis (PCA) plot of three Yuhua tea samples with three duplicates. (a) Heatmap; (b) 2D score scatter plots of the PCA for five samples (S1, S2, S3, S4, S5 and QC). The QC (quality control) sample was a mixture of S1, S2, S3, S4 and S5.
-
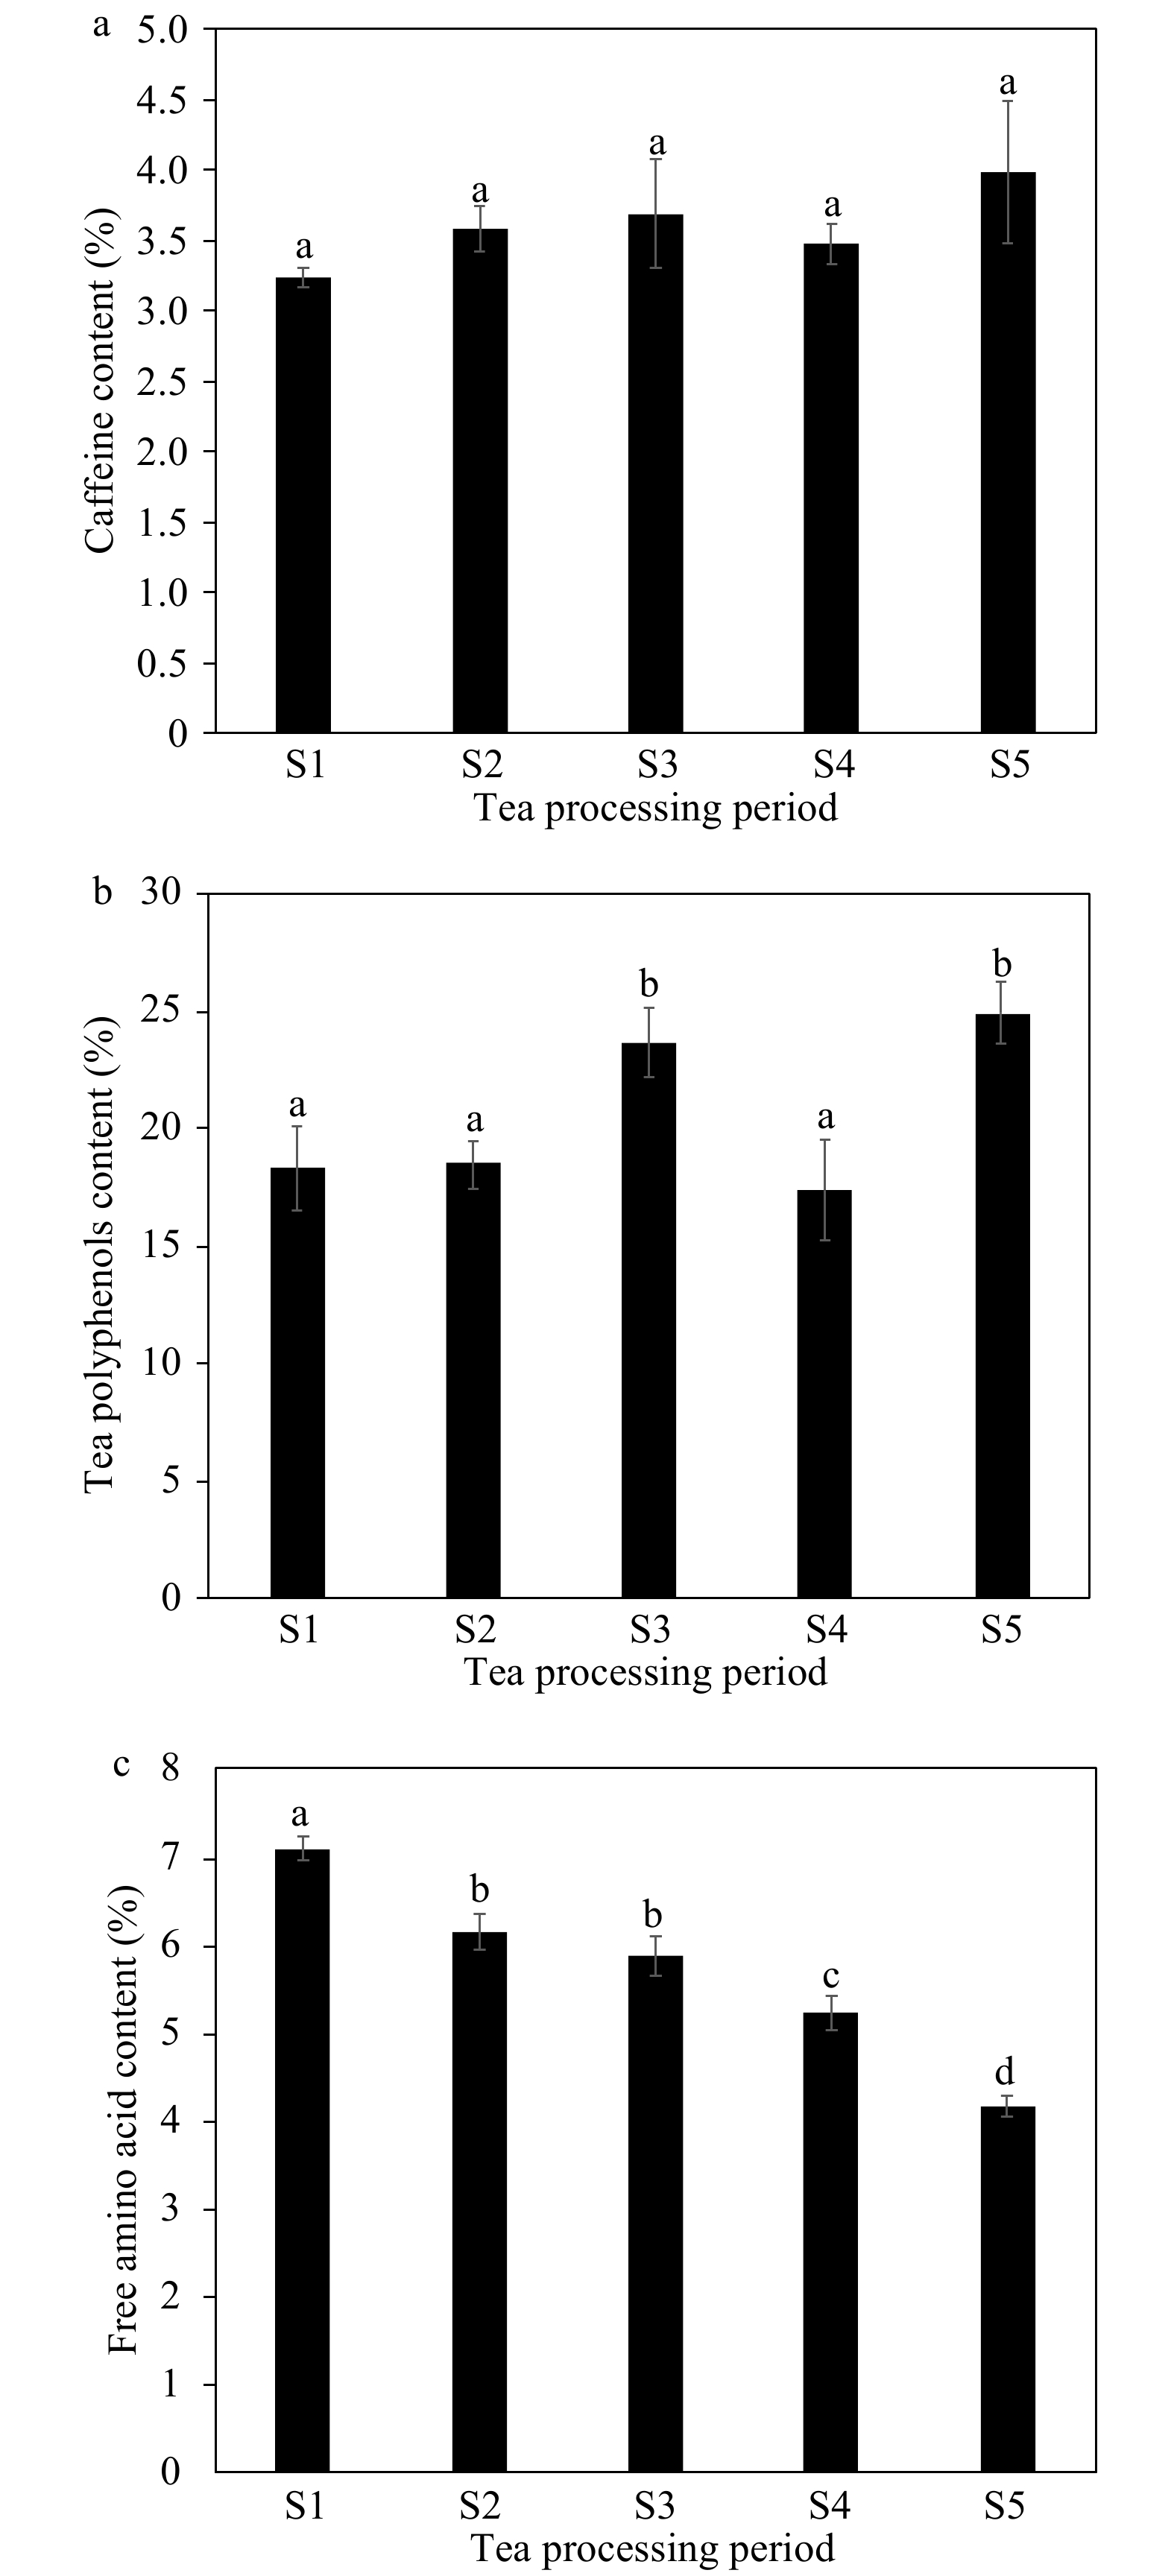
Figure 3.
Changes in the main biochemical component content of tea during different manufacturing processes. The changes in (a) tea polyphenols, (b) caffeine and (c) free amino acid content during different tea processing stages.
-
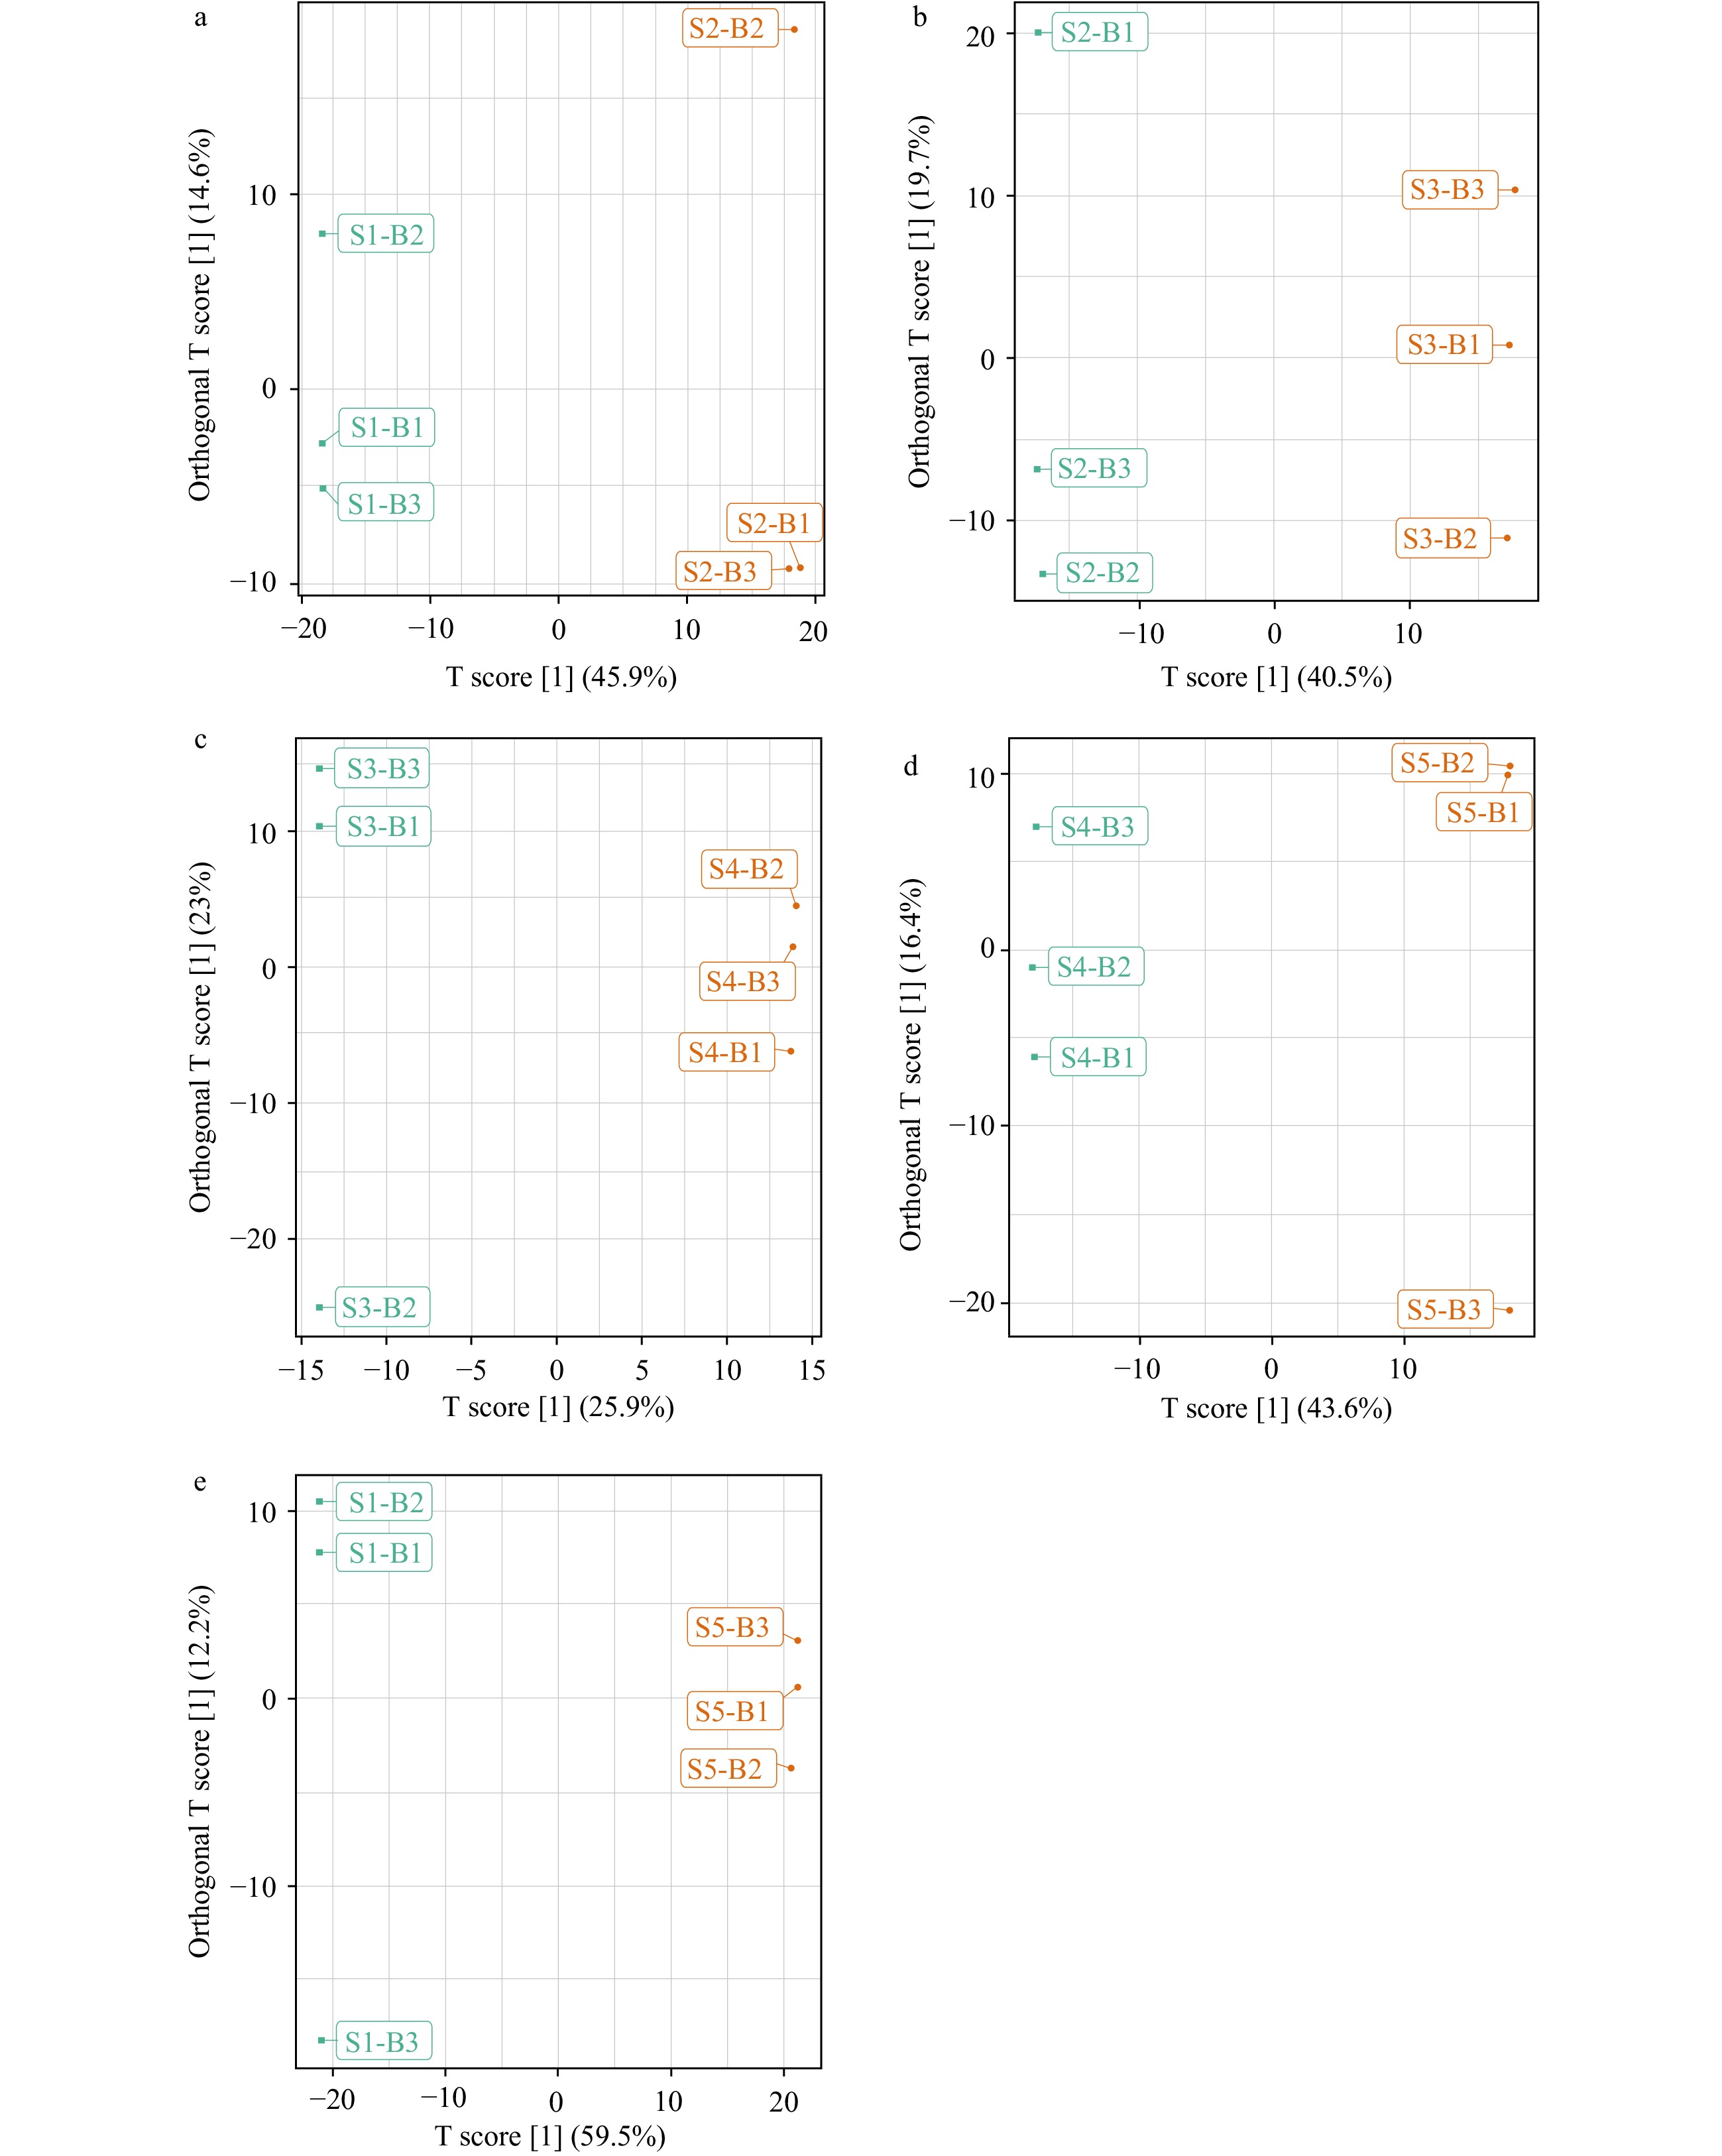
Figure 4.
Orthogonal projections to latent structures-discriminant analysis (OPLS-DA). Score scatter plots of the OPLS-DA model for S1 vs S2 (a), S2 vs S3 (b), S3 vs S4 (c), S4 vs S5 (d) and S1 vs S5 (e).
-
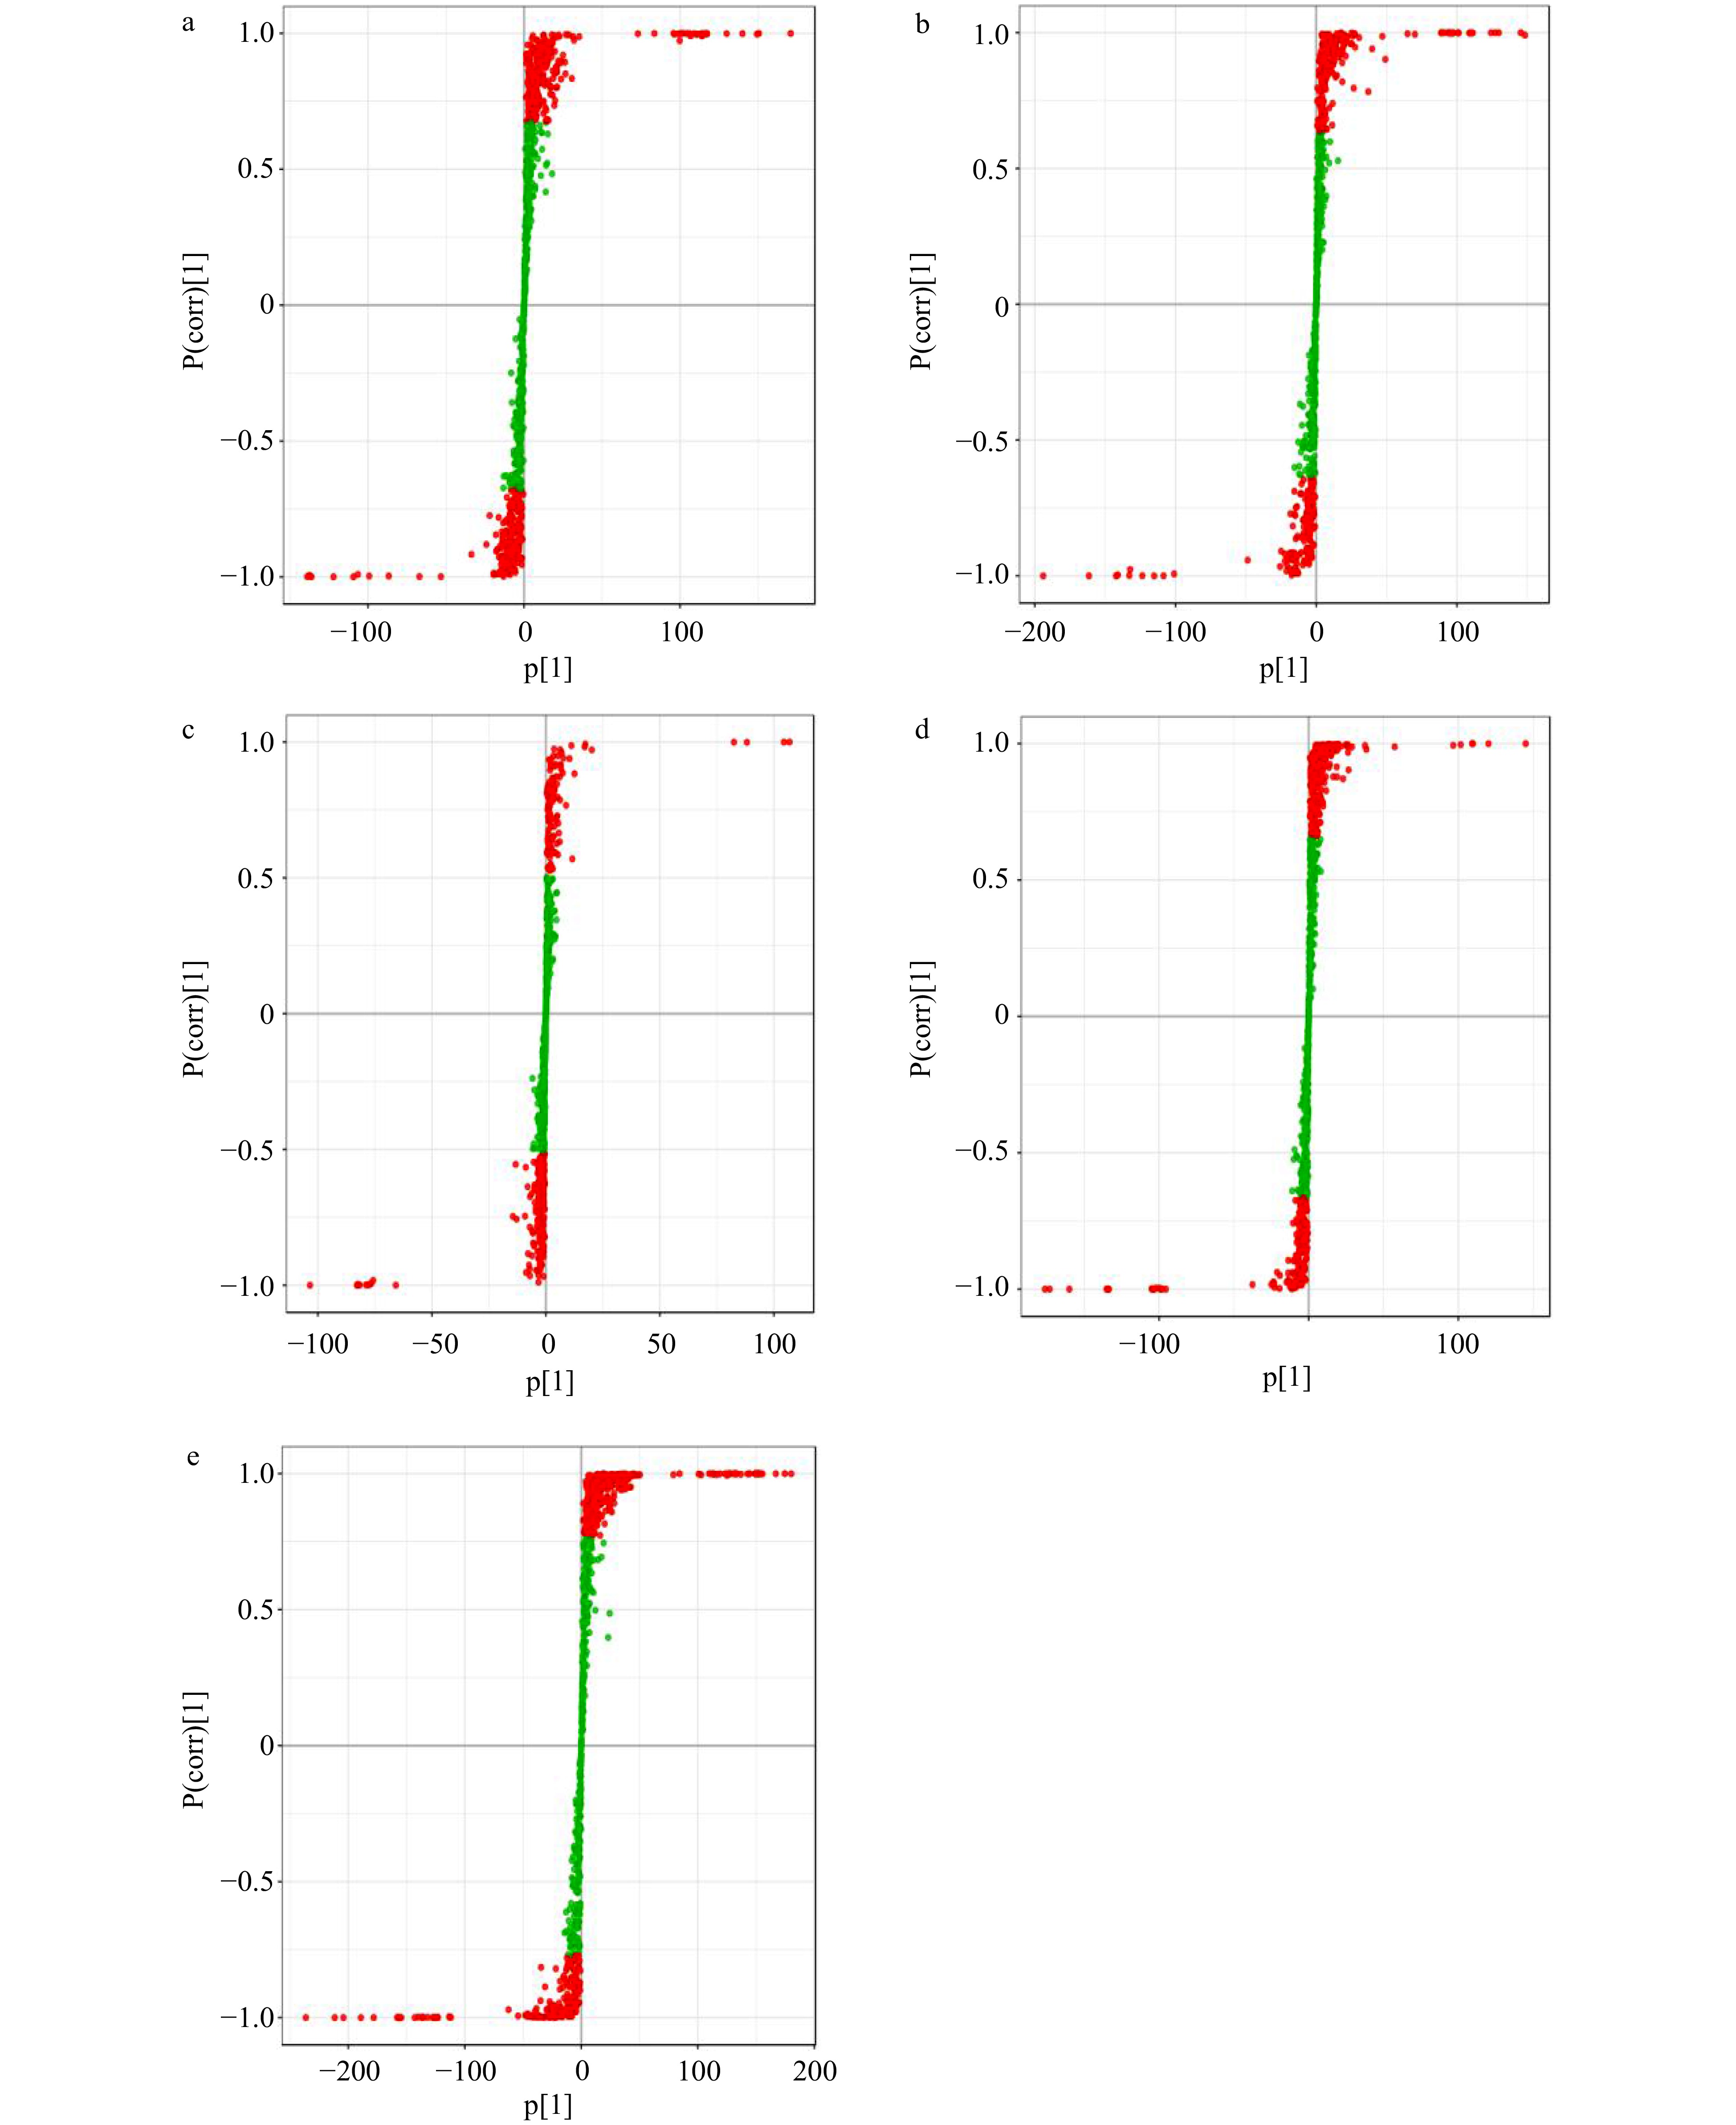
Figure 5.
Orthogonal projections to latent structures-discriminant analysis (OPLS-DA). S-plots of the OPLS-DA model for S1 vs S2 (a), S2 vs S3 (b), S3 vs S4 (c) and S4 vs S5 (d), S1 vs S5 (e).
-
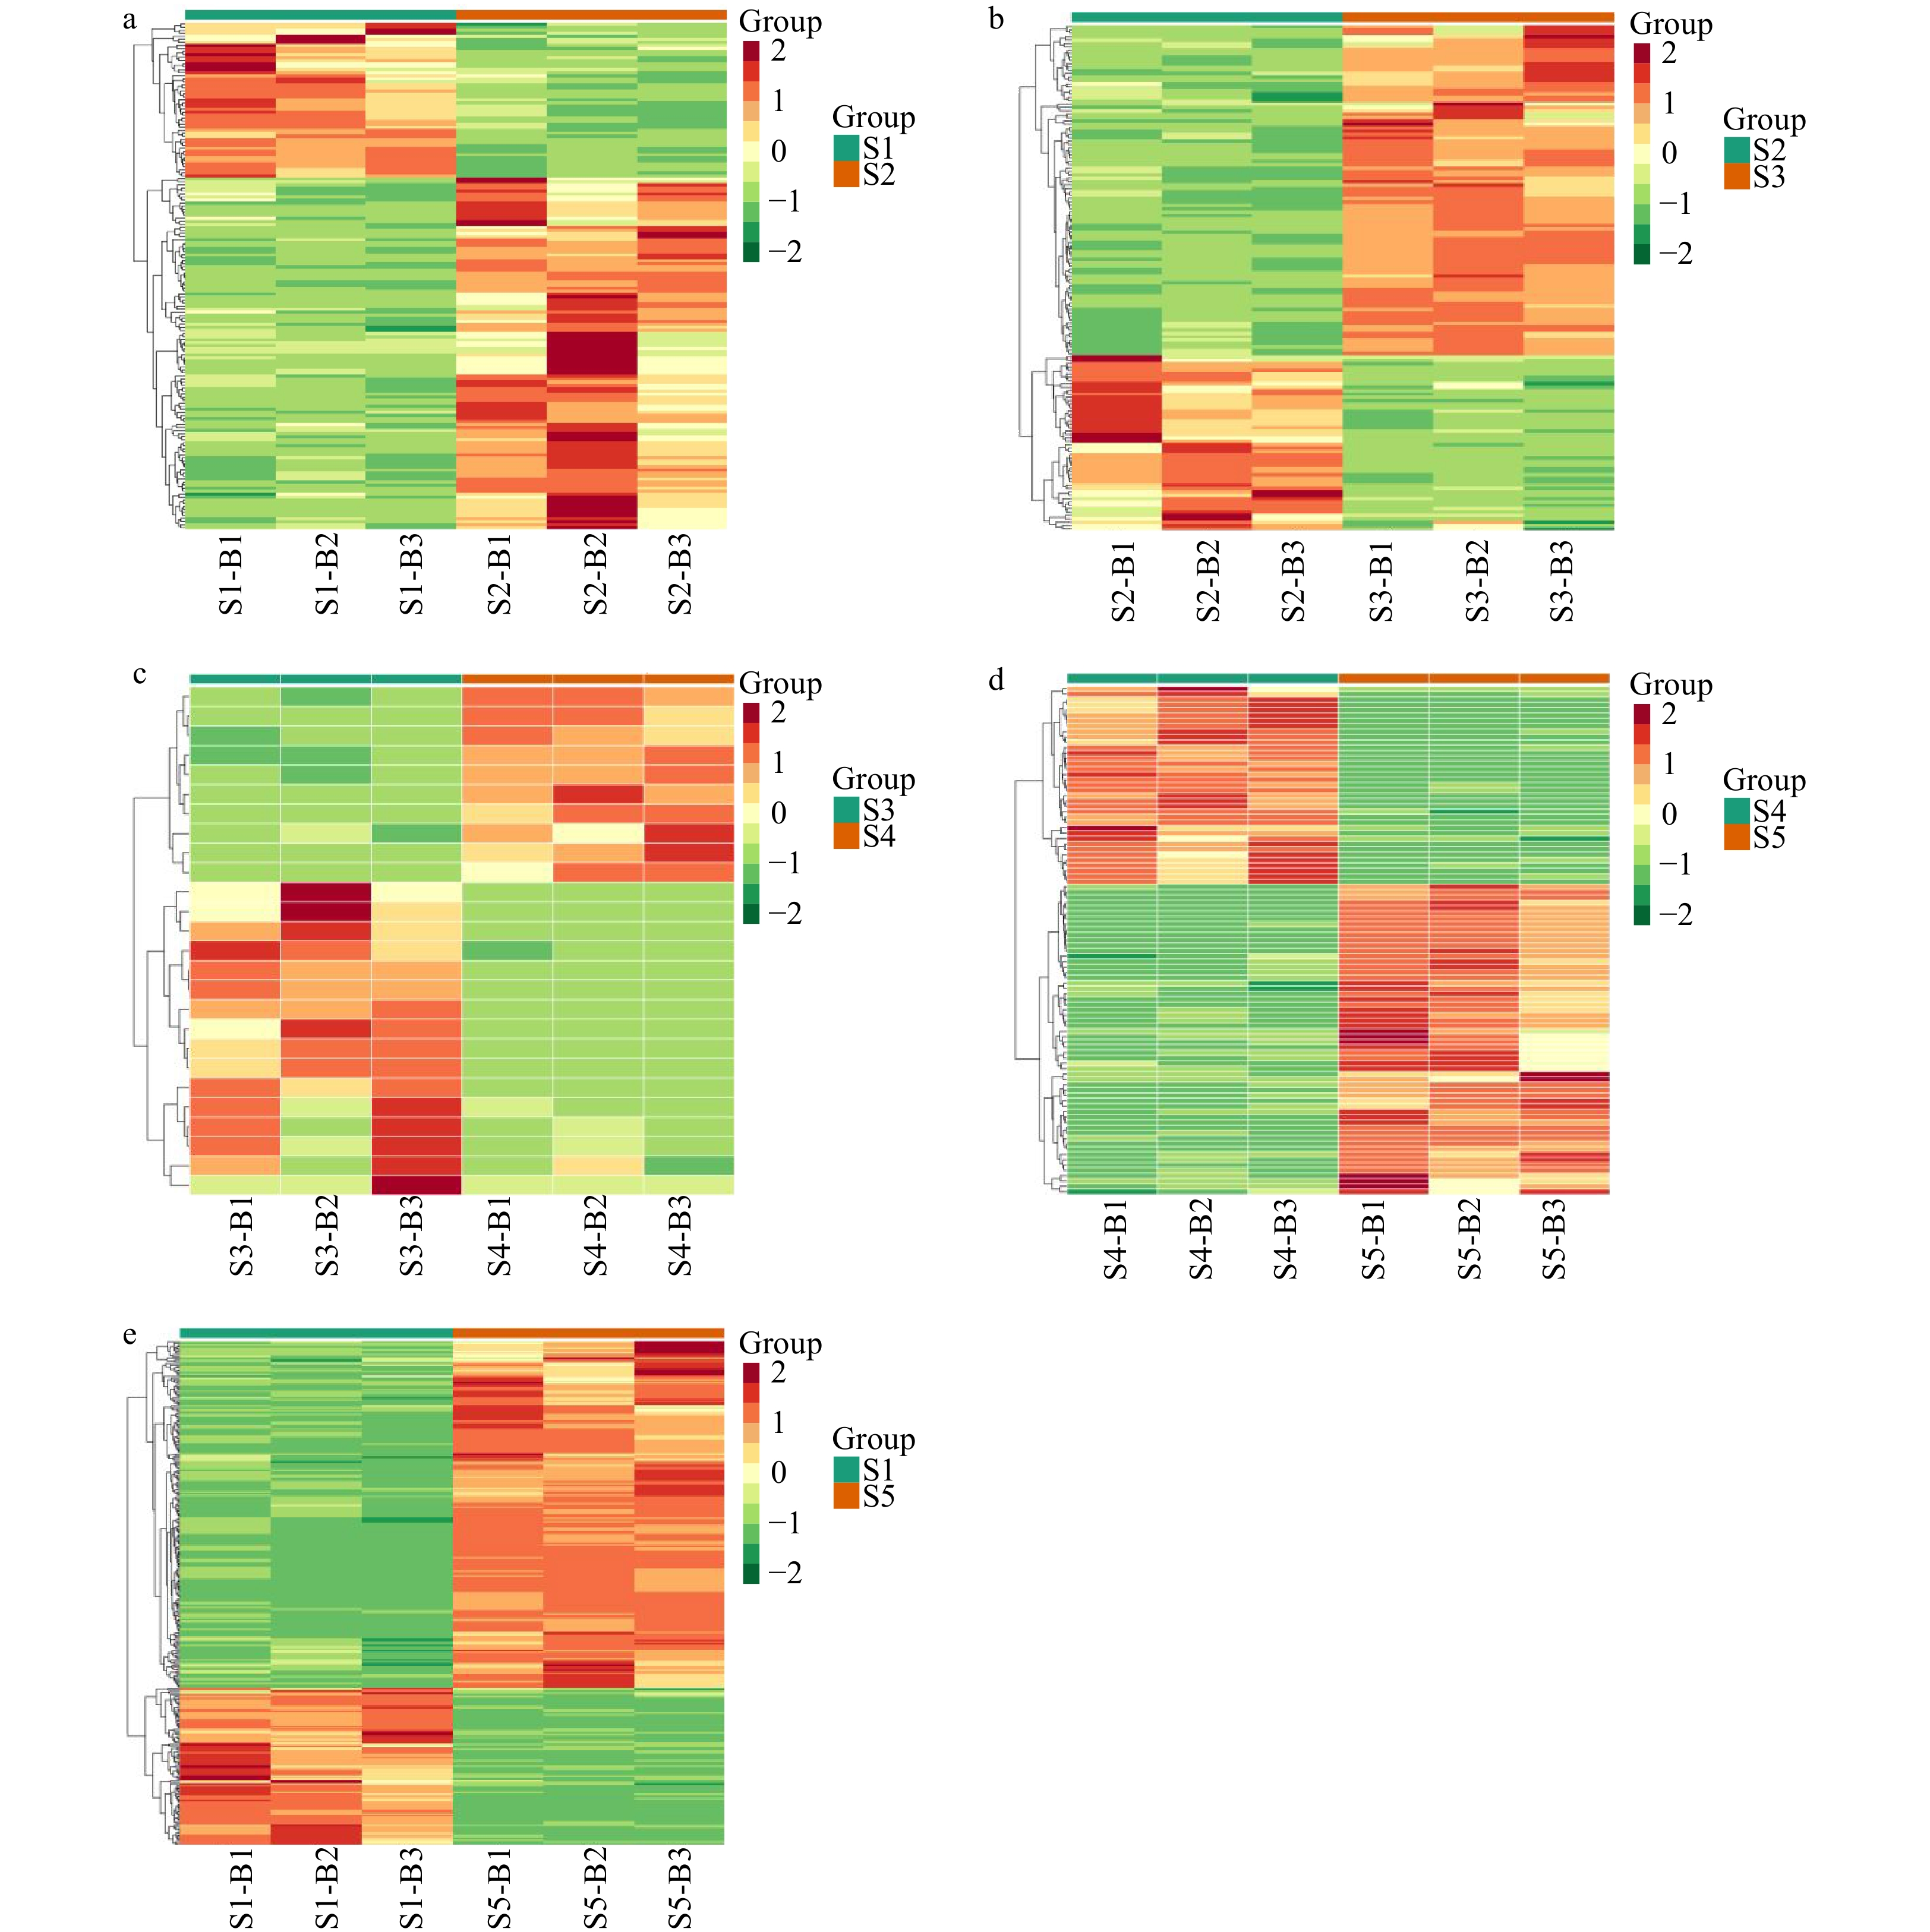
Figure 6.
Four pairwise heatmaps of all the identified compounds from the five stir-fried green teas. Pairwise heatmaps of the relative differences in metabolites between (a) S1 and S2, (b) S2 and S3, (c) S3 and S4, (d) S4 and S5 and (e) S1 vs S5. Red and green indicate higher and lower abundances, respectively.
-
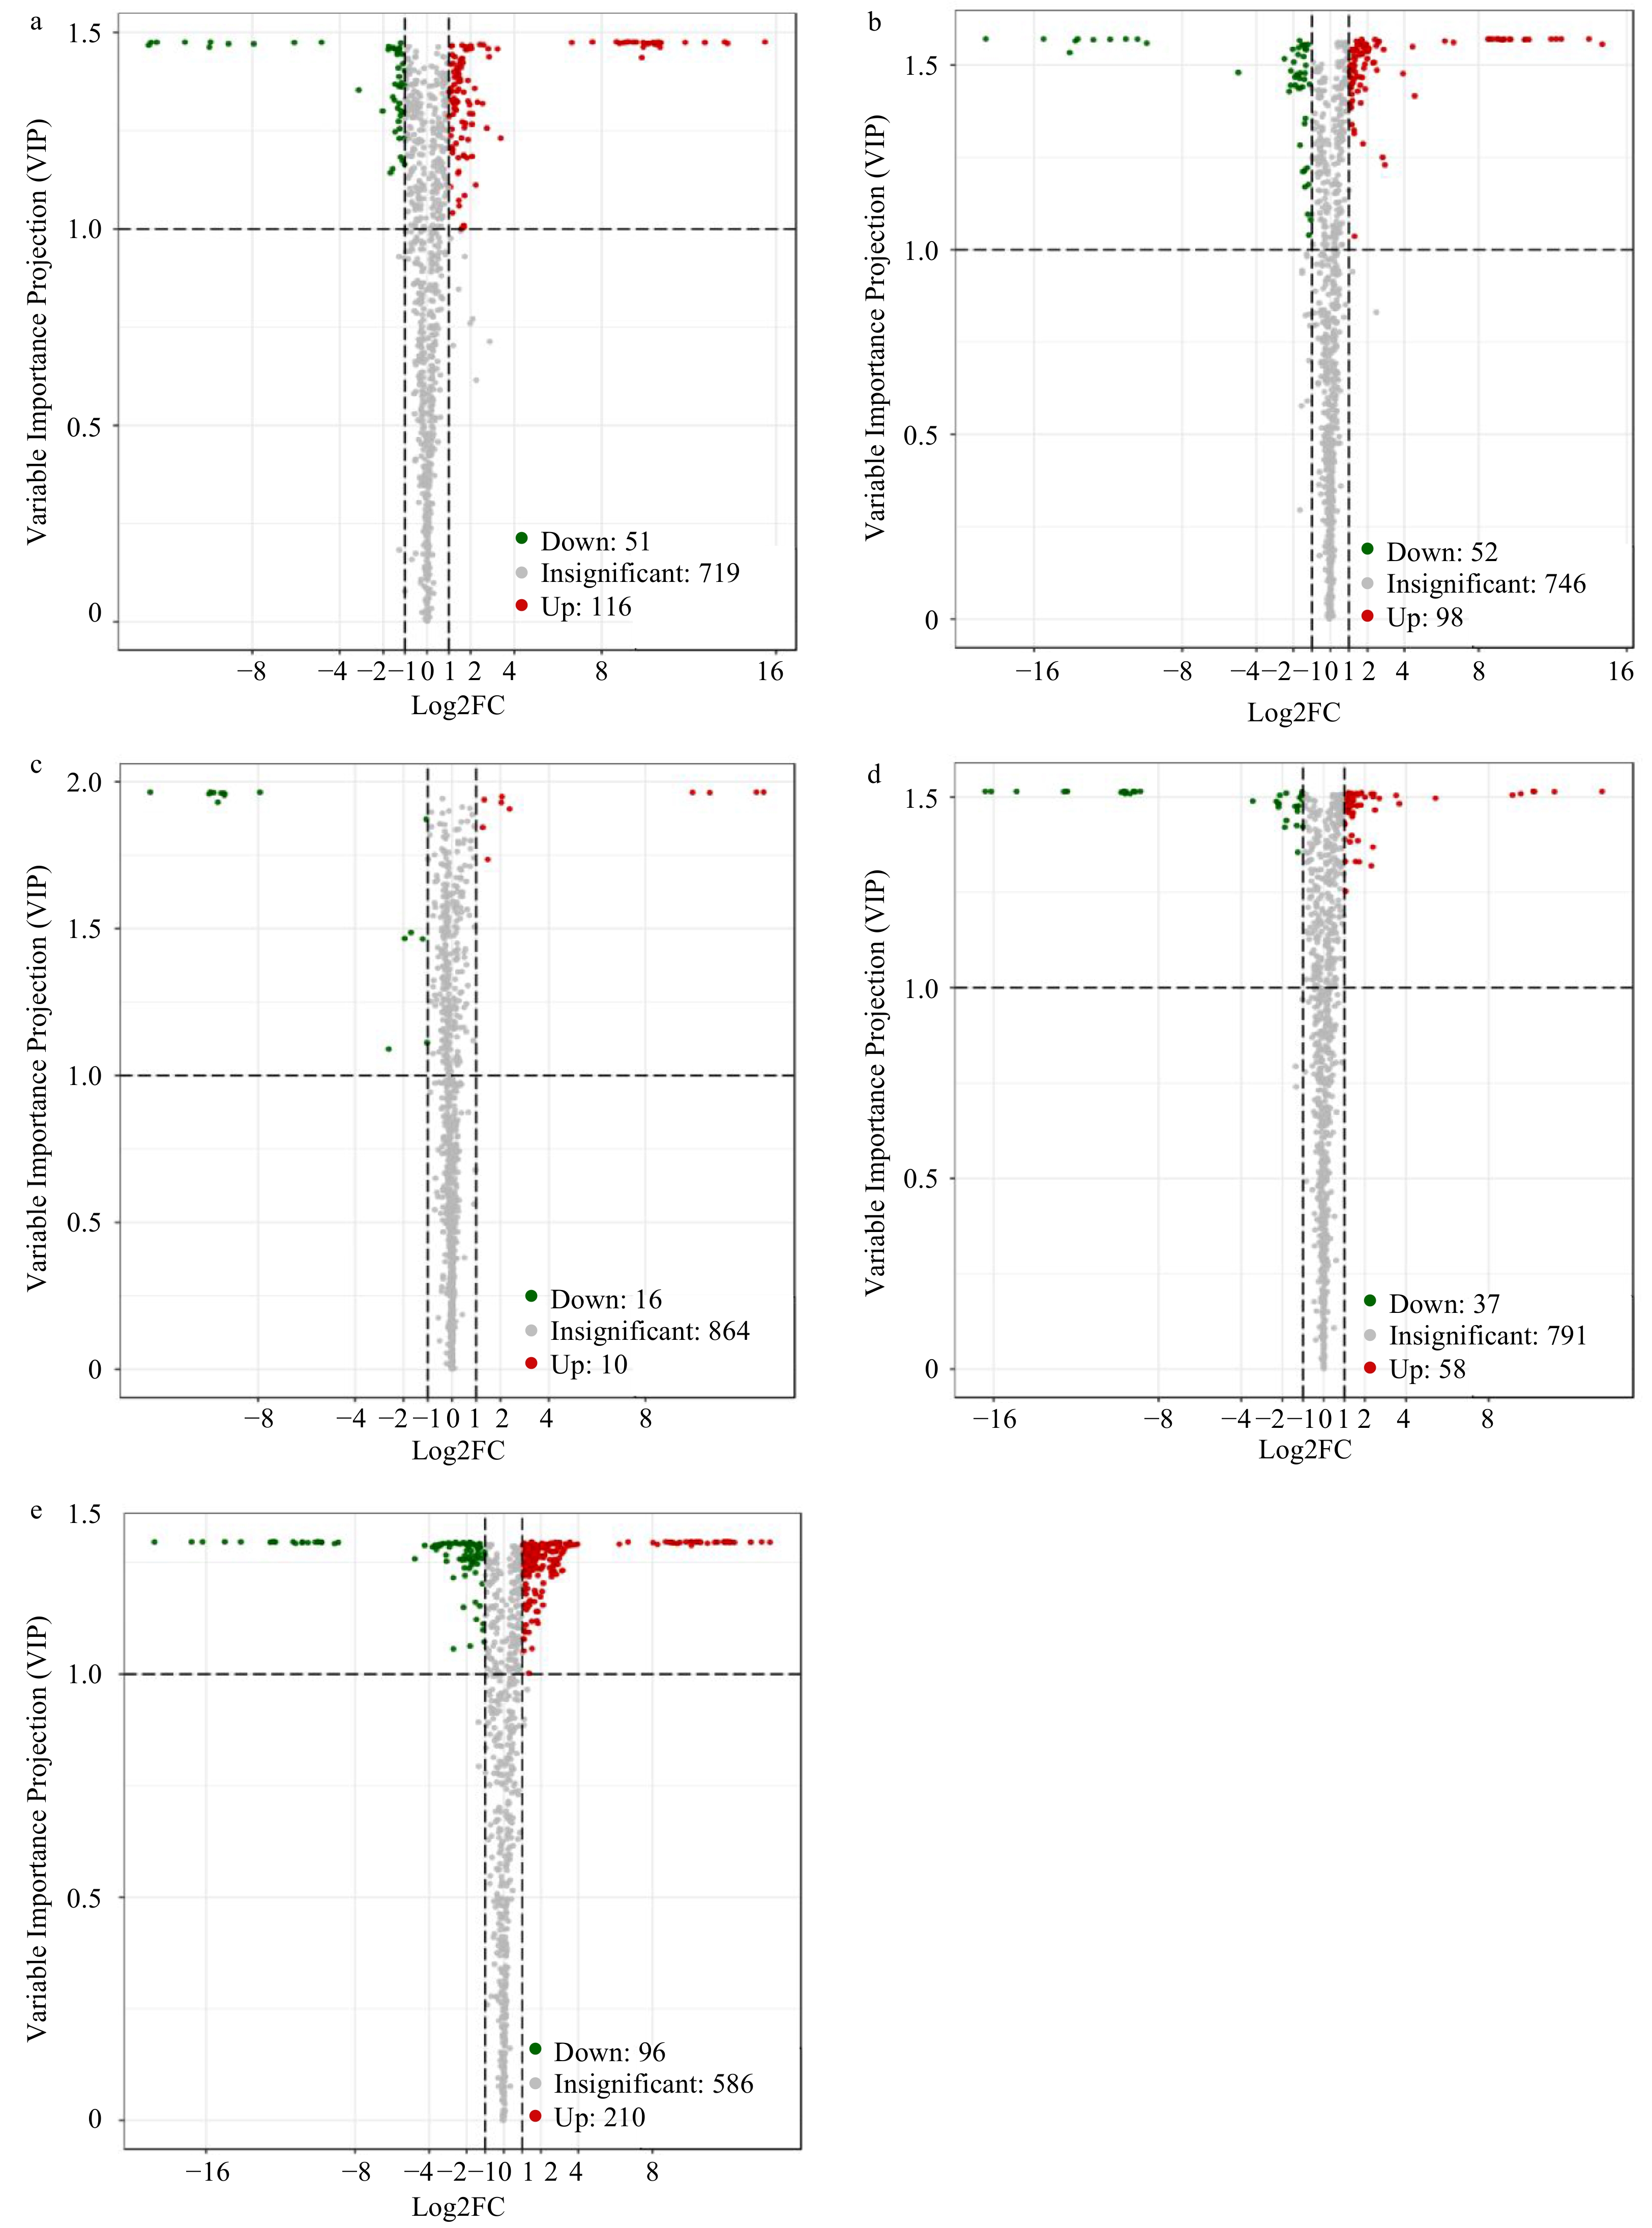
Figure 7.
Differential metabolite analyses for different stages using the criteria VIP ≥ 1 and FC ≥ 2 or ≤ 0.5. Volcano plots of differential metabolites between (a) S1 vs S2, (b) S2 vs S3, (c) S3 vs S4, (d) S4 vs S5 and (e) S1 vs S5. Red and green dots represent increased and decreased differential metabolites, respectively; gray dots represent non-differential metabolites.
Figures
(7)
Tables
(0)