-
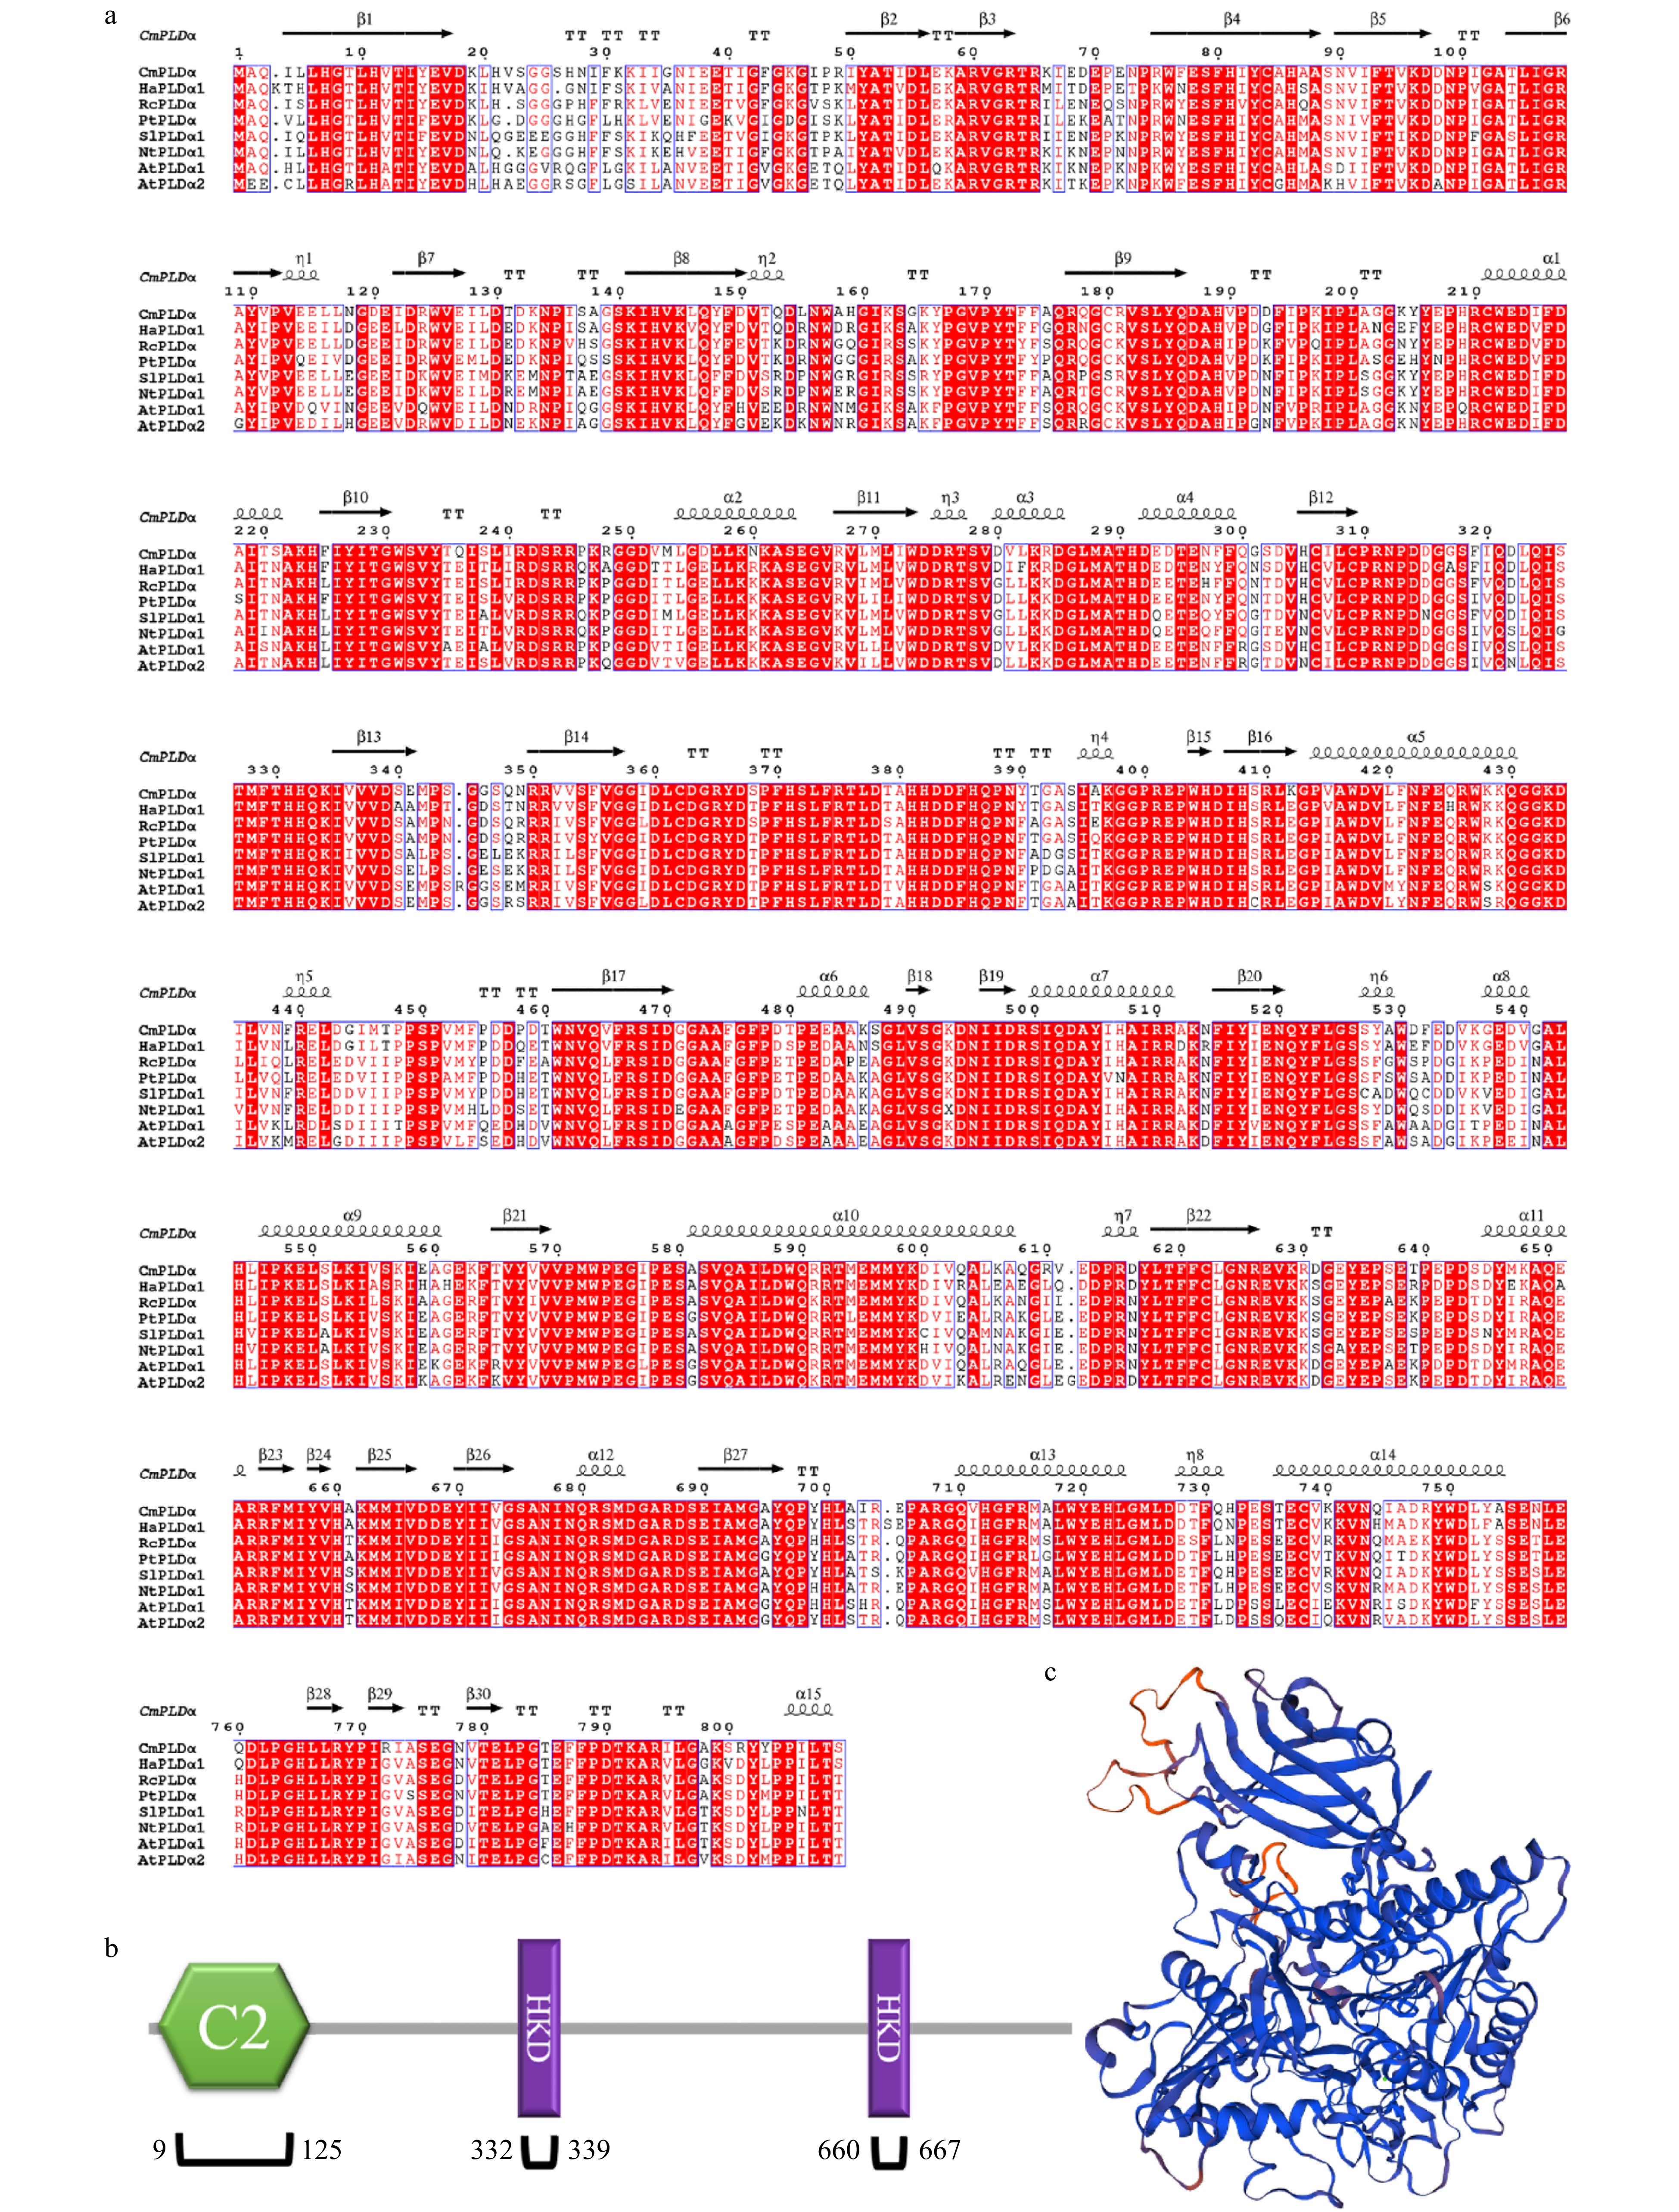
Figure 1. Sequence analysis of CmPLDα. (a) Alignment of CmPLDα with other known PLD homolog proteins. Secondary structure elements are shown at the top (helix with wavy lines, β-strand with arrows, and turns with TT letters). (b) C2 domain (existed between 9−125aa) and two HKD motifs (existed between 332−339aa and 660−667aa). (c) The tertiary structure of CmPLDα (PDB: 6kz9) with sequence identity 78.99% using homolog modeling.
-
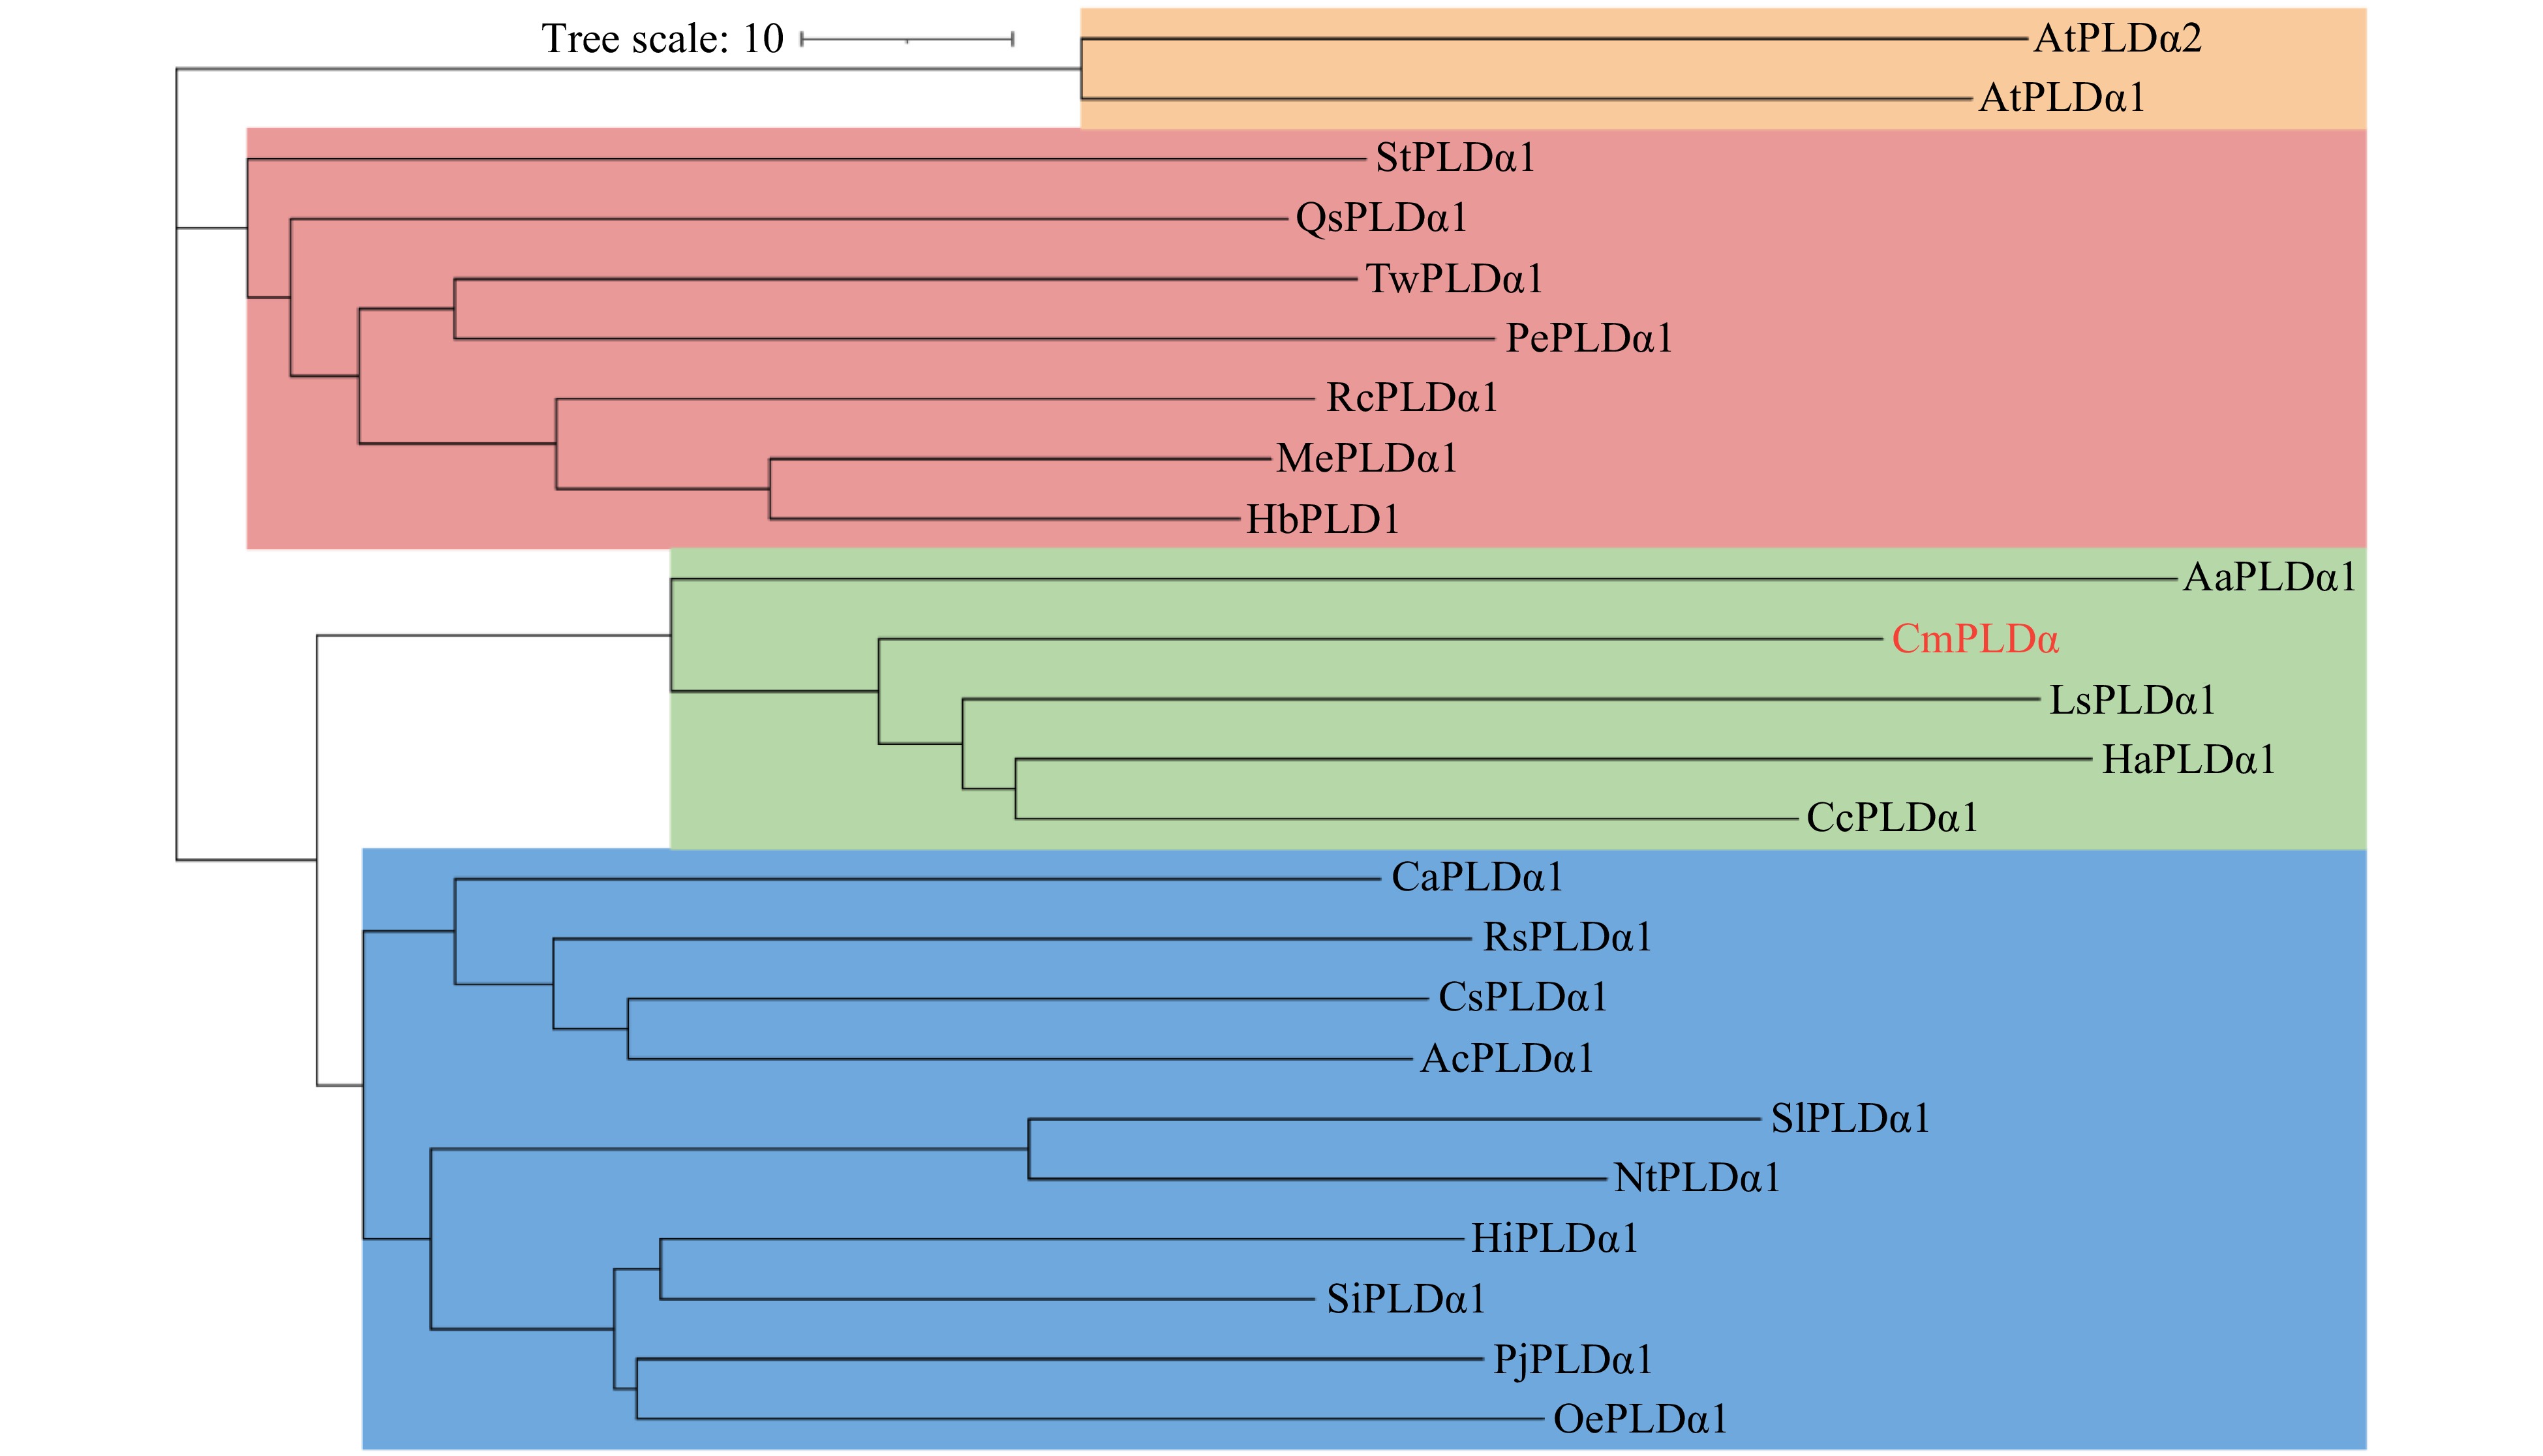
Figure 2. Phylogenetic tree analysis of CmPLDα. The phylogenetic tree revealed four branches and the red font indicates CmPLDα. The source and accession number of the amino acids are as follows: AtPLDα1 (Arabidopsis Thaliana NP_188194.1) , AtPLDα2 (Arabidopsis Thaliana NP_175666.1), StPLDα1 (Senna tora KAF7814366.1), QsPLDα1 (Quercus suber XP_023925867.1), TwPLDα1 (Tripterygium wilfordii XP_038717853.1), PePLDα1 (Populus euphratica XP_011008452.1), RcPLDα1 (Ricinus communis NP_001310687.1), MePLDα1 (Manihot esculenta XP_021629145.1), HbPLDα (Hevea brasiliensis XP_021672614.1), AaPLDα1 (Artemisia annua PWA90284.1), LsPLDα1 (Lactuca sativa XP_023761181.1), HaPLDα1 (Helianthus annuus ABU54776.1), CcPLDα1 (Cynara cardunculus XP_024972255.1), CaPLDα1 (Coffea arabica XP_027126646.1), RsPLDα1 (Rhododendron simsii KAF7135150.1), CsPLDα1 (Camellia sinensis XP_028072531.1), AcPLDα1 (Actinidia chinensis PSR96034.1), SlPLDα1 (Solanum lycopersicum AAG45485.1), NtPLDα1 (Nicotiana tabacum XP_016458333.1), HiPLDα1 (Handroanthus impetiginosus PIN16148.1), SiPLDα1 (Sesamum indicum XP_011073436.1), PjPLDα1 (Phtheirospermum japonicum GFP88976.1) , OePLDα1 (Olea europaea CAA3025459.1).
-
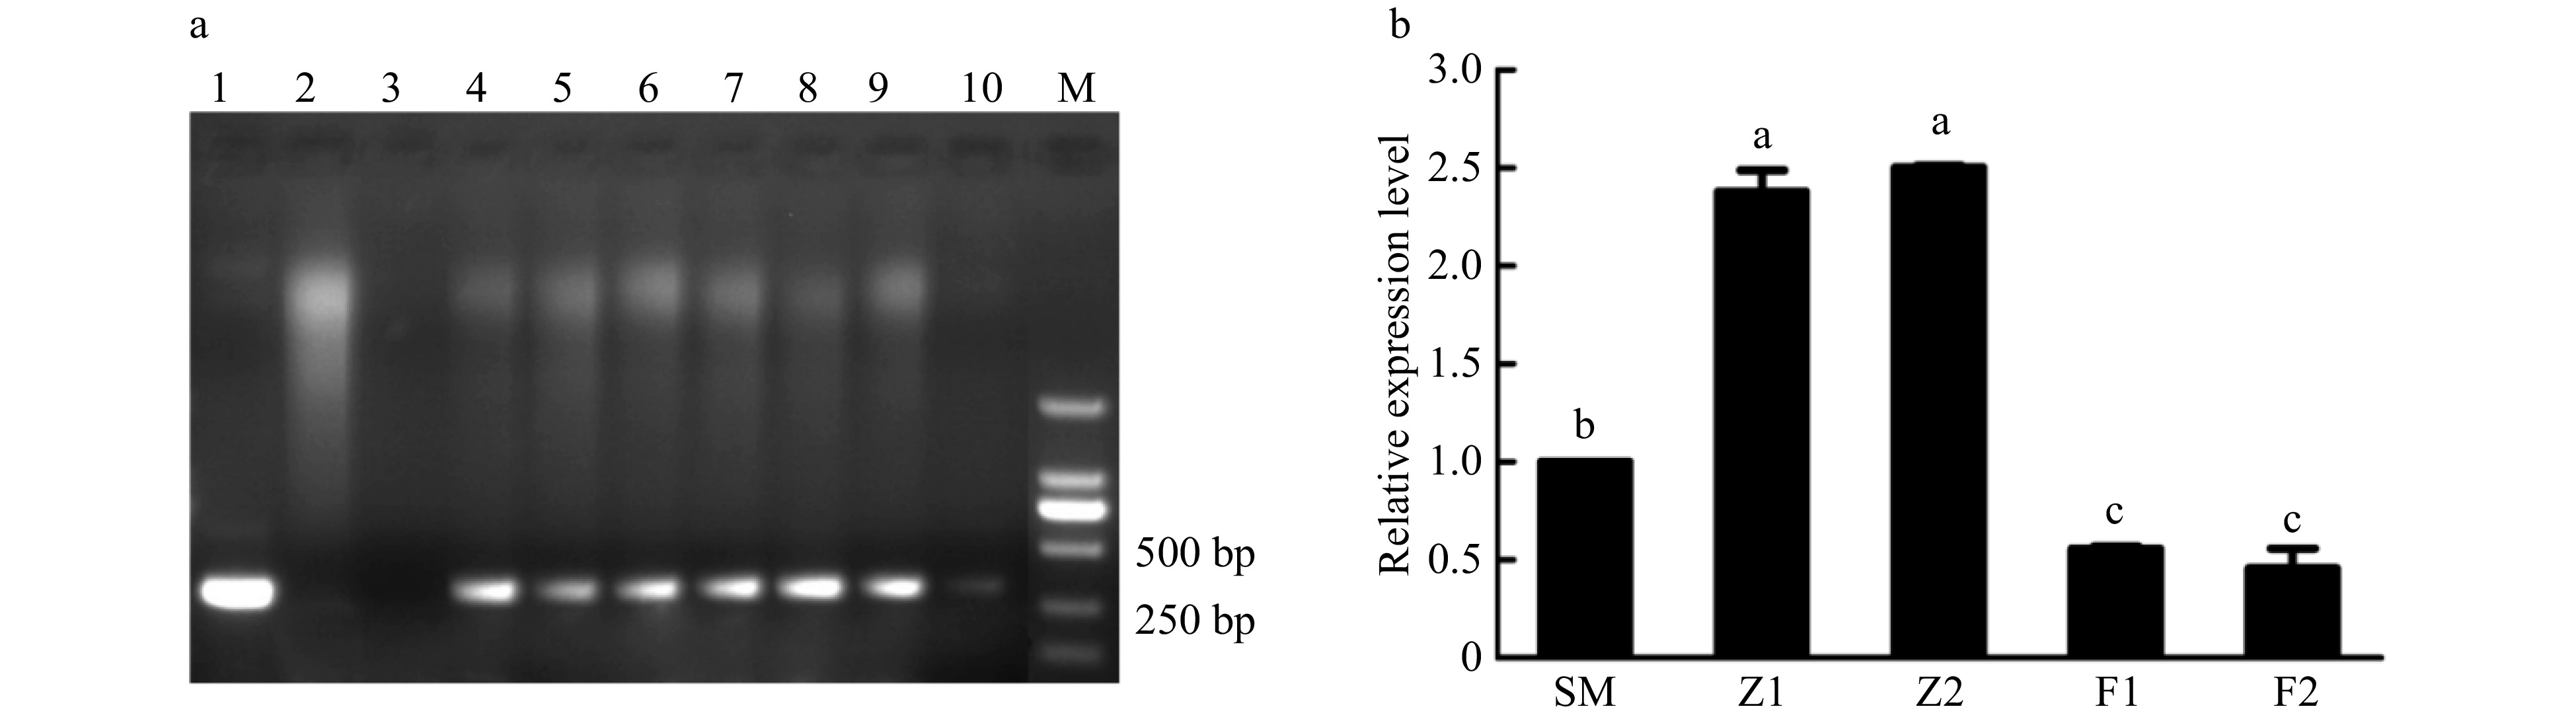
Figure 3. Detection of CmPLDα transgenic chrysanthemum plants. (a) PCR analysis of putative CmPLDα transgenic plants in the kanamycin resistant lines. M: DL2000, 1: Positive control (Plasmid pBIG-CmPLDα DNA), 2: Non-transformed plant, 3: Blank control (H2O), 4−6: CmPLDα overexpressing lines, 7−10: CmPLDα antisense transgenic lines. (b) The relative expressions level of CmPLDα in the wild type and transgenic plants. SM: Wild type, Z1, Z2: CmPLDα overexpressing lines, F1, F2: CmPLDα antisense transgenic lines. Representative results from three biological replicates are shown. Values are mean ± S.D., and different letters indicate significant differences at p < 0.05 (Fisher's LSD).
-
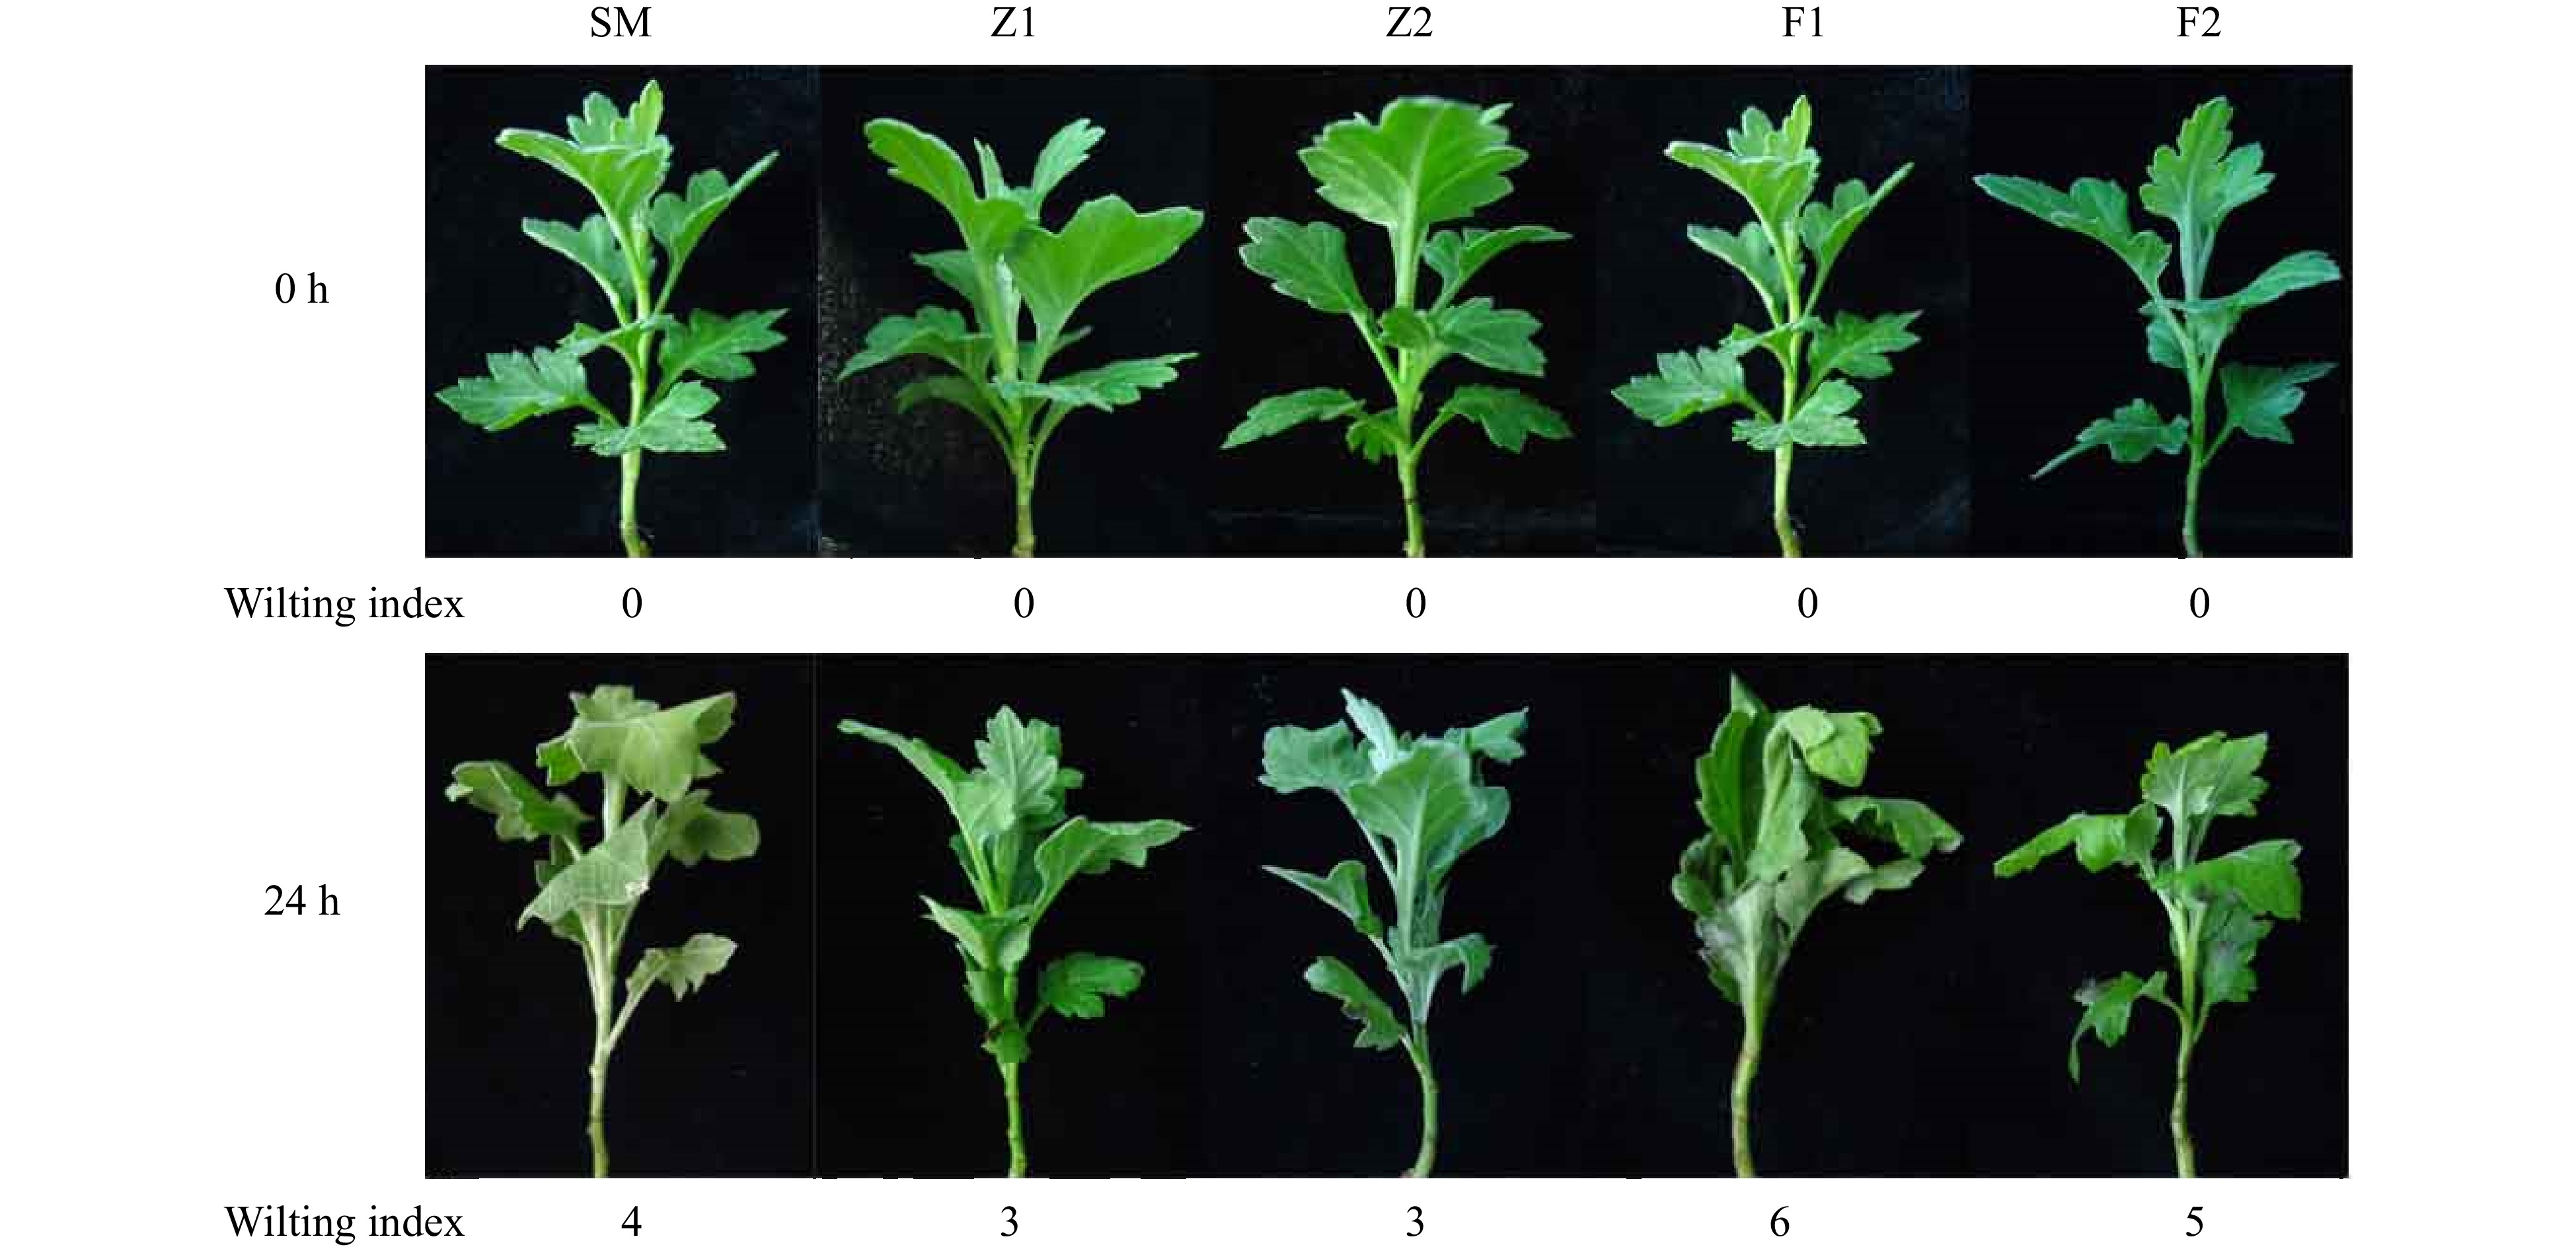
Figure 4. The morphological response of the wild type and CmPLDα transgenic plants to PEG-induced drought stress. SM: Wild type, Z1, Z2: CmPLDα overexpressing lines, F1, F2: CmPLDα antisense transgenic lines.
-
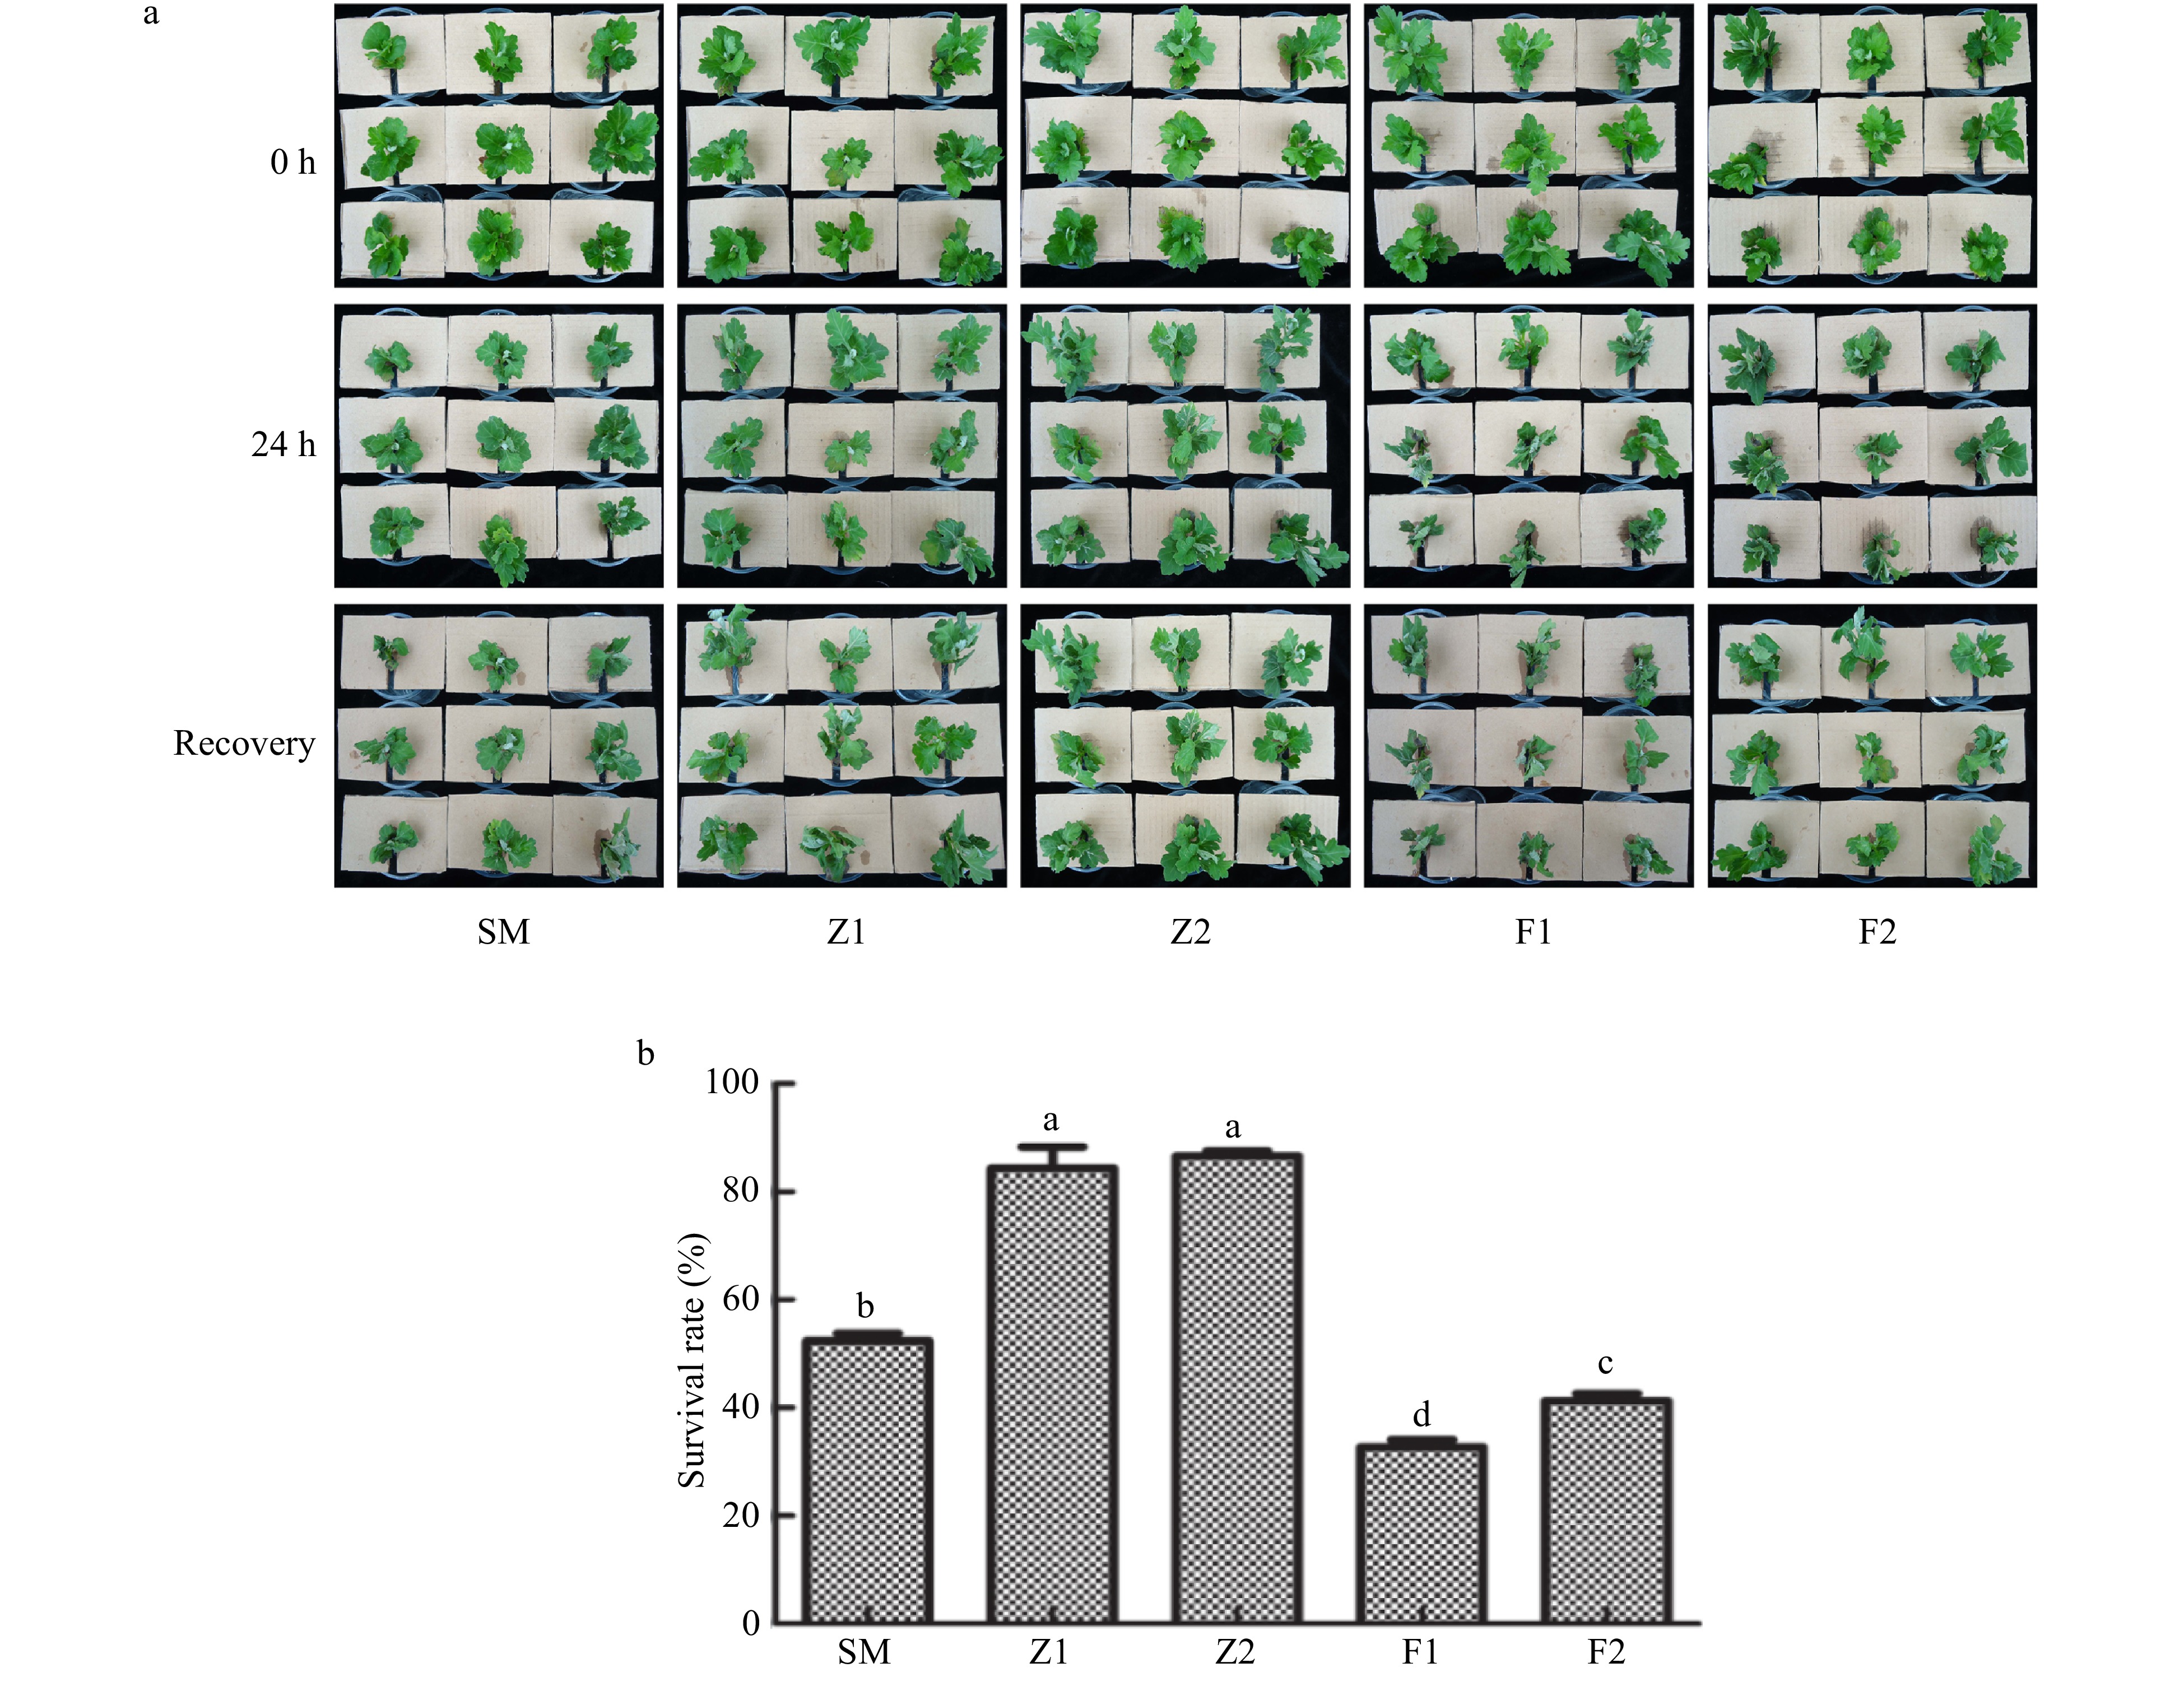
Figure 5. Drought tolerance assay of the wild type and CmPLDα transgenic plants. SM: Wild type, Z1, Z2: CmPLDα overexpressing lines, F1, F2: CmPLDα antisense transgenic lines. (a) Survival rate of recovery growth. (b) Each value is the mean ± S.D. of nine biological determinations, different letters indicate significant differences at p < 0.05 (Fisher's LSD) when comparing values under the same treatment conditions.
-
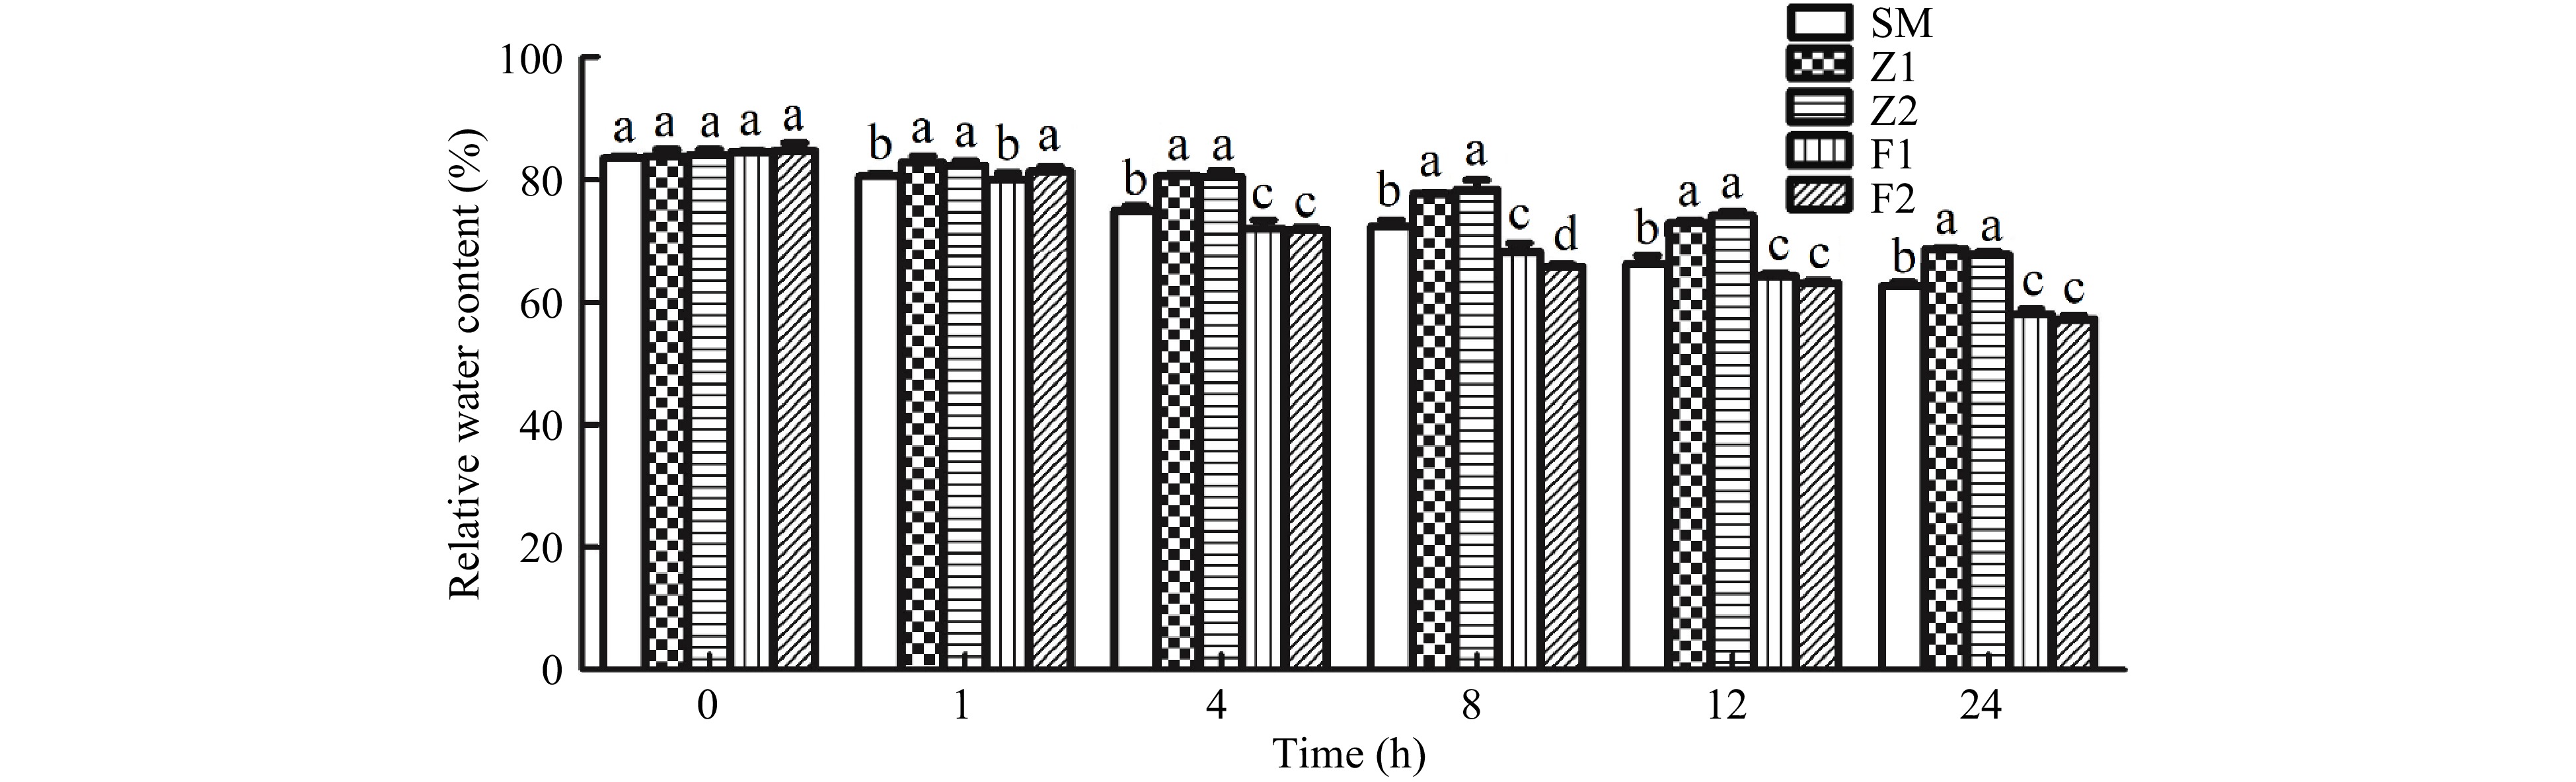
Figure 6. The leaf RWC in the wild type and CmPLDα transgenic plants under drought stress. SM: Wild type, Z1, Z2: CmPLDα overexpressing lines, F1, F2: CmPLDα antisense transgenic lines. Each value is the mean ± S.D. of nine biological determinations, and different letters indicate significant differences at p < 0.05 (Fisher's LSD) when comparing values under the same time conditions.
-
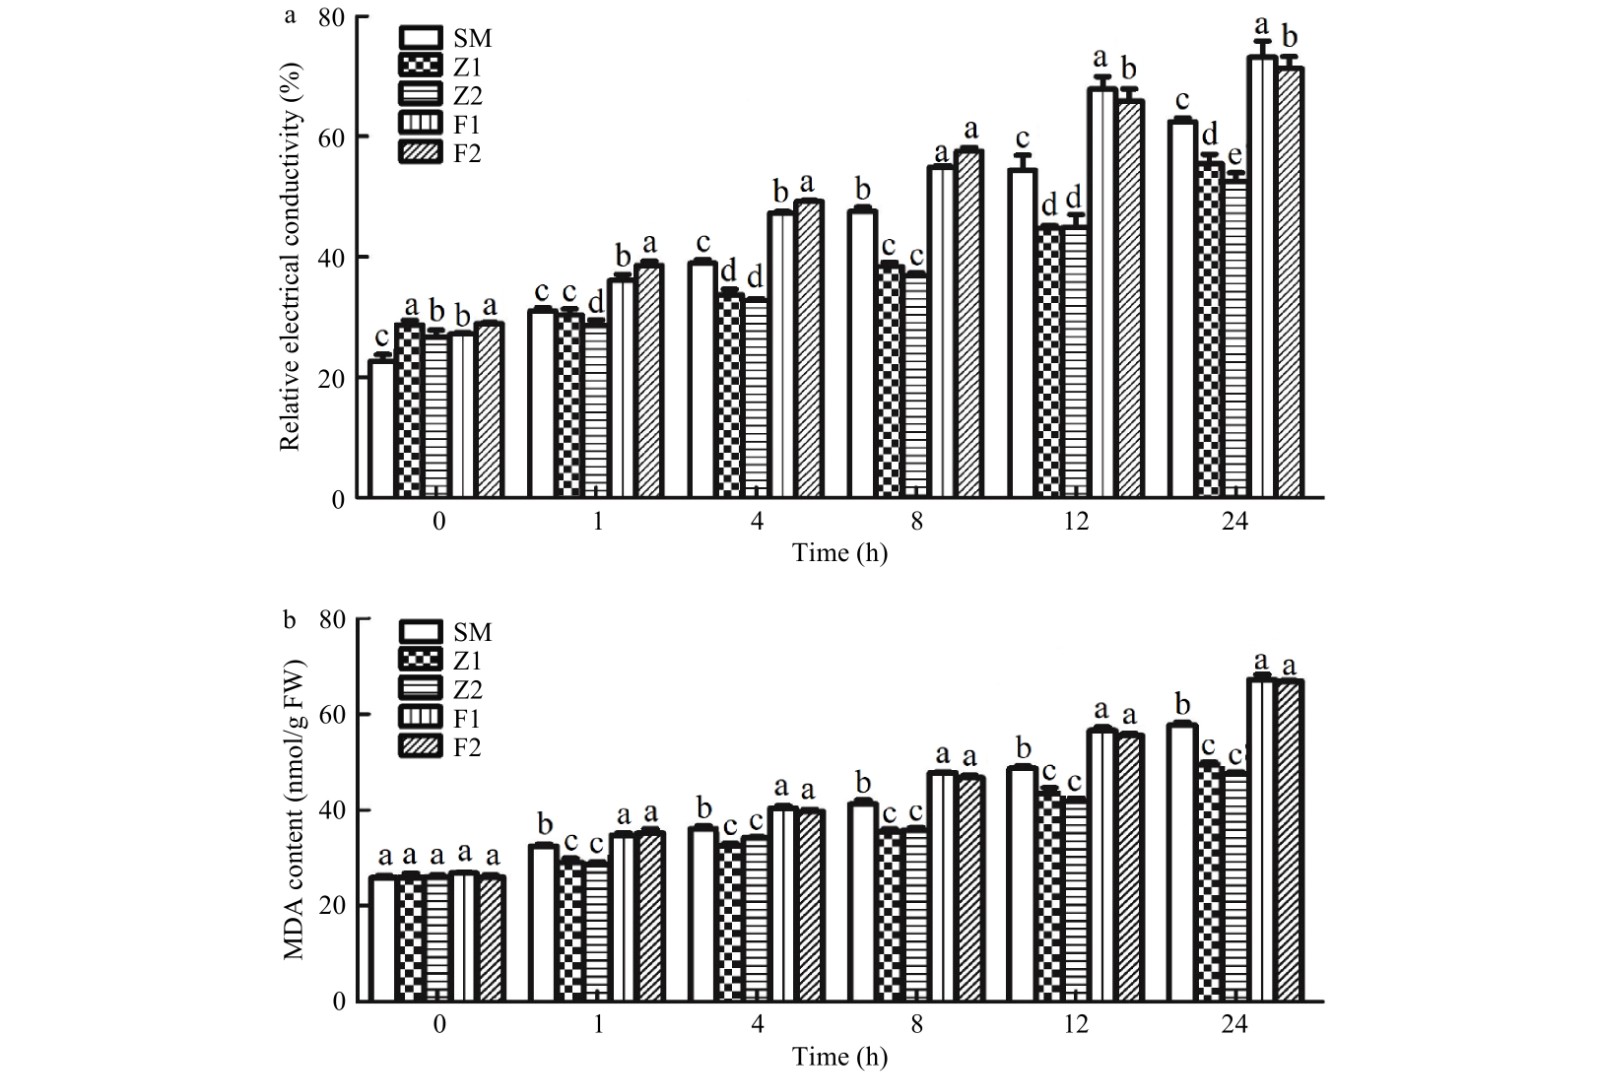
Figure 7. Relative electrical conductivity (a) and MDA content (b) in drought stressed leaves of wild type and CmPLDα transgenic plants. SM: Wild type, Z1, Z2: CmPLDα overexpressing lines, F1, F2: CmPLDα antisense transgenic lines. Each value is the mean ± S.D. of three biological replicates, different letters indicate significant differences at p < 0.05 (Fisher's LSD) when comparing values under the same time conditions.
-
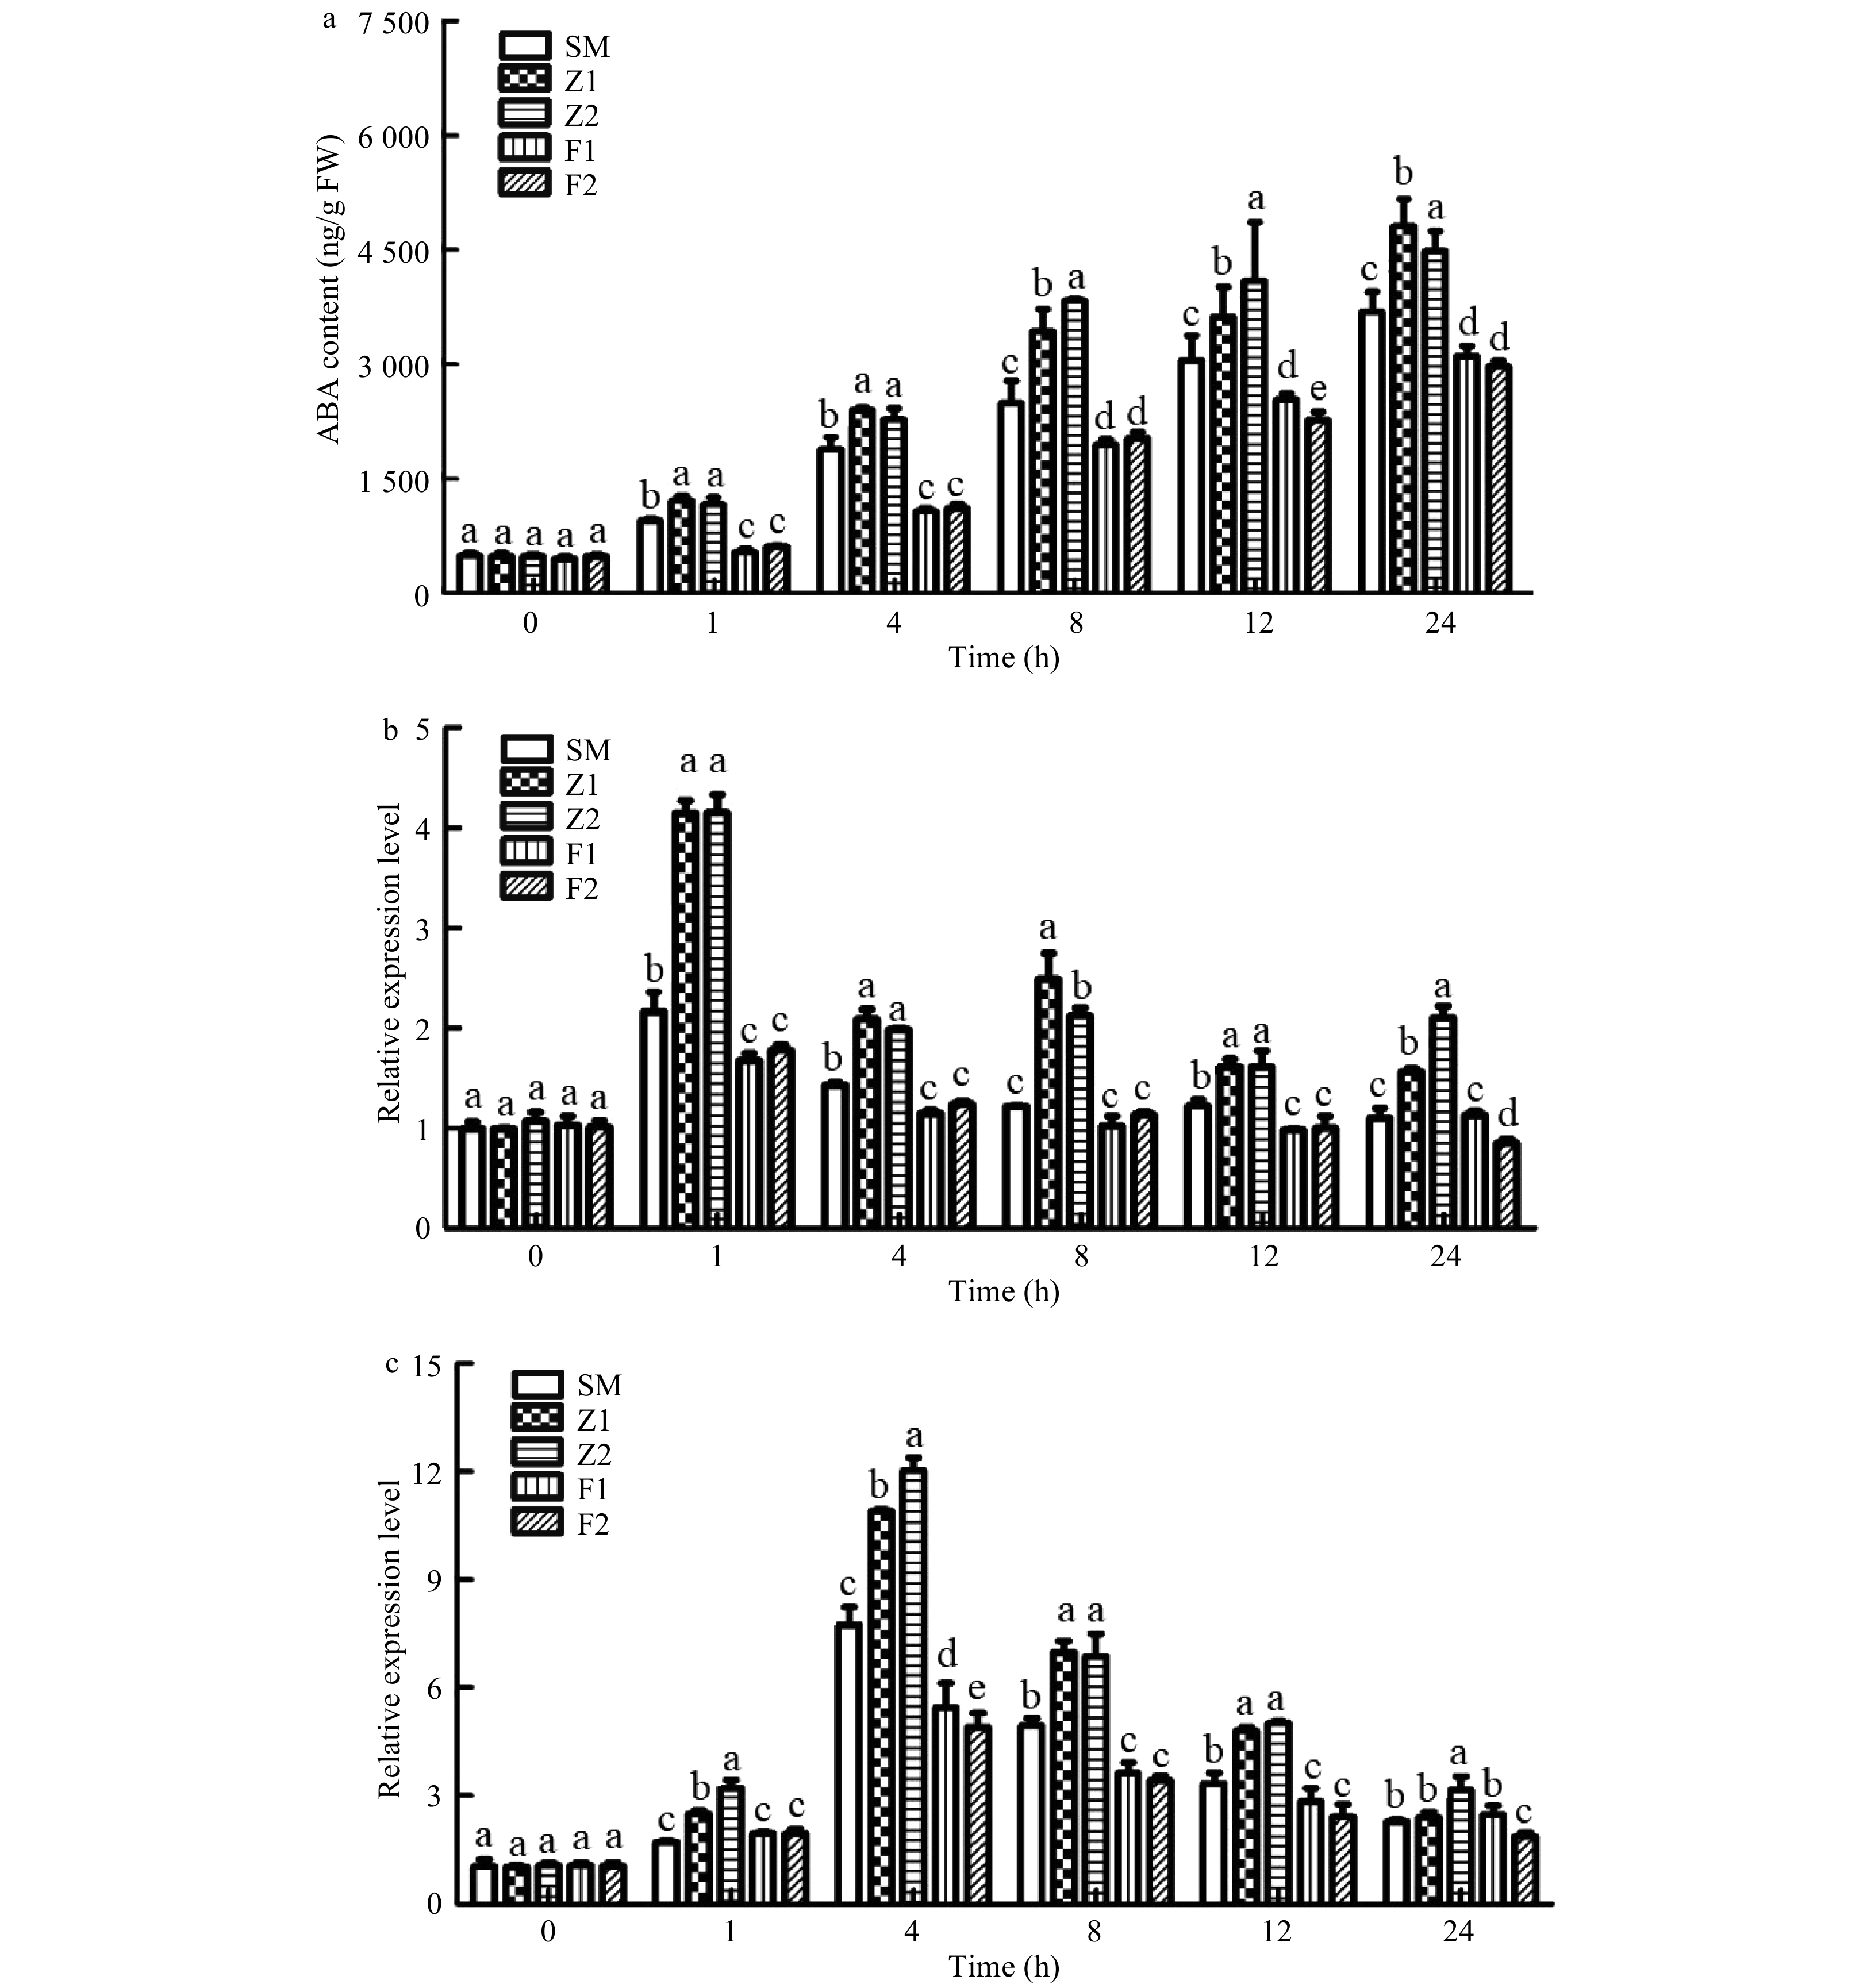
Figure 8. ABA content (a) and the relative expressions level of ABA-responsive gene CmRD29B (b) and ABA biosynthesis gene CmNCED3 (c) in wild type and CmPLDα transgenic plants under drought stress. SM: Wild type, Z1, Z2: CmPLDα overexpressing lines, F1, F2: CmPLDα antisense transgenic lines. Each value is the mean ± S.D. of three biological replicates, different letters indicate significant differences at p < 0.05 (Fisher's LSD) when comparing values under the same time conditions.
-
Primer Sequence (5'–3') Usage DPF TGCATGCTGGTGTGGGAYGAYMGNAC Degenerated PCR DPR CGTCCATGGACCGCTGRTTDATRTT / Oligo (dT) prime GACTCGAGTCGACATCGATTTTTTTTTTTTTTTTT / dT-AP AAGCAGTGGTATCAACGCAGAGTACTTTTTTTTTTTTTTTTT 3'-RACE AP-R AAGCAGTGGTATCAACGCAGAGTAC / GSP1 TCACGCTATAAGAAGAGCAA / GSP2 GGACTGGCAAAGGAGGACTA / RGSP1 TAAACCGACCATCCCGTG 5'-RACE RGSP2 CGCACTAGTAATGGCATCGAATATA / RGSP3 ACATCTGTGGGGTTCGTAATACTTC / AAP GGCCACGCGTCGACTAGTACGGGIIGGGIIGGGIIG / AUAP GGCCACGCGTCGACTAGTAC / PLDSP ATGGCTCAGATACTGCTCCATGGTA ORF amplifications PLDAP CAATGCAAACATGGCTTATTACATC / qGSP-F CACTTGCTTCGGTACCCTATTG qRT-PCR qGSP-R ACACAACCACCAAACATGACCT / EF1α-F TGTAACAAGATGGATGCCACAA / EF1α-R TCGCCCTCAAACCCAGAAAT / SmaI-SF TCCCCCGGGGGAATTCGATTCCAAGATTATGGCTCAG Vector construction SacI-SR CCGAGCTCGGCACACAACCACCAAACATGACCTTA / SmaI-AF TCCCCCGGGGGACACACAACCACCAAACATGACCTTA / SacI-AR CCGAGCTCGGATTCGATTCCAAGATTATGGCTCAG / NPTII-F TCTGATGCCGCCGTGTTC Transgenic detection NPTII-R GATGTTTCGCTTGGTGGTCG / Table 1. Primer sequences used in this study.
Figures
(8)
Tables
(1)