-
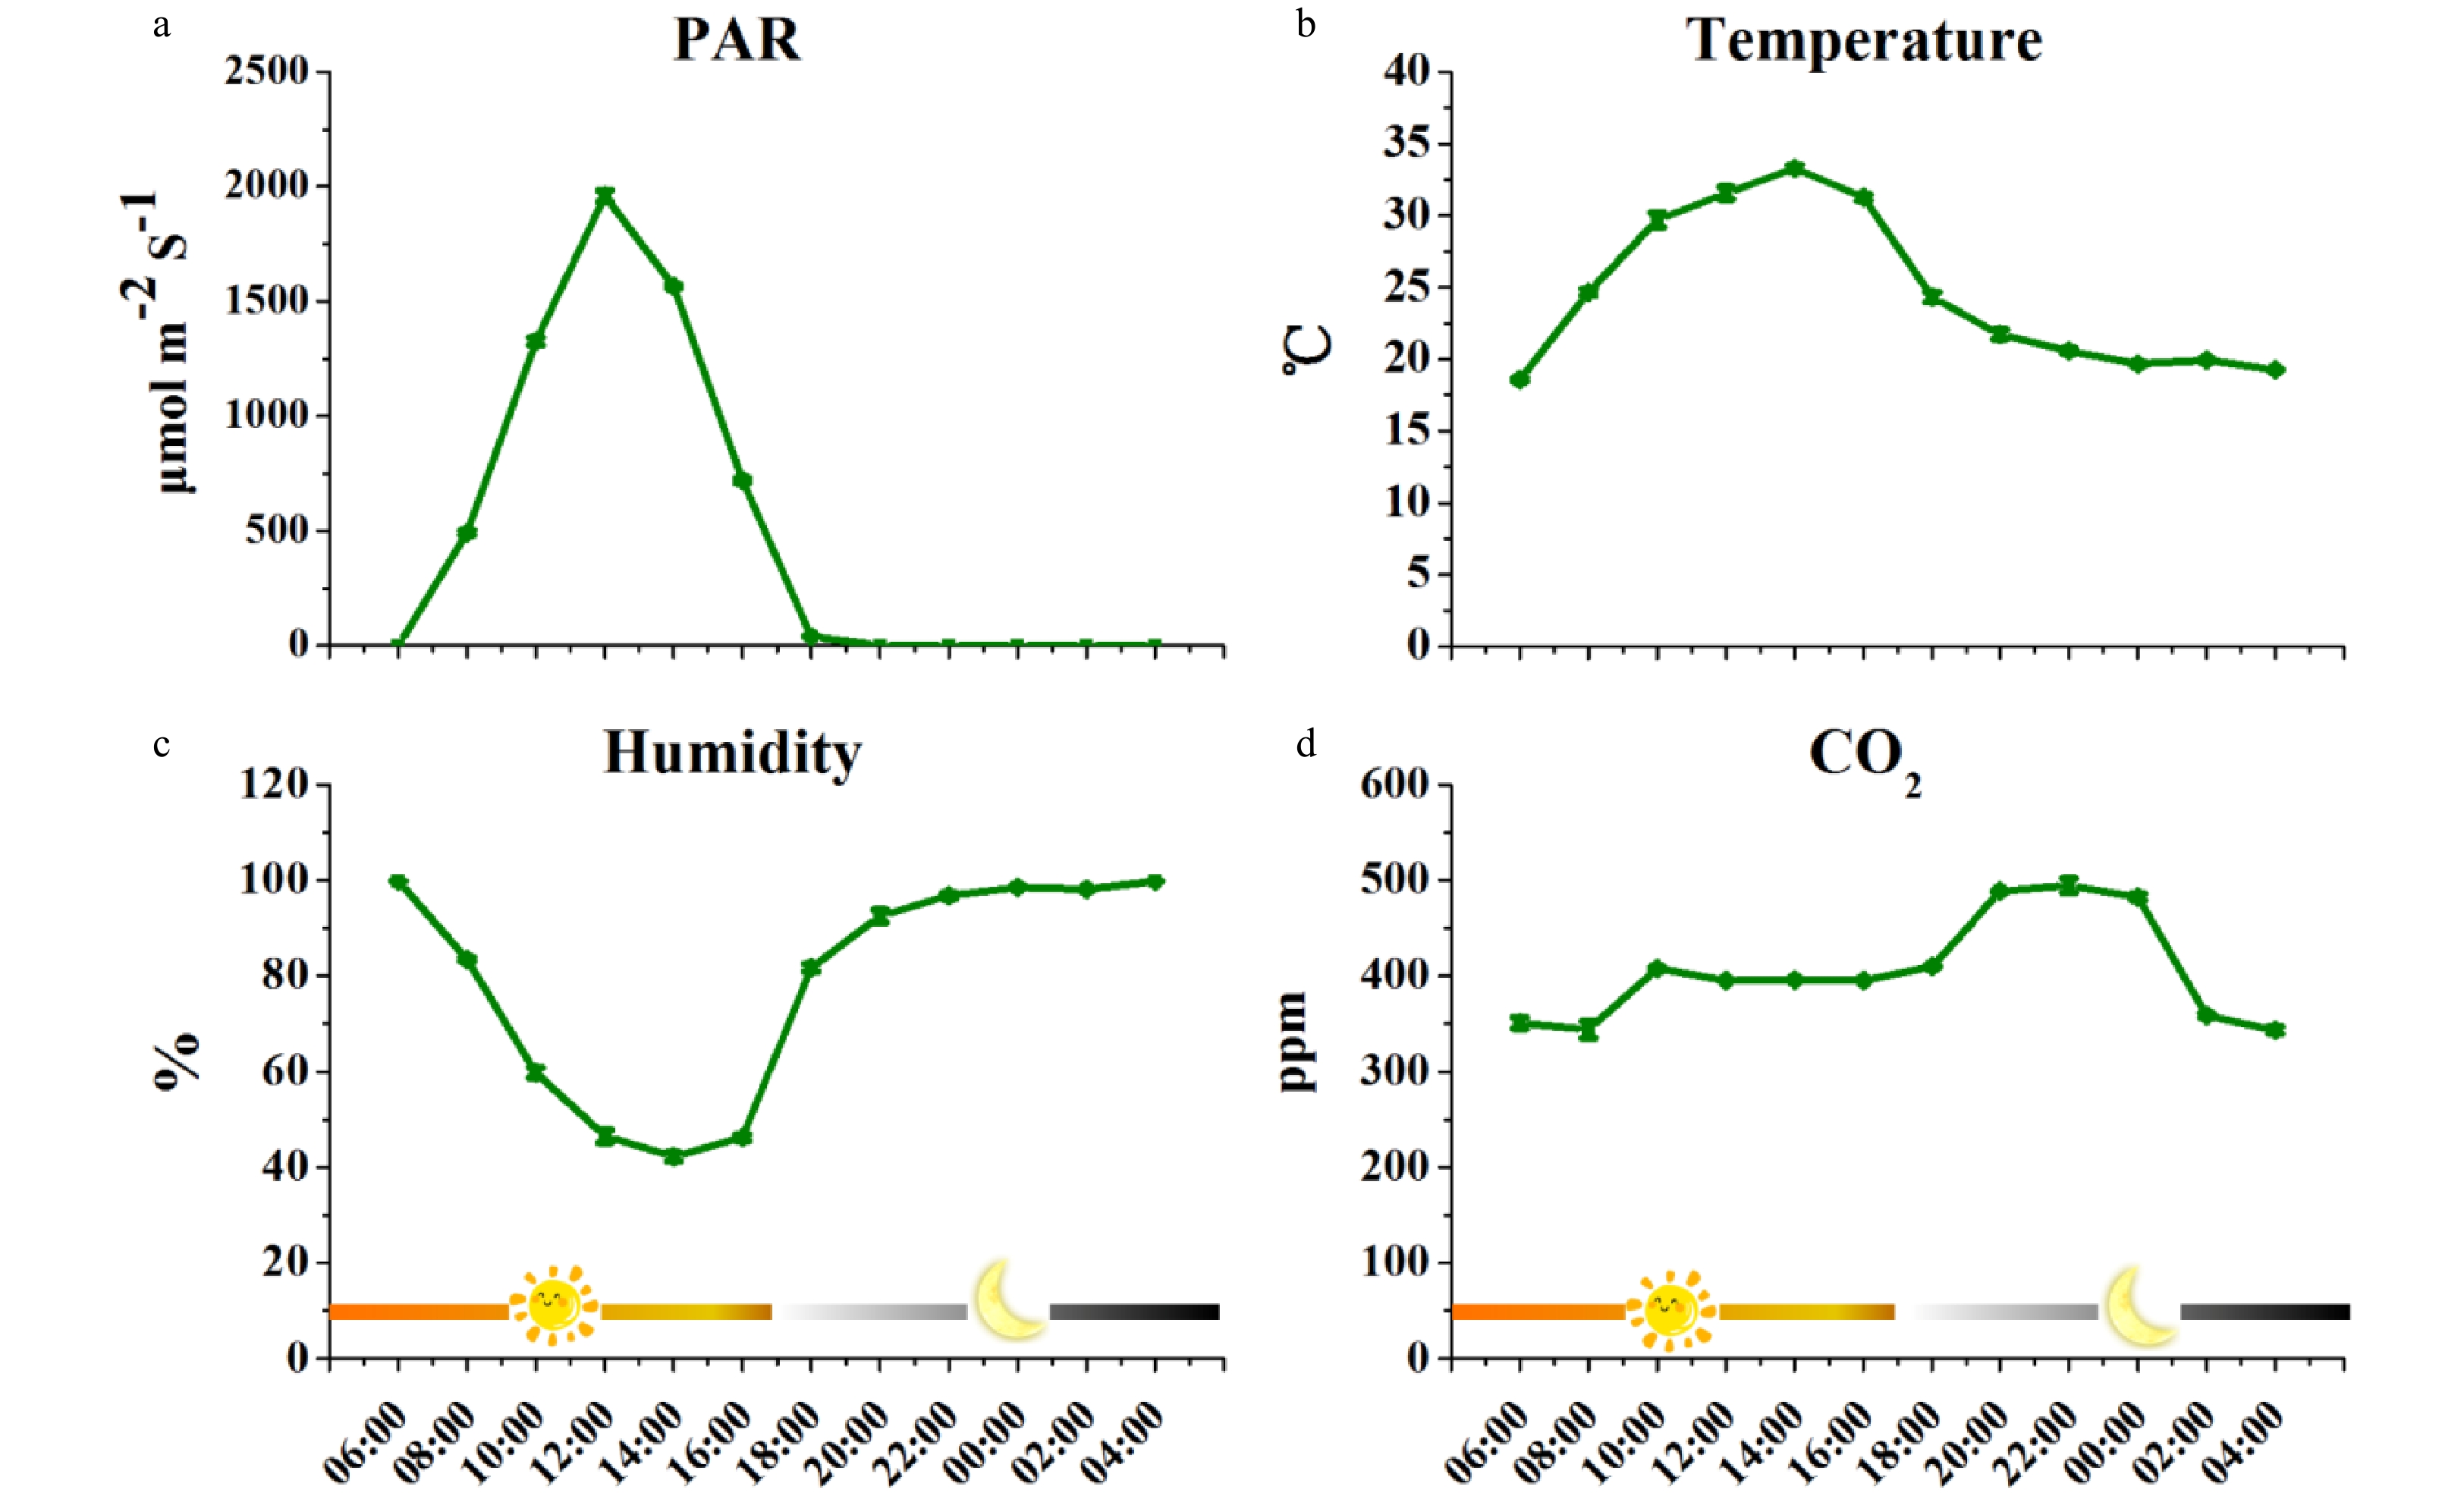
Figure 1. The changes of environmental factors during the sampling period in tea plantation. (a) PAR changes during the sampling period; (b) Temperature changes during the sampling period; (c) Humidity changes during the sampling period. (d) CO2 changes during the sampling period. Data were successively collected every 2 h during the 48-h-sampling period from the 16th to the 18th of September 2017 (n = 6). PAR, Photosynthetic Actively Radiation.
-
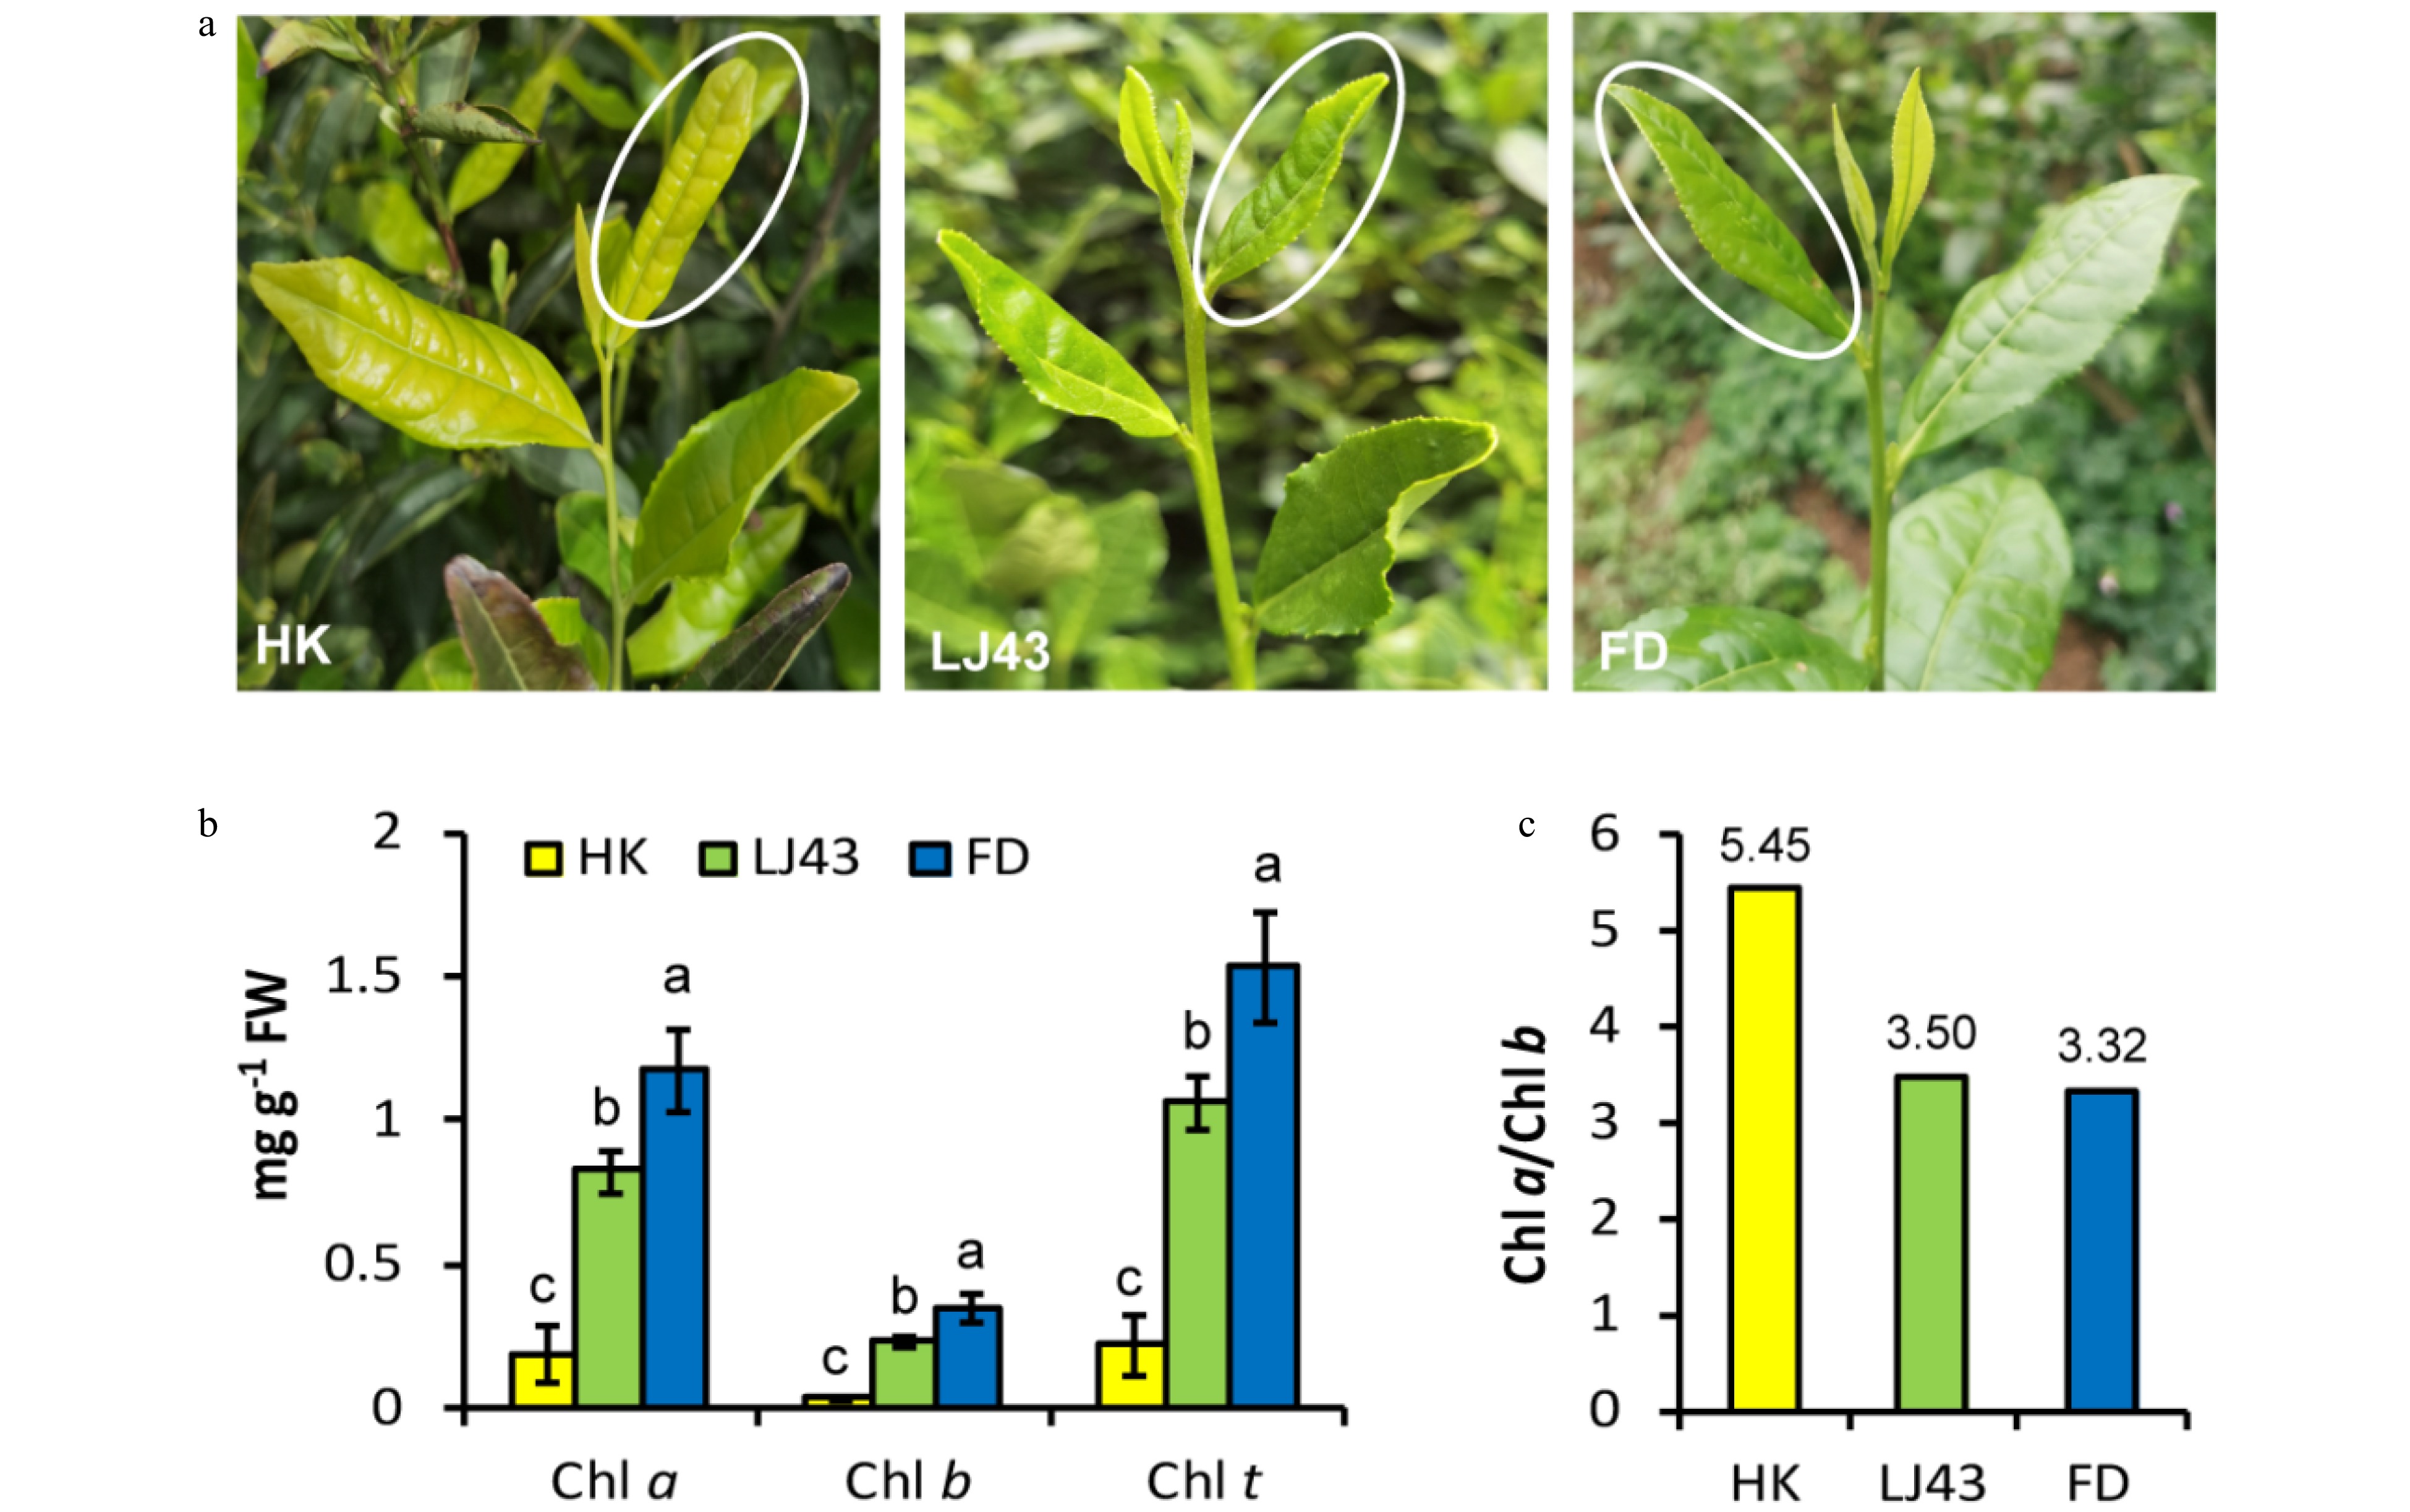
Figure 2. Phenotypes and chlorophyll content in tender leaves of three tea cultivars. (a) Tender leaves of three tea cultivars were used in this study; (b) Chlorophyll content in tender leaves of three tea cultivars; (c) The ratio of Chl a to Chl b in tender leaves of three tea cultivars. 'HK', 'Huangkui'; 'LJ43', 'Longjing43'; 'FD', 'Fuding Dabaicha'; Chl a, chlorophyll a; Chl b, chlorophyll b; Chl t, total chlorophylls. Error bars represent the SE (n = 3). Letters (a, b, c) show significant differences and grouping information according to one-way ANOVA and a Fisher's LSD test at the 5% level.
-
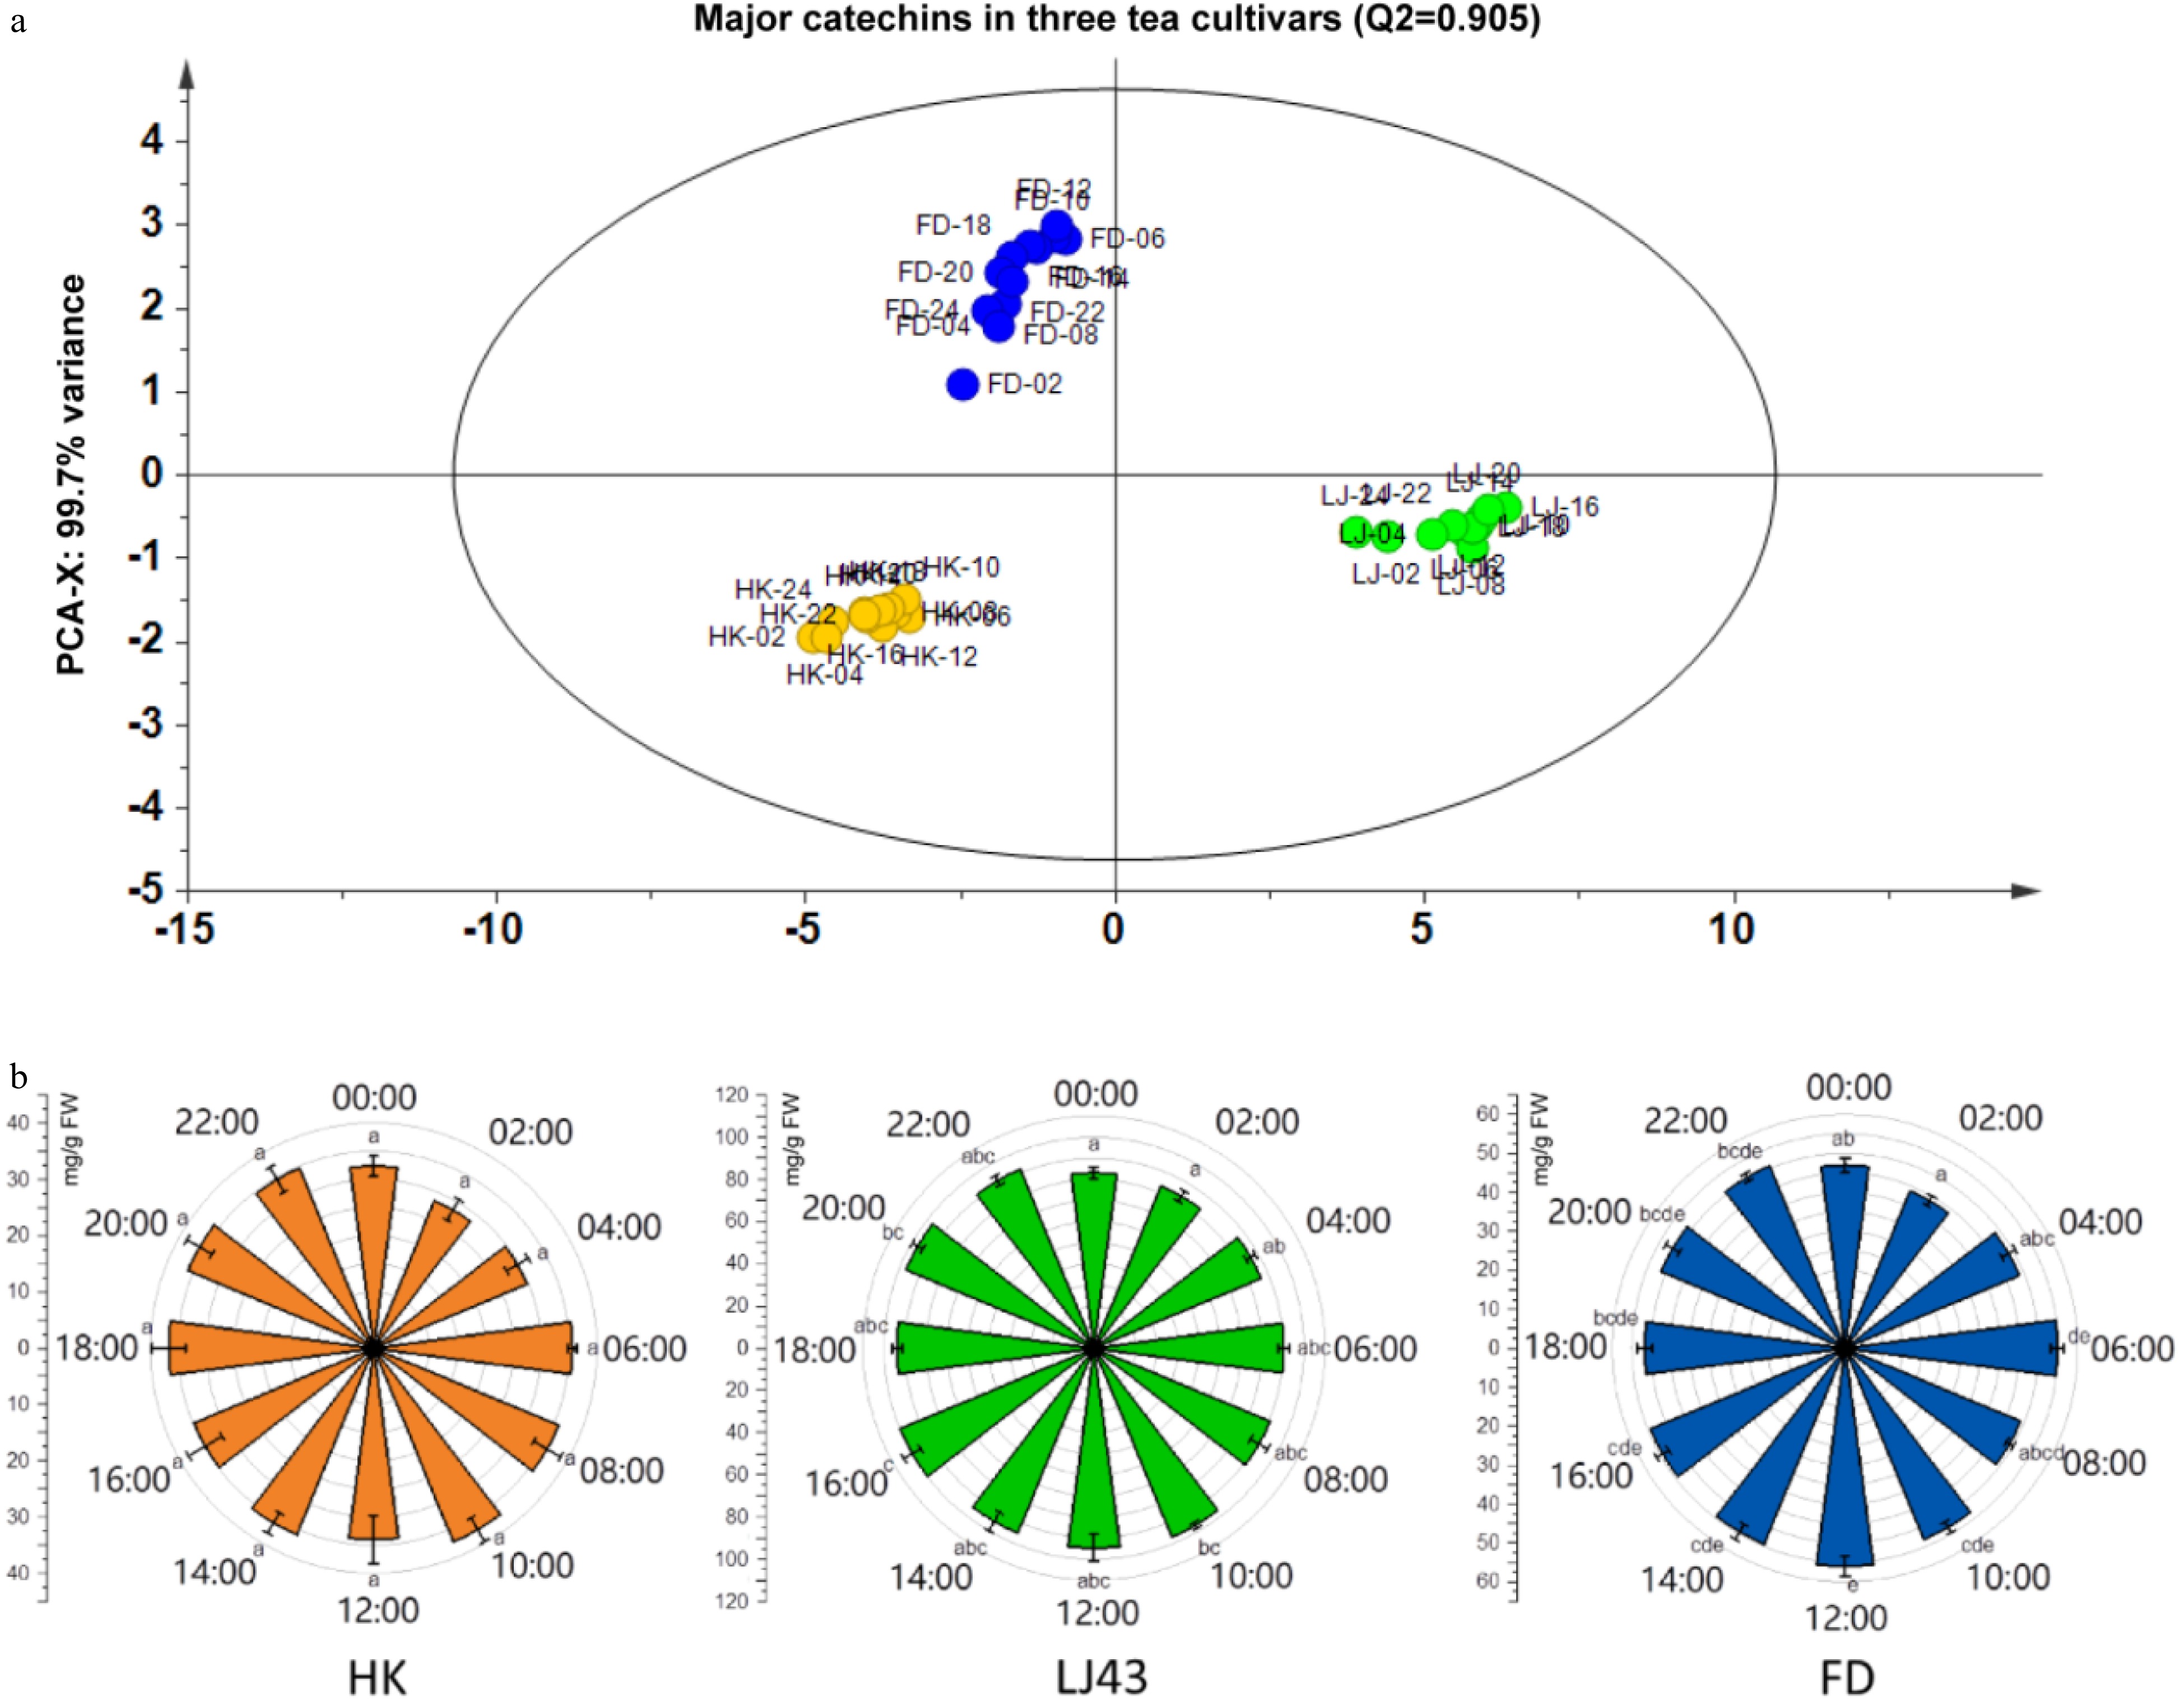
Figure 3. Cultivar-specific regulation and circadian rhythm effects on total catechins in tea plants. (a) PCA analysis of catechins in tender leaves of three tea cultivars; (b) The effects of flavonoids in tender leaves among three cultivars. 'HK', 'Huangkui'; 'LJ43', 'Longjing43'; 'FD', 'Fuding Dabaicha'. Error bars represent the standard error (n = 6). Letters (a, b, c, d, e) show significant differences and grouping information according to one-way ANOVA and a Fisher's LSD test at the 5% level.
-
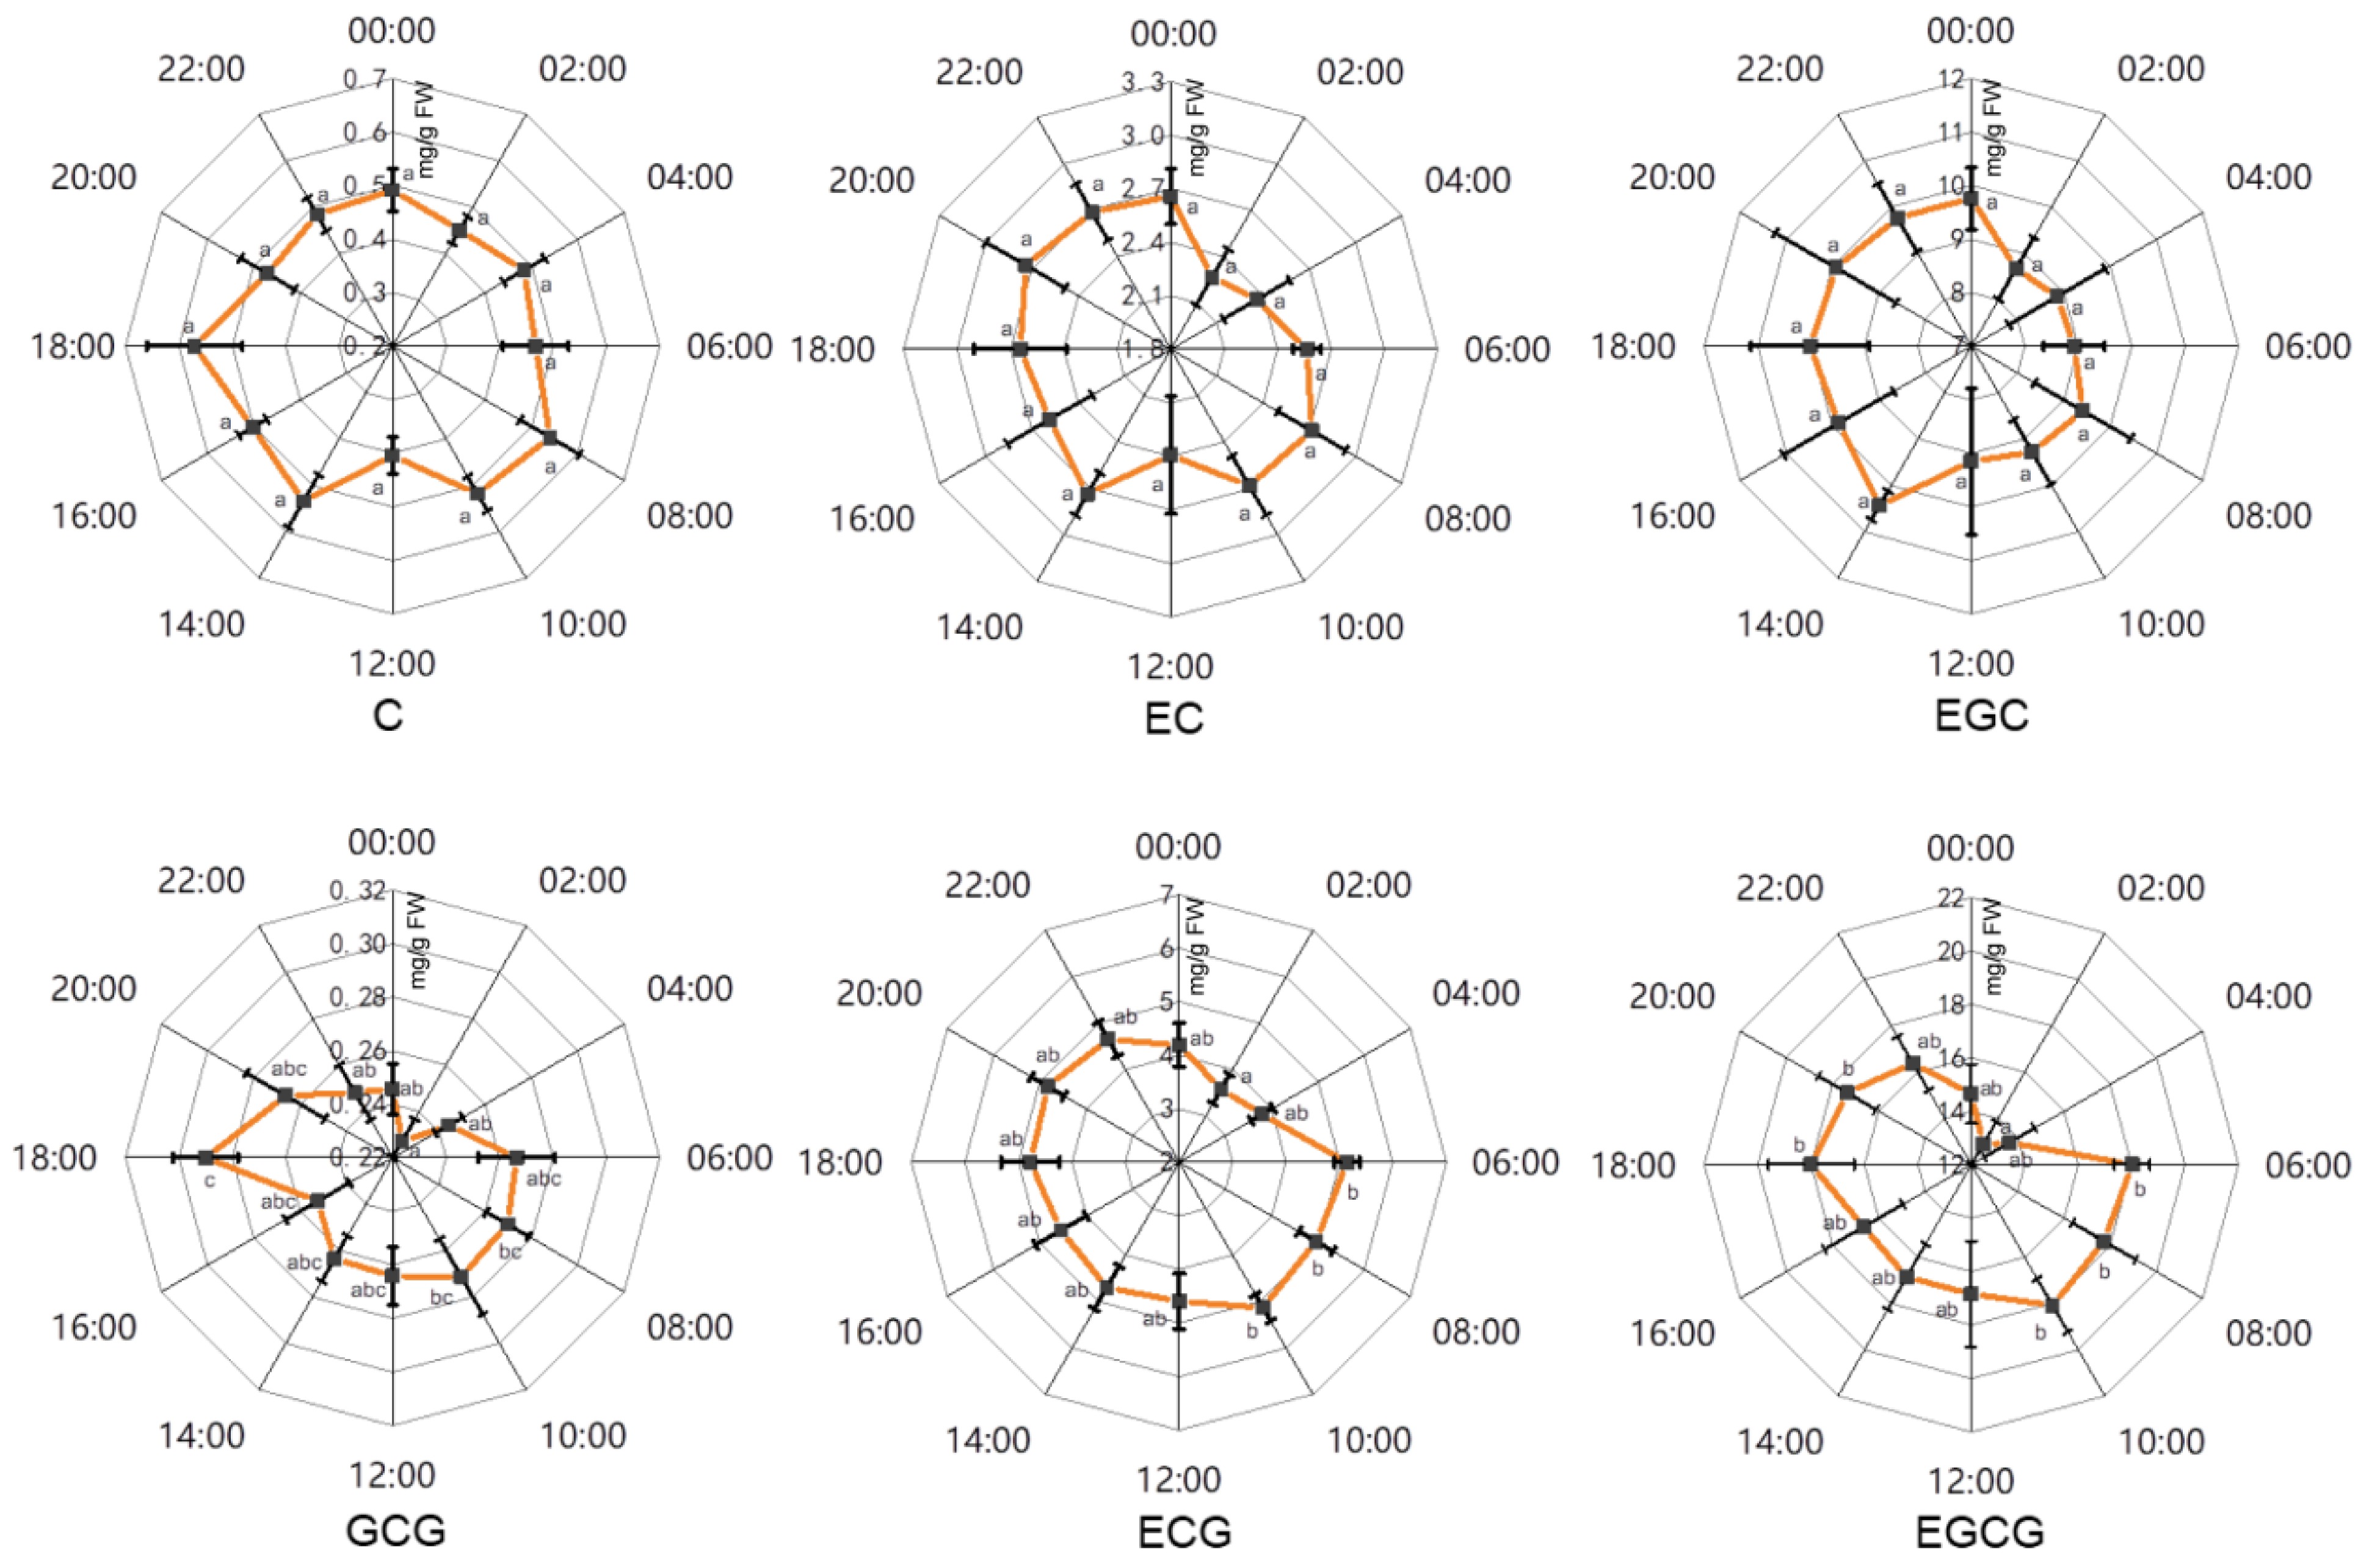
Figure 4. The effects of circadian rhythm on major catechins in tender leaves of 'HK'. C, catechin; EC, epicatechin; EGC, epigallocatechin; GCG, gallocatechin 3-O-gallate; ECG, epicatechin 3-O-gallate; EGCG, epigallocatechin 3-O-gallate. Error bars represent the standard error (n = 6). Letters (a, b, c) show significant differences and grouping information according to one-way ANOVA and a Fisher's LSD test at the 5% level.
-
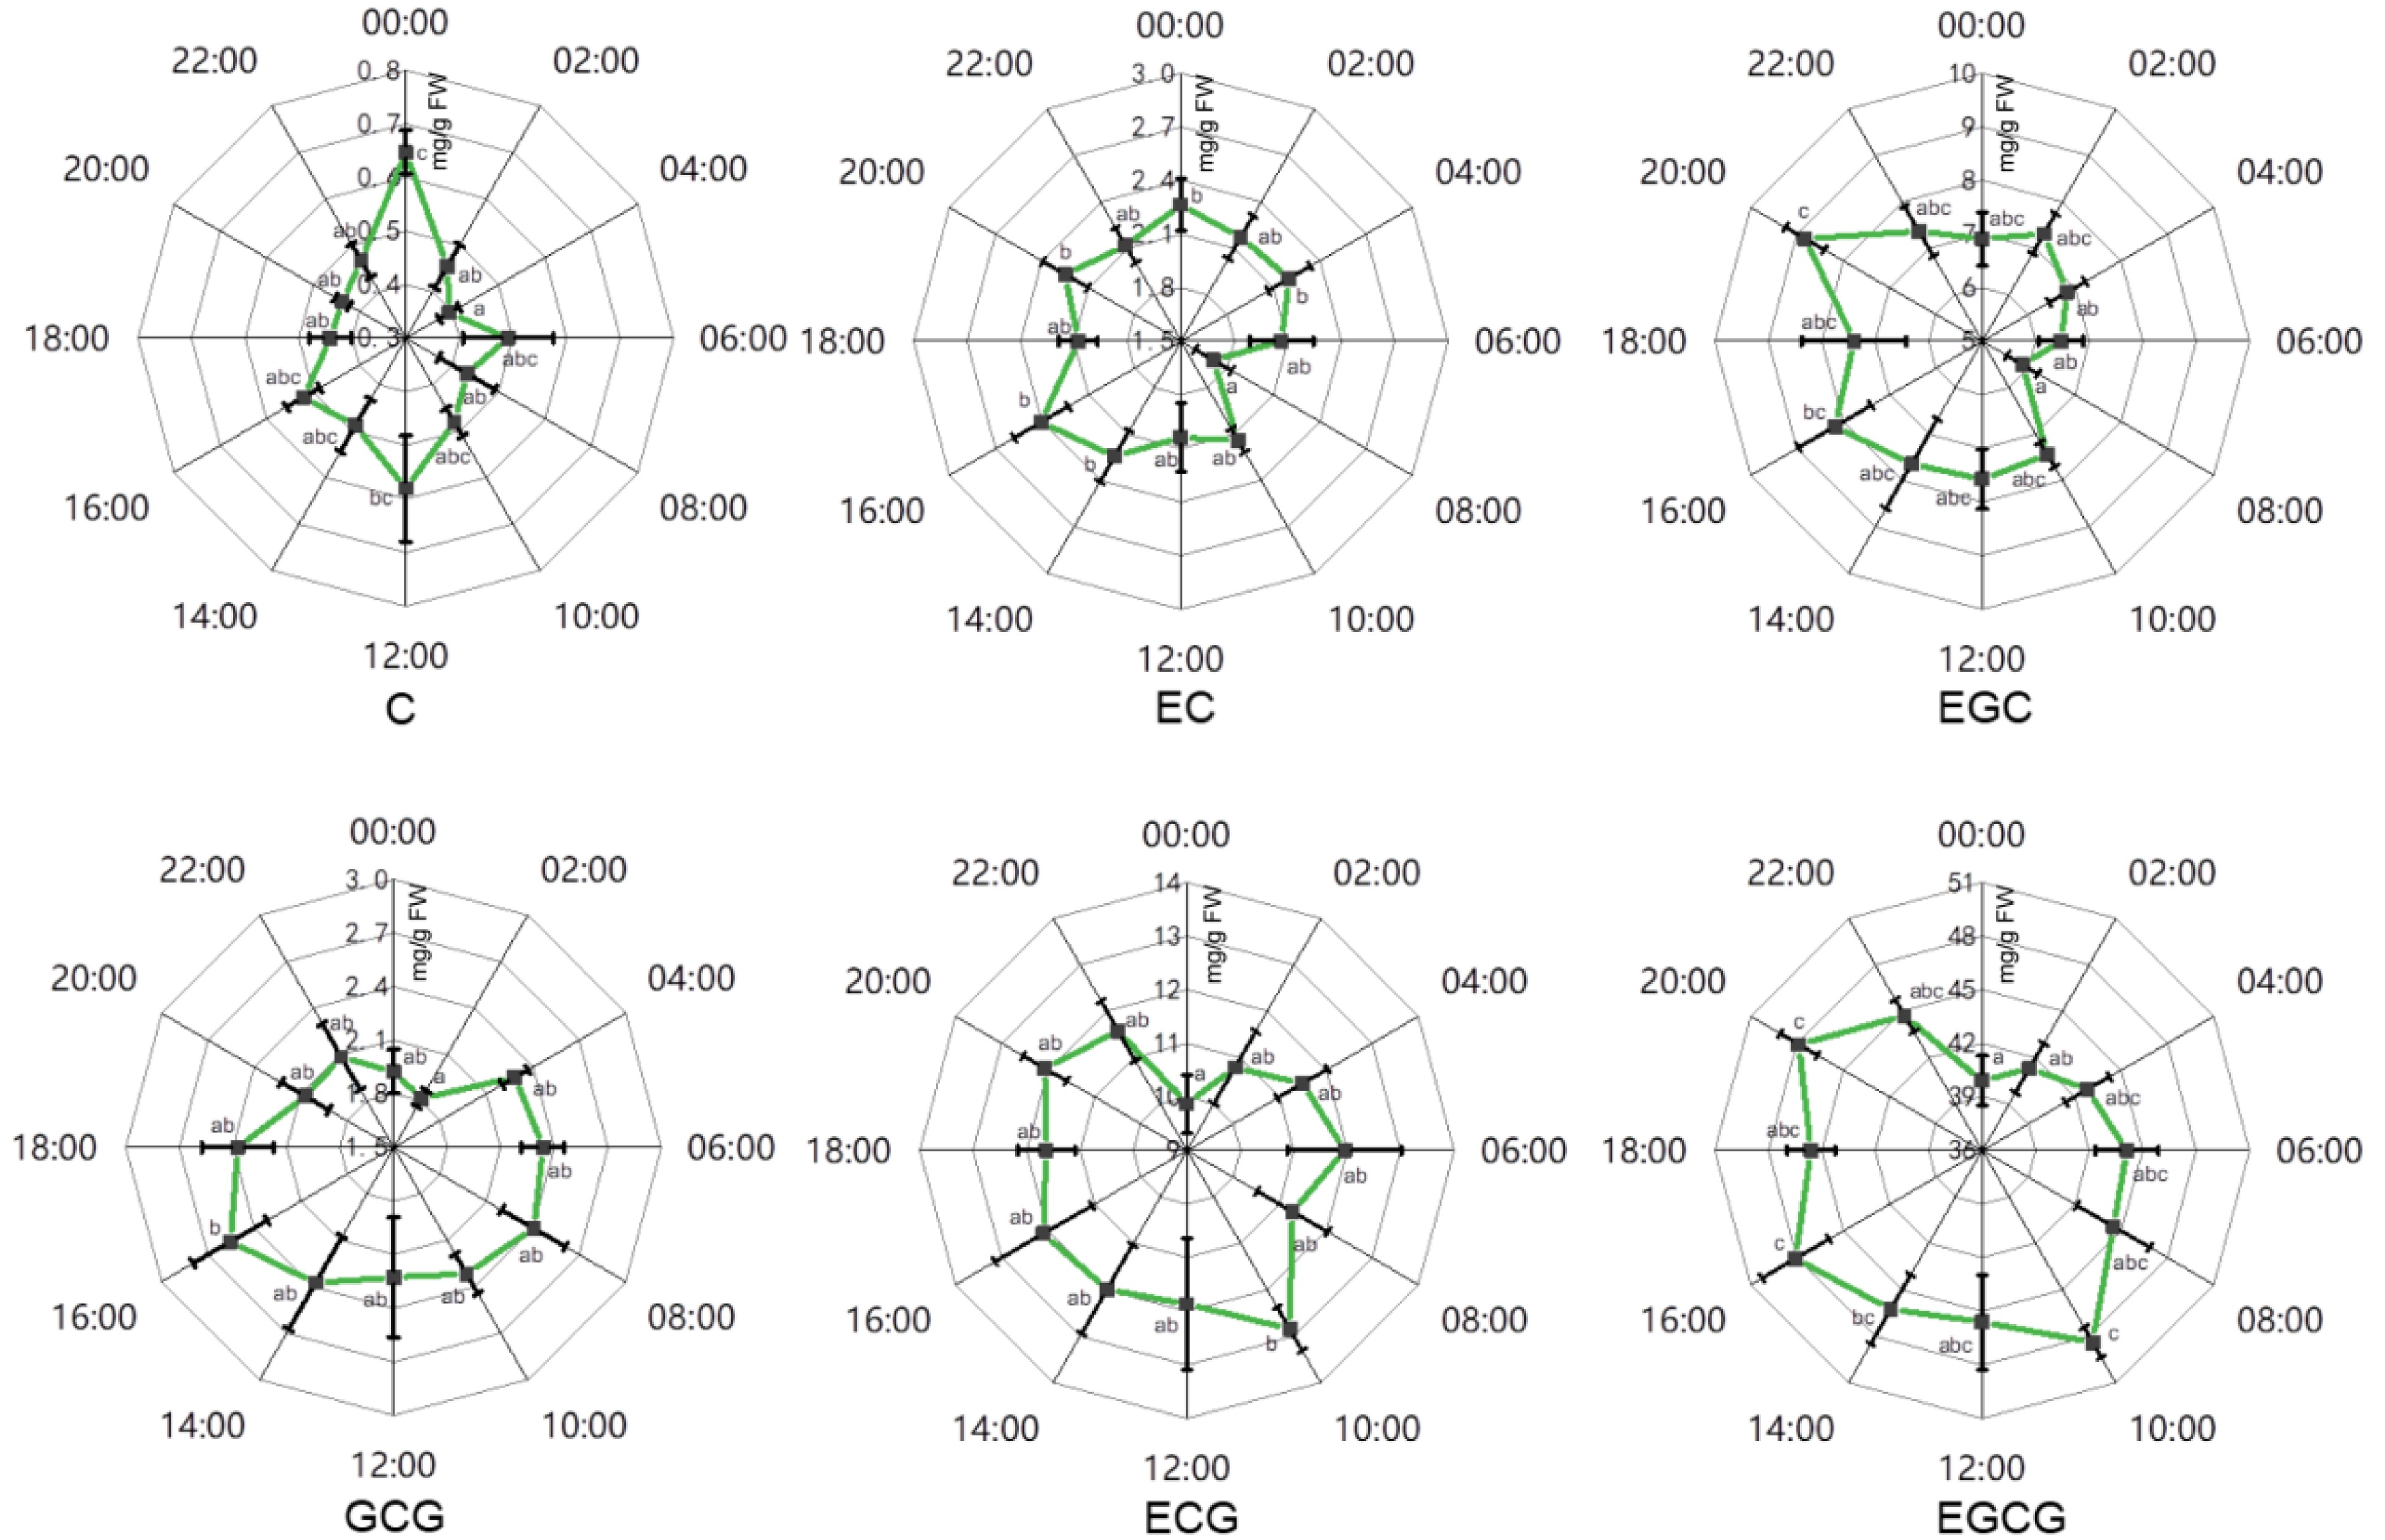
Figure 5. The effects of circadian rhythm on major catechins in tender leaves of 'LJ43'. C, catechin; EC, epicatechin; EGC, epigallocatechin; GCG, gallocatechin 3-O-gallate; ECG, epicatechin 3-O-gallate; EGCG, epigallocatechin 3-O-gallate. Error bars represent the standard error (n = 6). Letters (a, b, c) show significant differences and grouping information according to one-way ANOVA and a Fisher's LSD test at the 5% level.
-
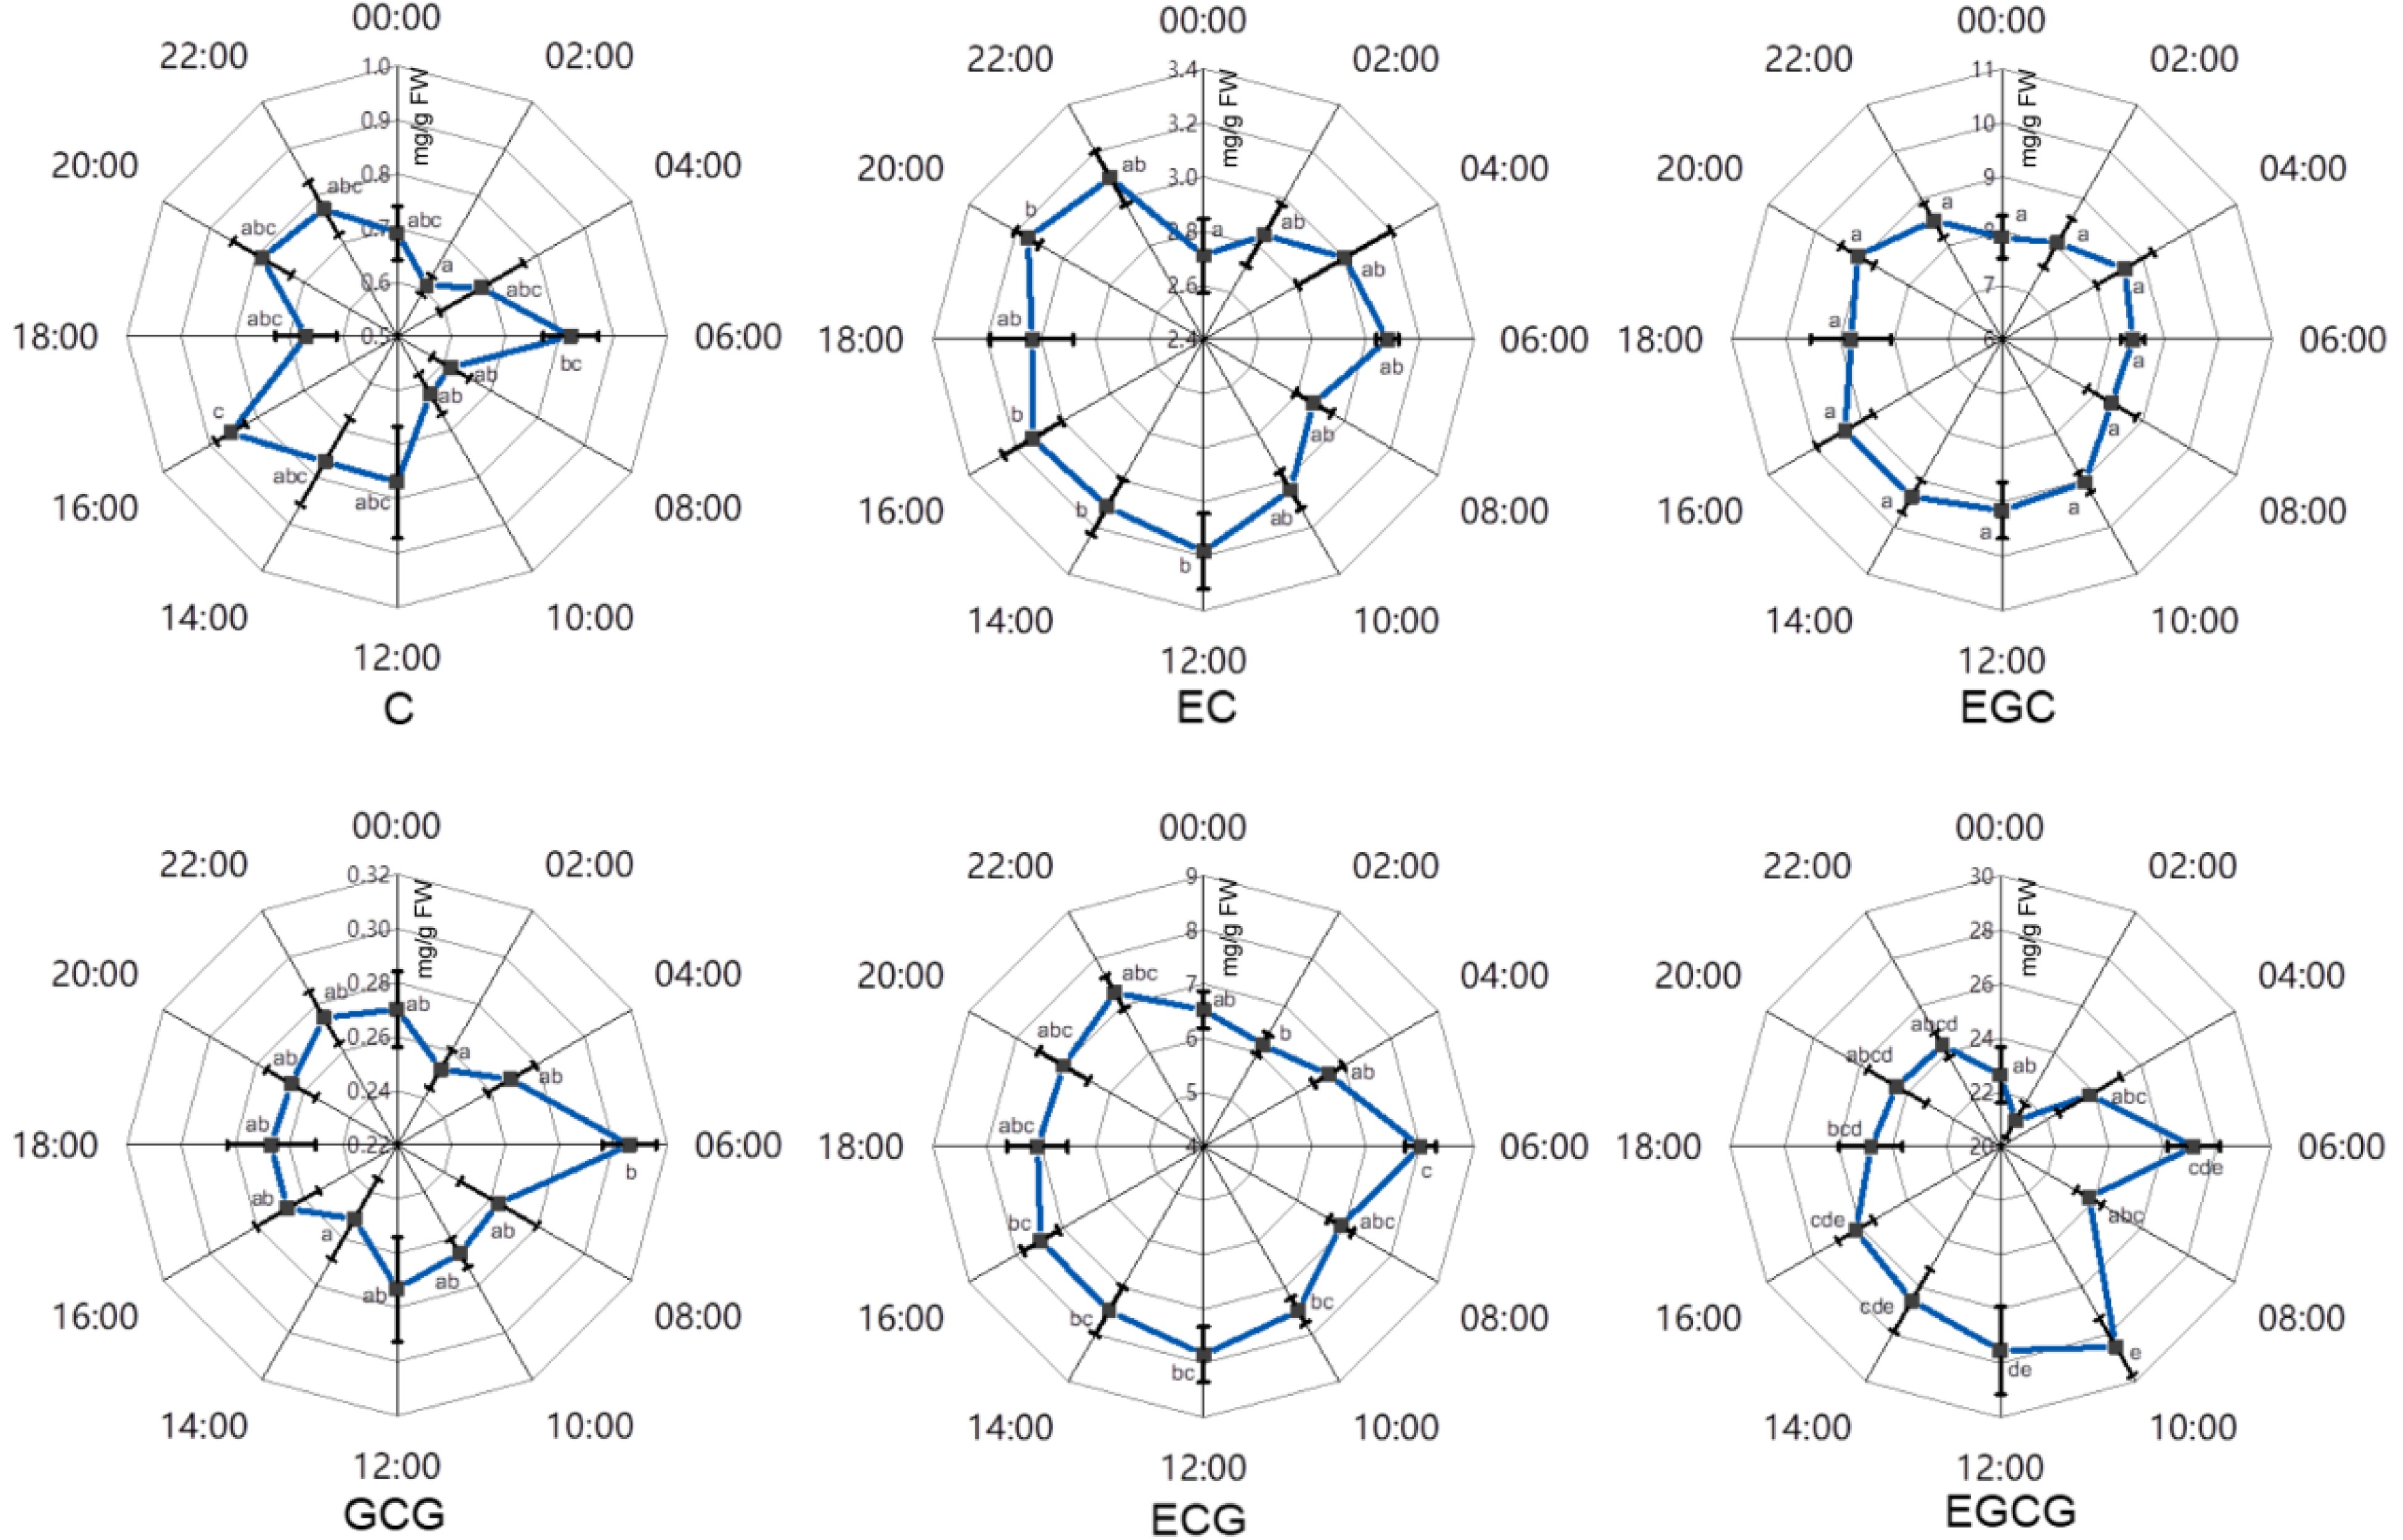
Figure 6. The effects of circadian rhythm on major catechins in tender leaves of 'FD'. C, catechin; EC, epicatechin; EGC, epigallocatechin; GCG, gallocatechin 3-O-gallate; ECG, epicatechin 3-O-gallate; EGCG, epigallocatechin 3-O-gallate. Error bars represent the standard error (n = 6). Letters (a, b, c, d, e) show significant differences and grouping information according to one-way ANOVA and a Fisher's LSD test at the 5% level.
-
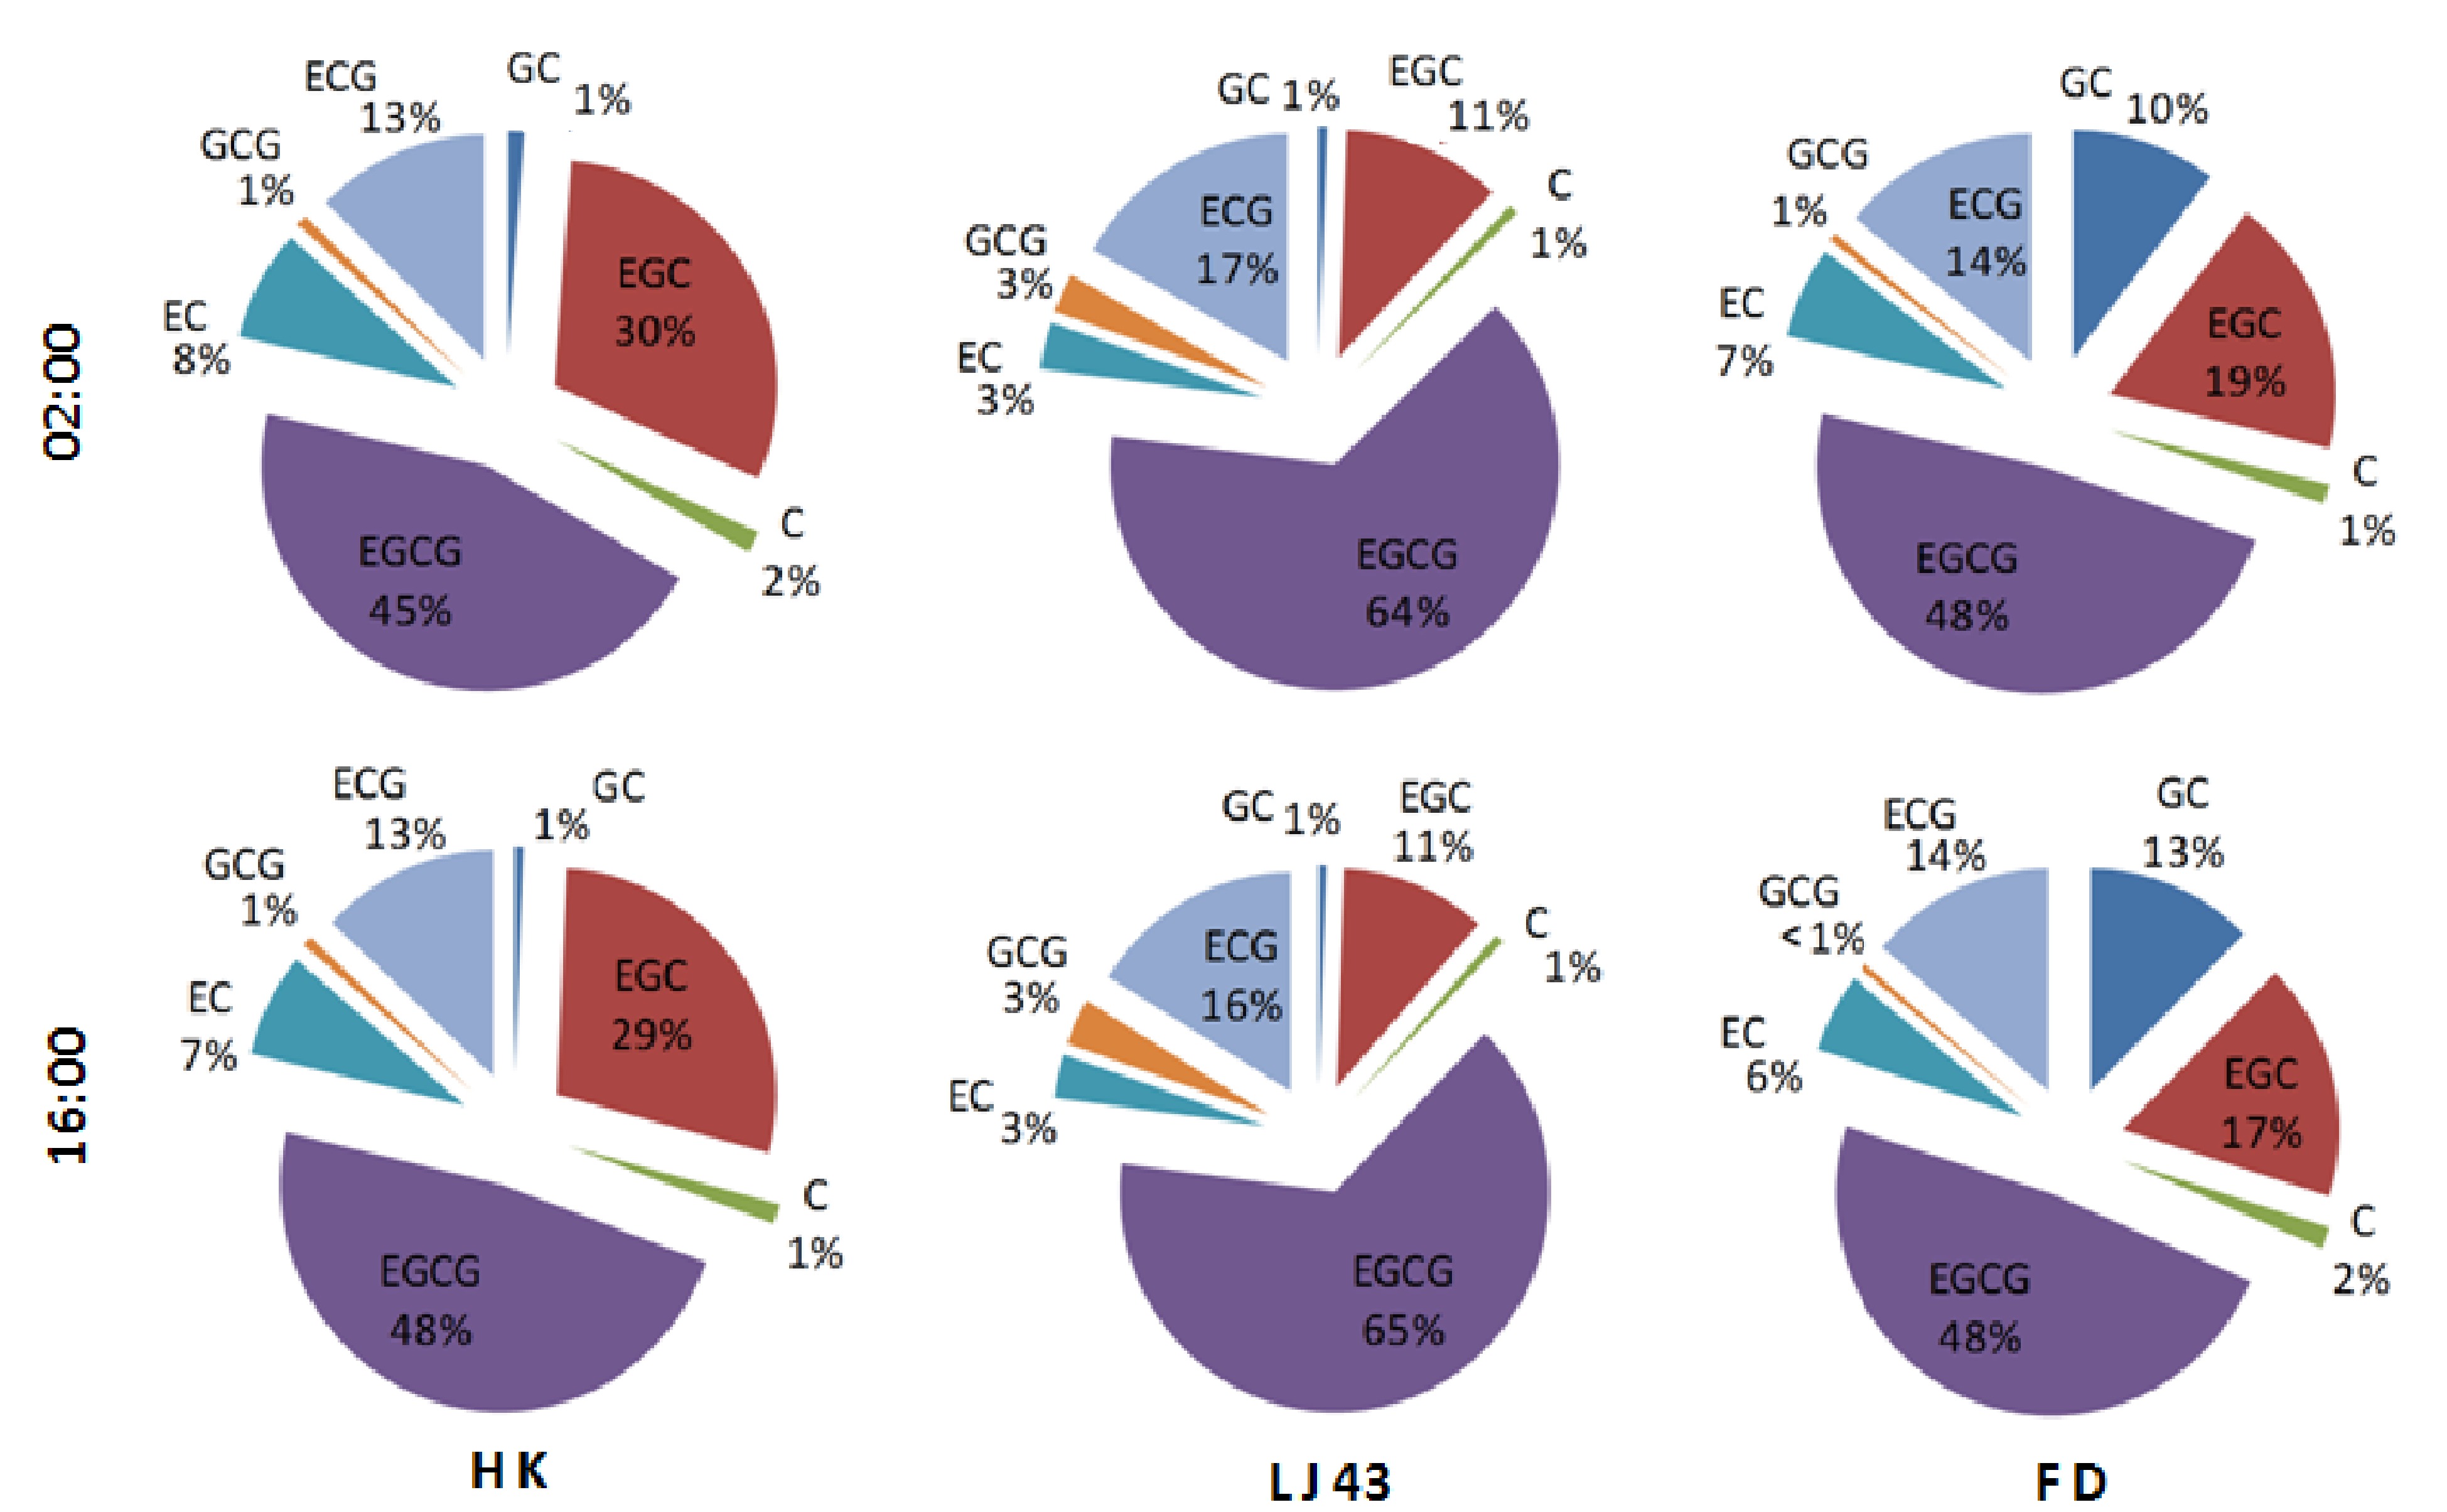
Figure 7. The composition of catechins in tender leaves at 02:00 and 16:00 among three tea cultivars. 'HK', 'Huangkui'; 'LJ43', 'Longjing43'; 'FD', 'Fuding Dabaicha'. ECG, epicatechin 3-O-gallate; EGC, epigallocatechin; C, catechin; GCG, gallocatechin 3-O-gallate; EC, epicatechin; EGCG, epigallocatechin 3-O-gallate.
-
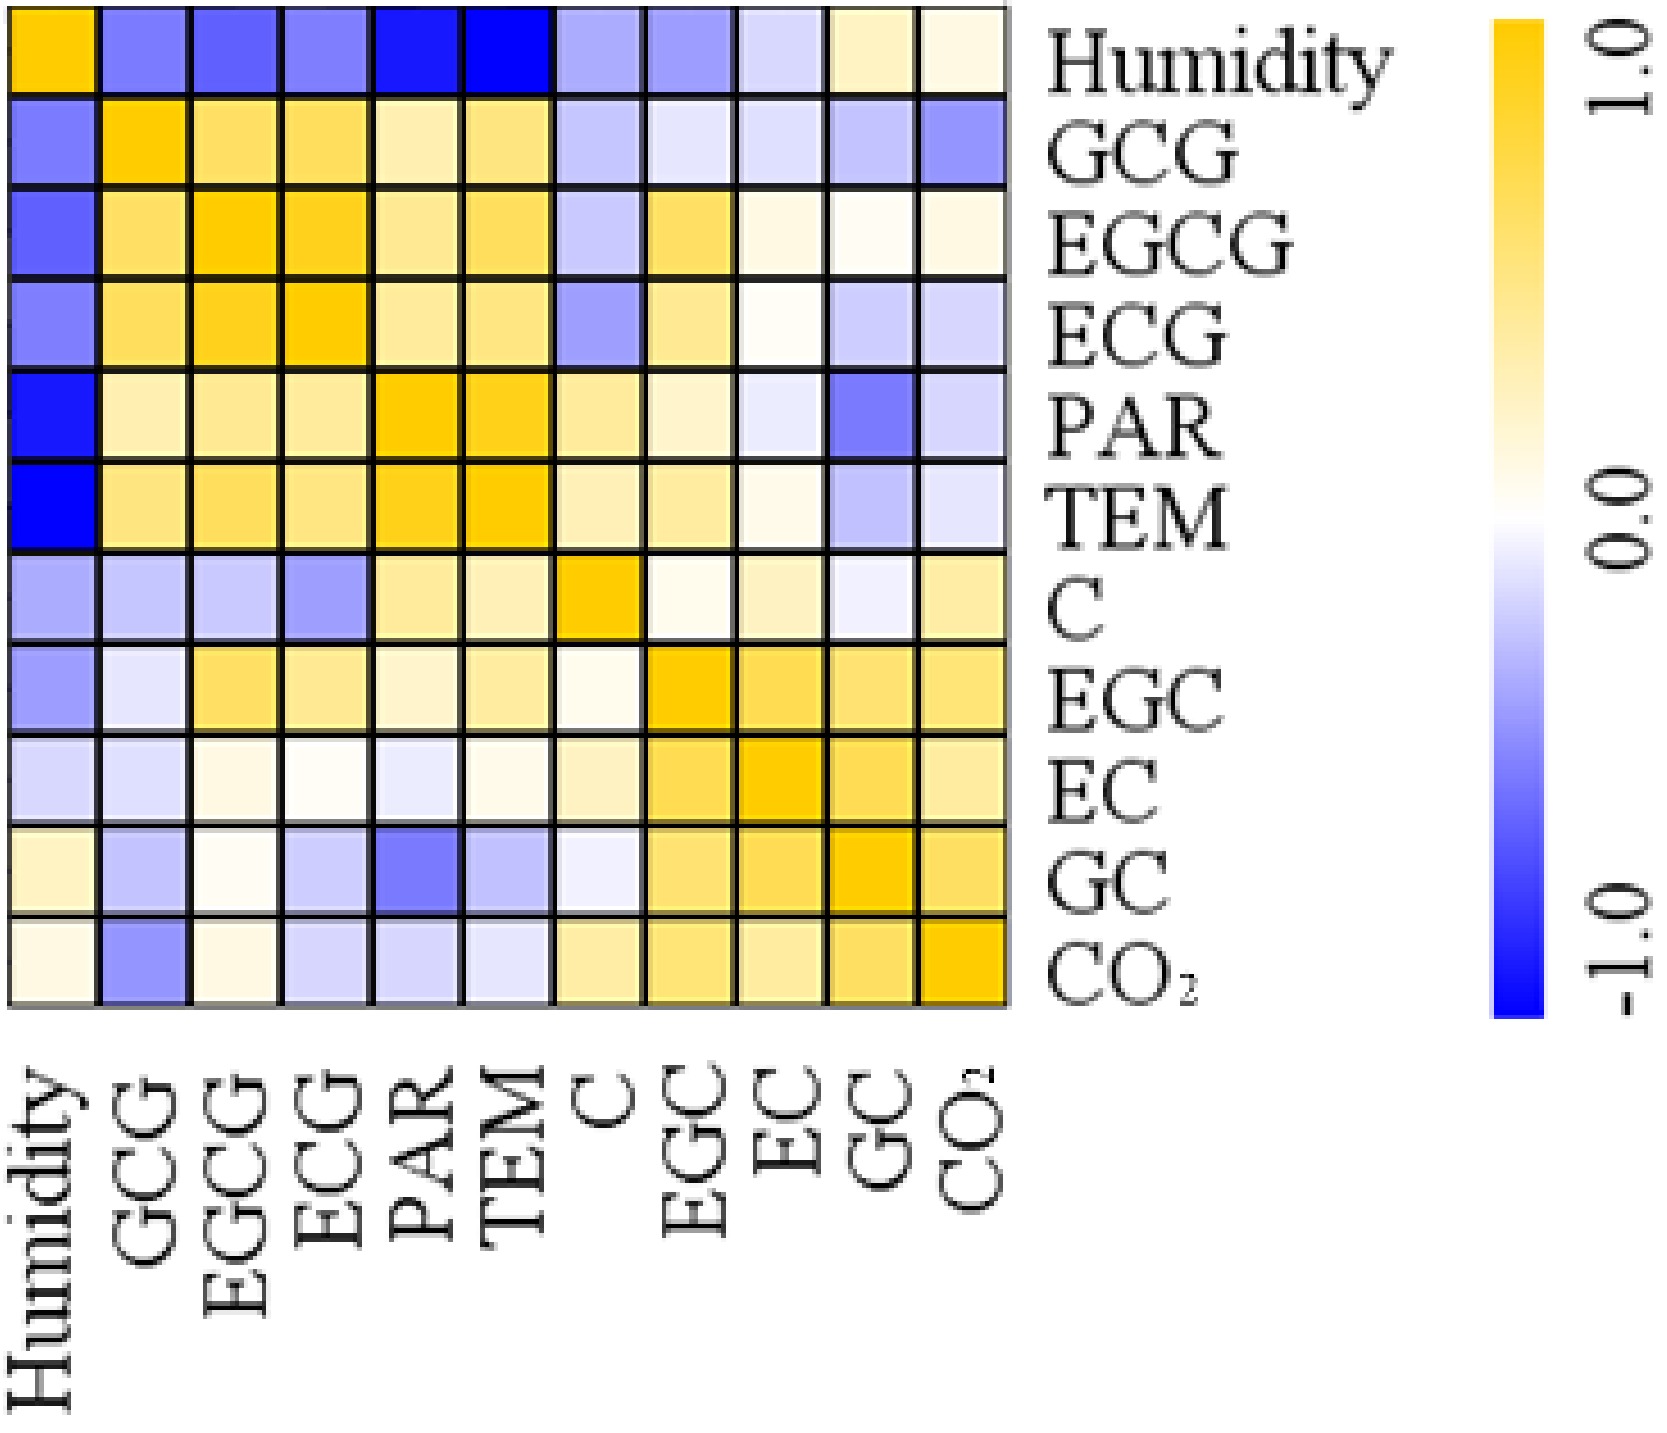
Figure 8. Correlation analysis between catechins and environmental factors. EGC, epigallocatechin; C, catechin; EC, epicatechin; GC, gallocatechin; ECG, epicatechin 3-O-gallate; GCG, gallocatechin 3-O-gallate; EGCG, epigallocatechin 3-O-gallate; PAR, Photosynthetic Actively Radiation; TEM, temperature.
Figures
(8)
Tables
(0)