-
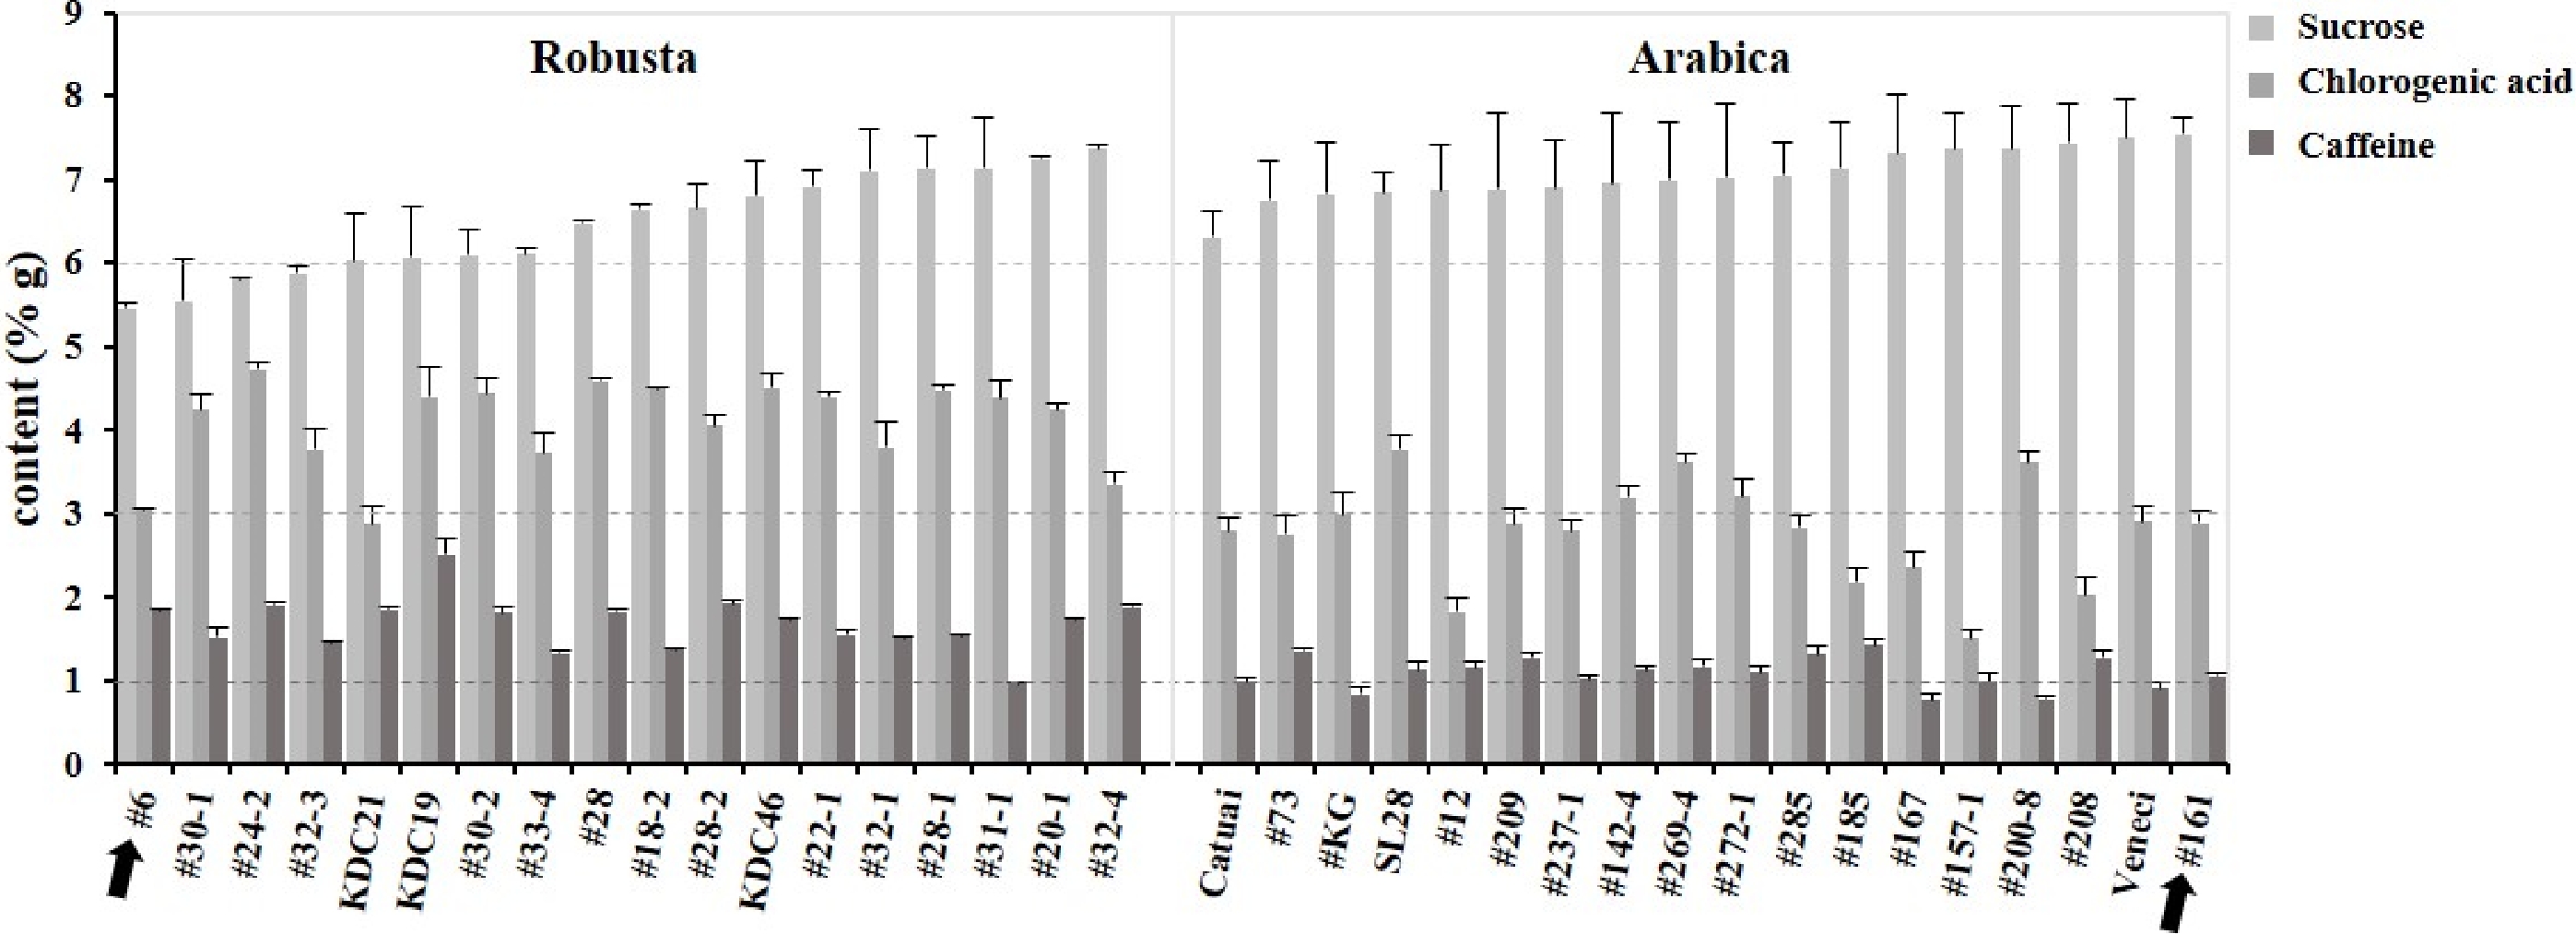
Figure 1. Content of sucrose, caffeine and chlorogenic acid in 18 Robusta and Arabica varieties.
-
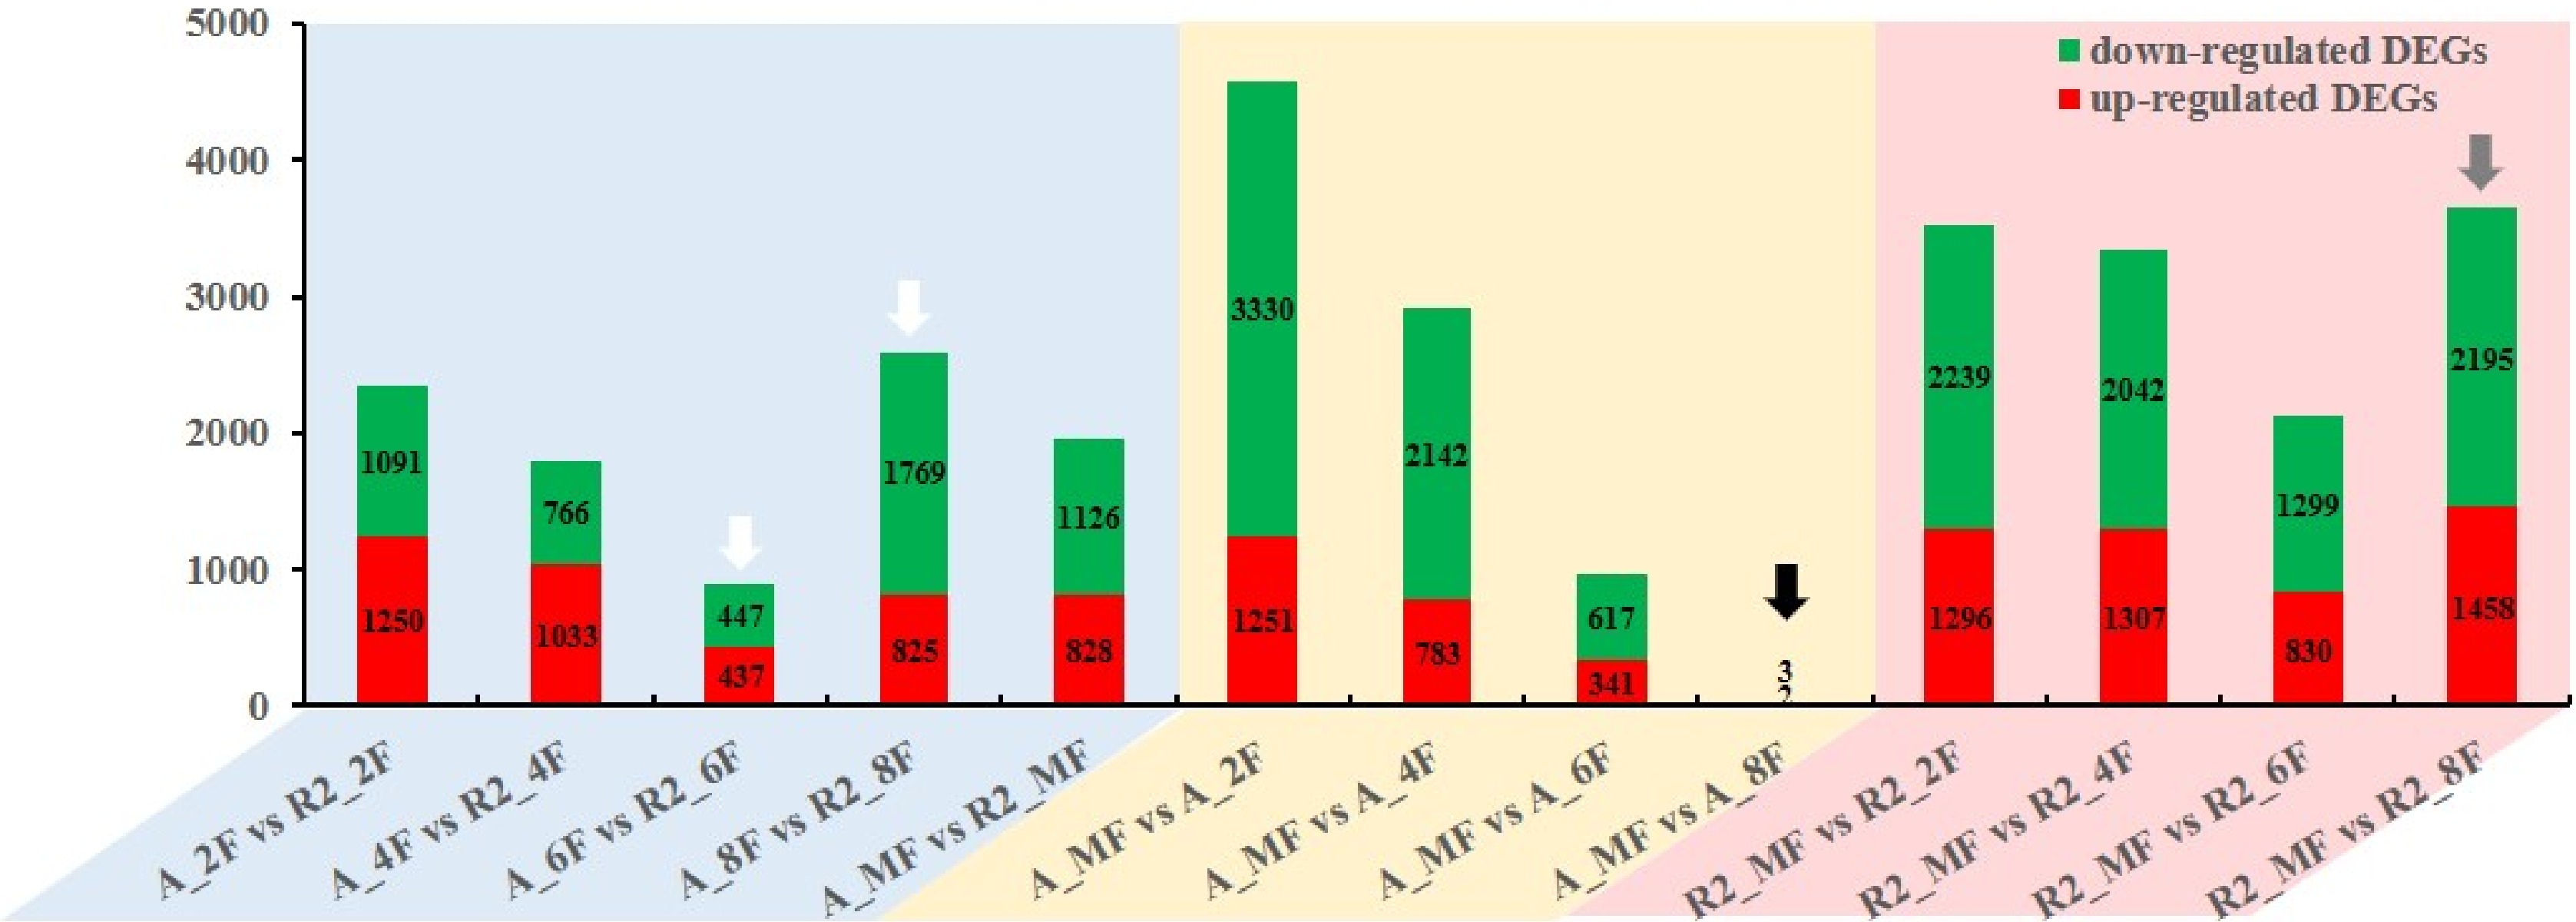
Figure 2. Number of DEGs at different developmental stages in A161 and R6.
-
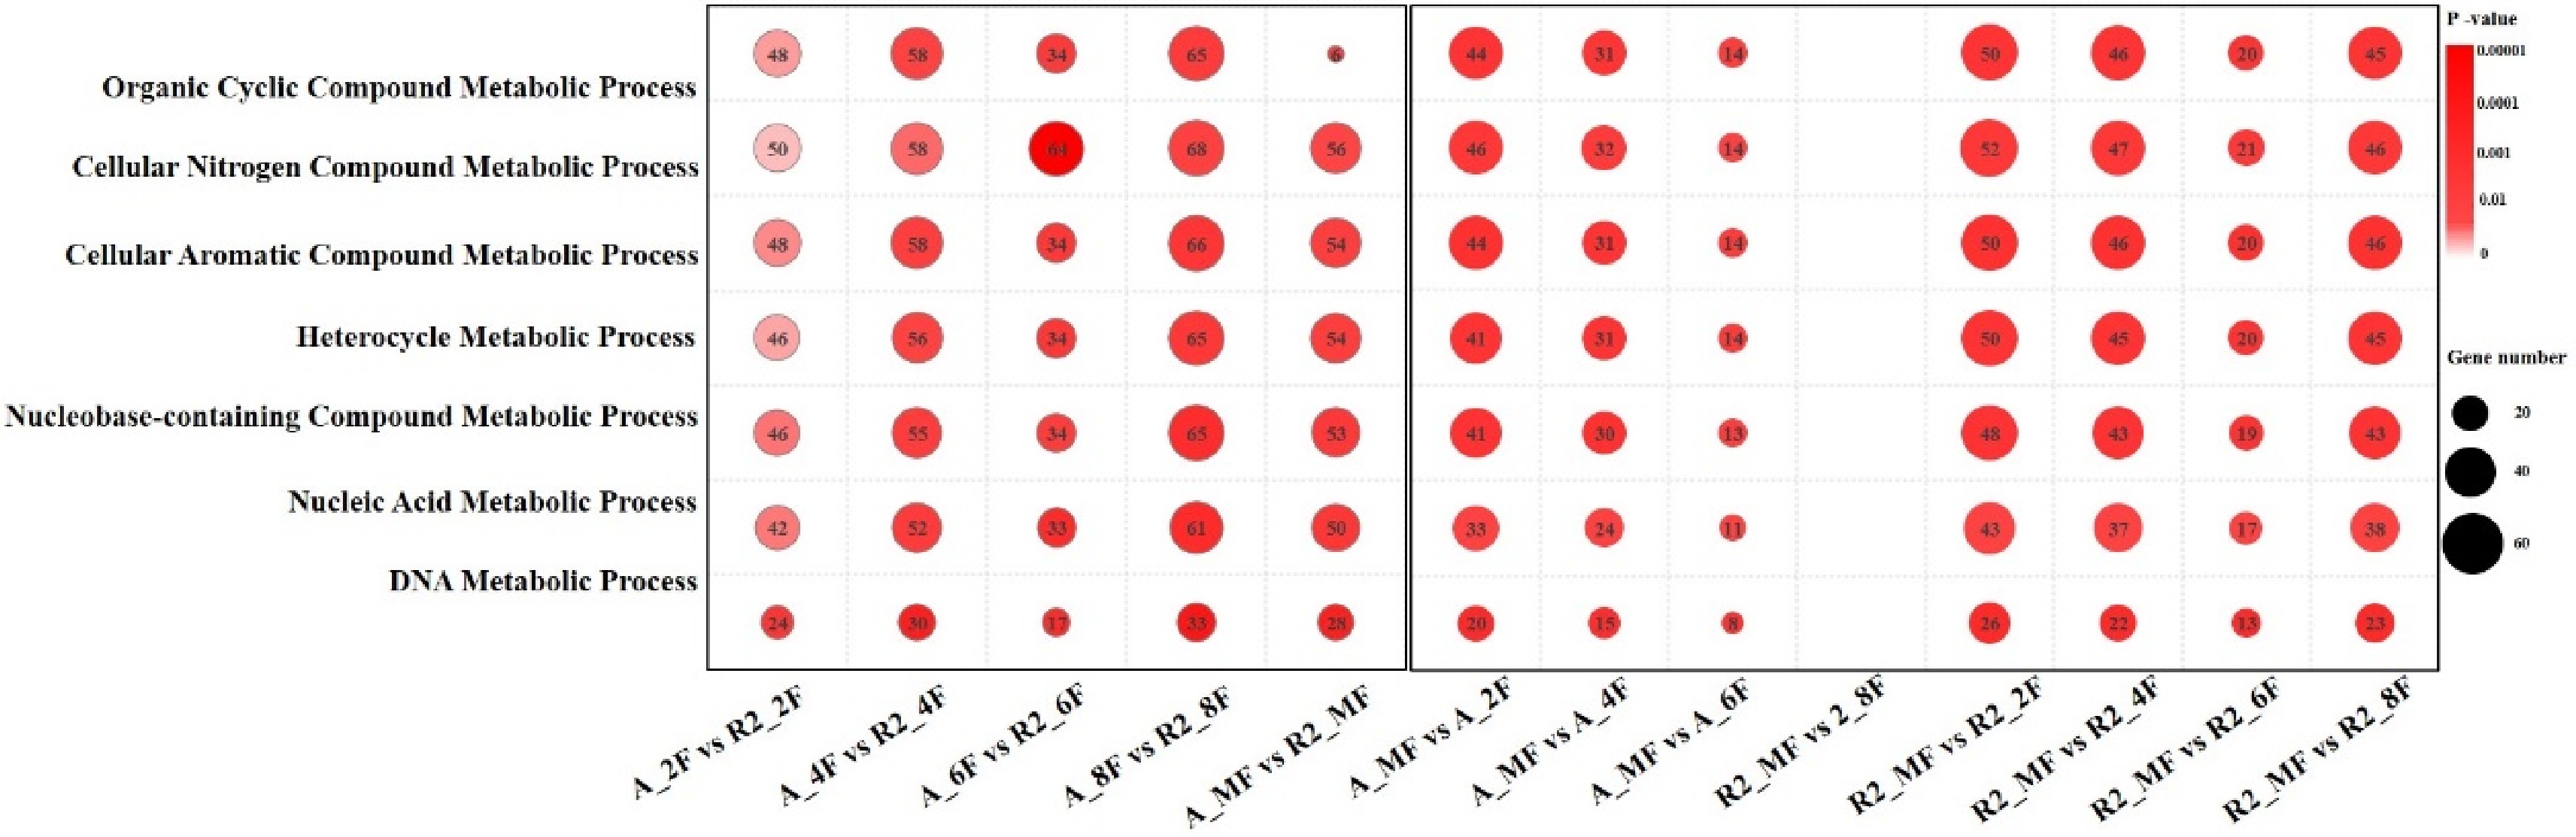
Figure 3. Seven biological processes of GO terms enriched by most significantly different DEGs.
-
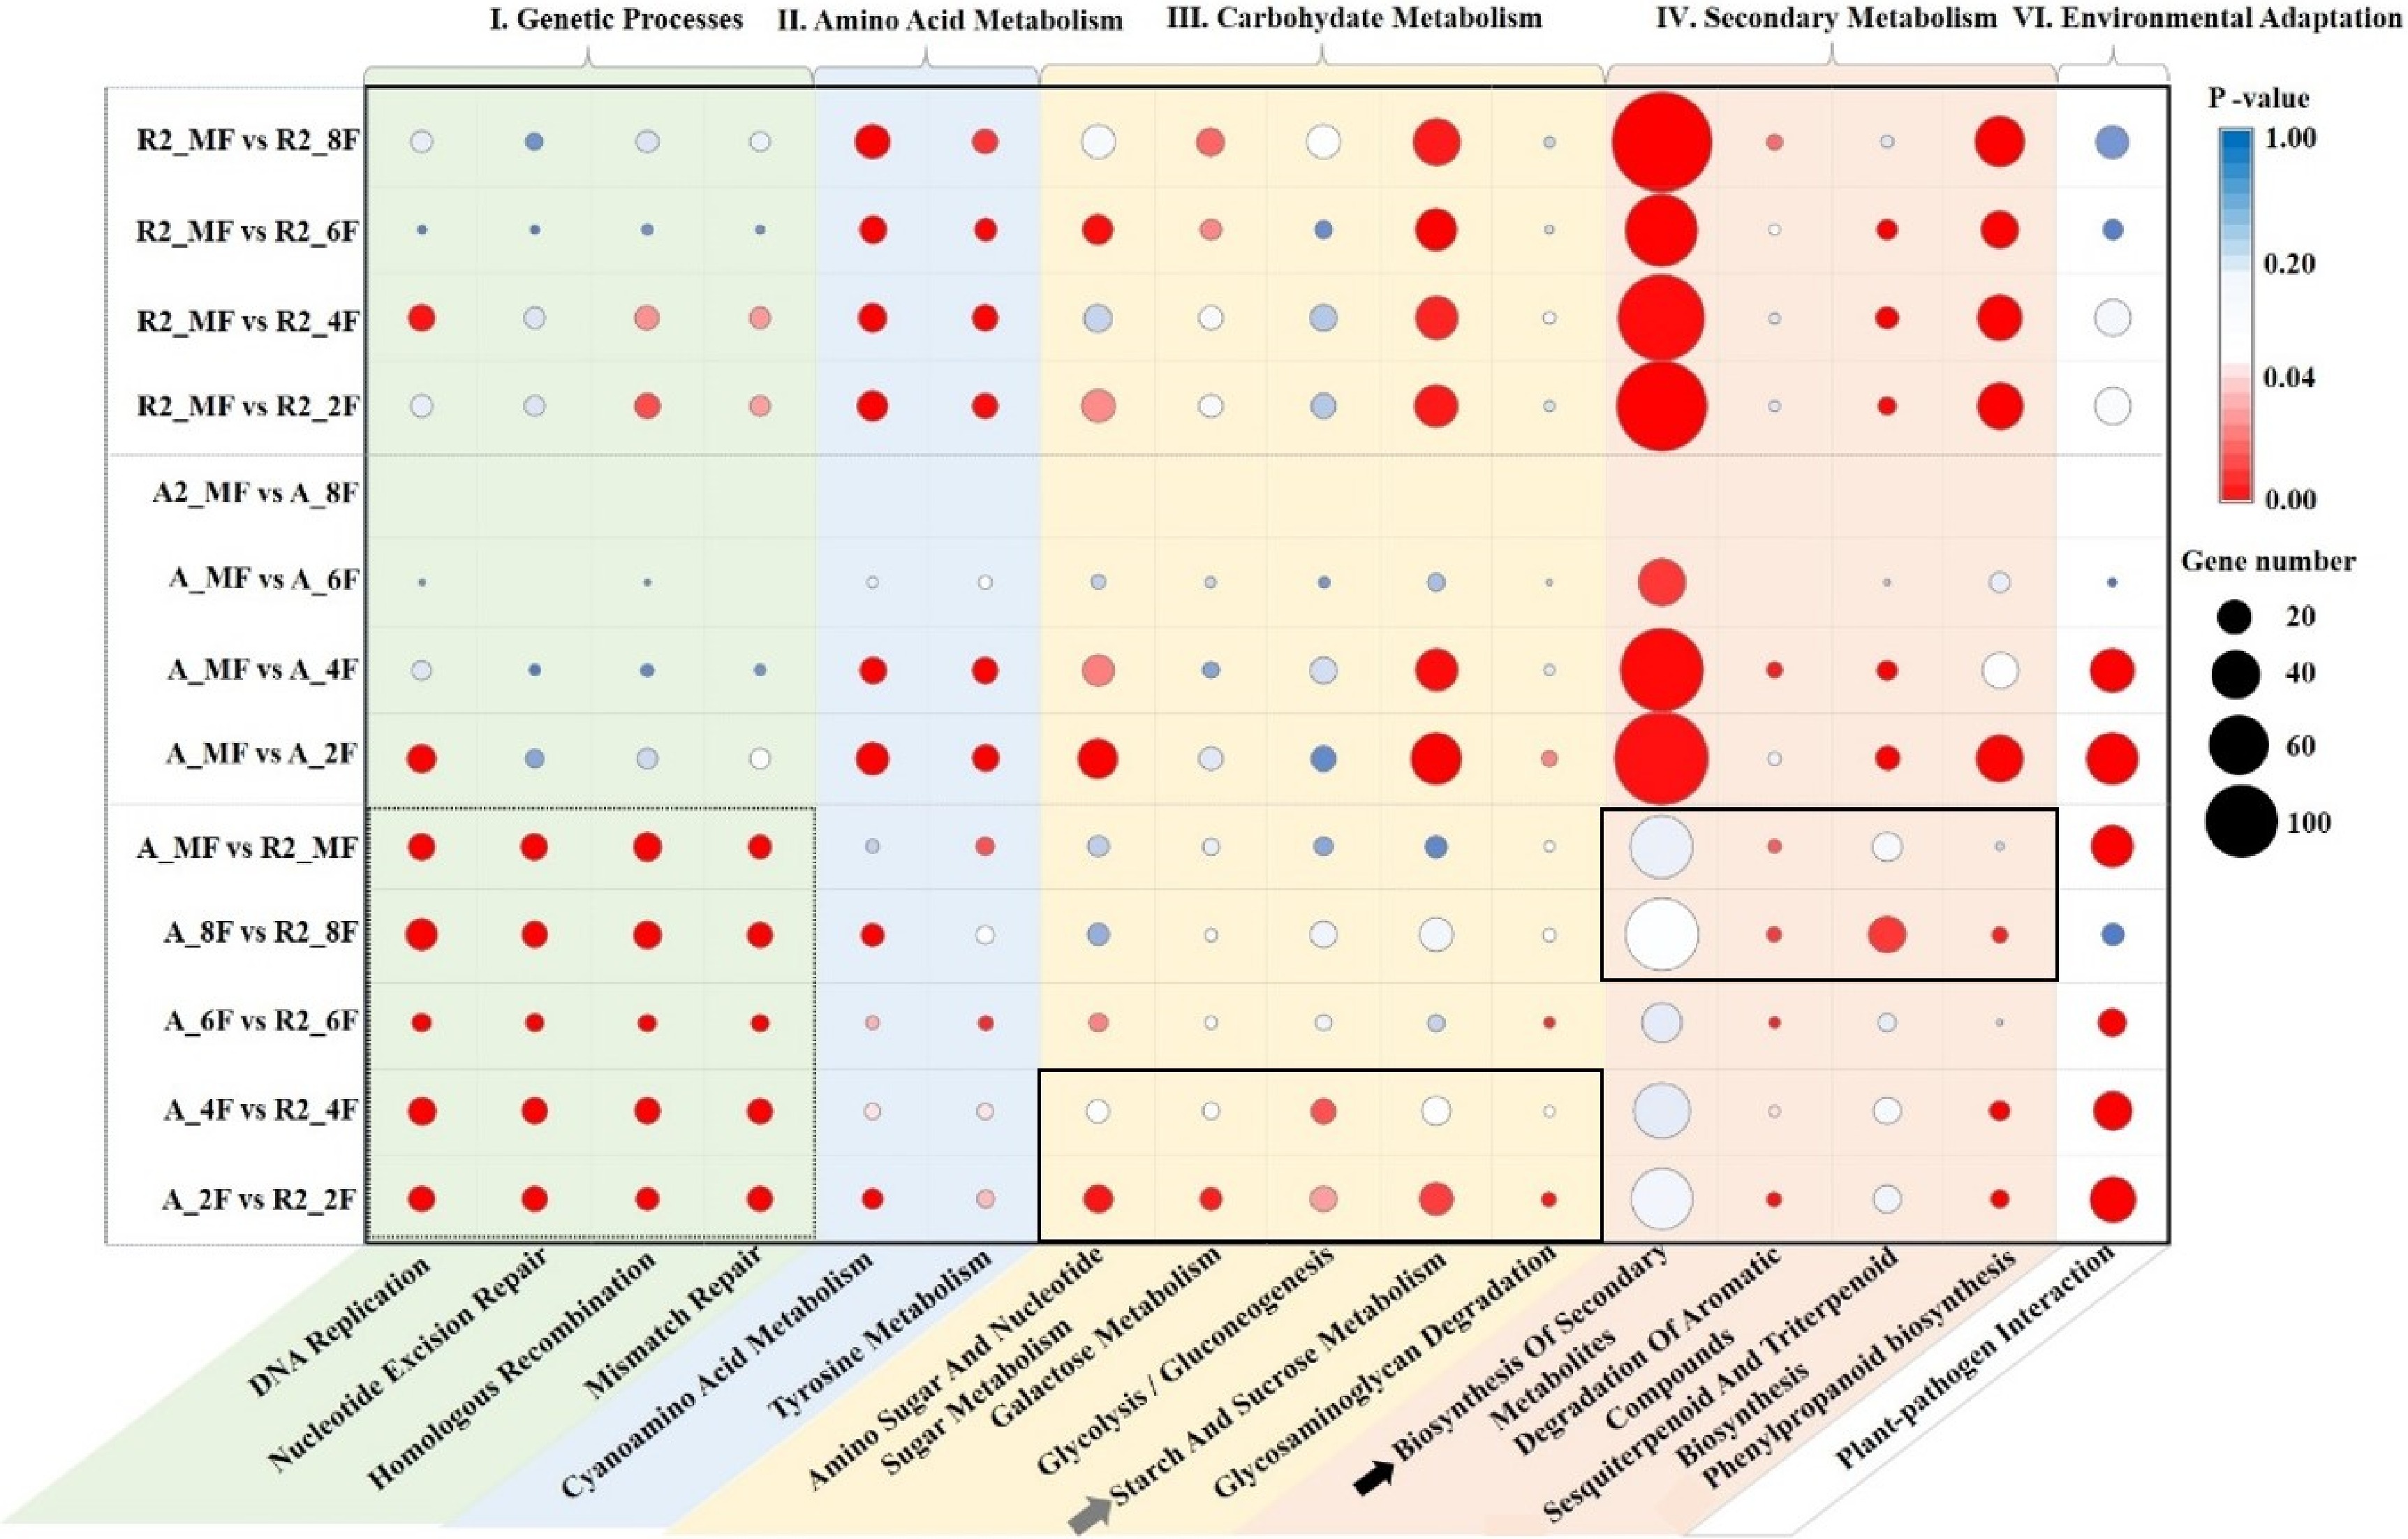
Figure 4. Sixteen KEGG pathways were selected to elucidate the main differences between the growth stages in A161 or R6.
-
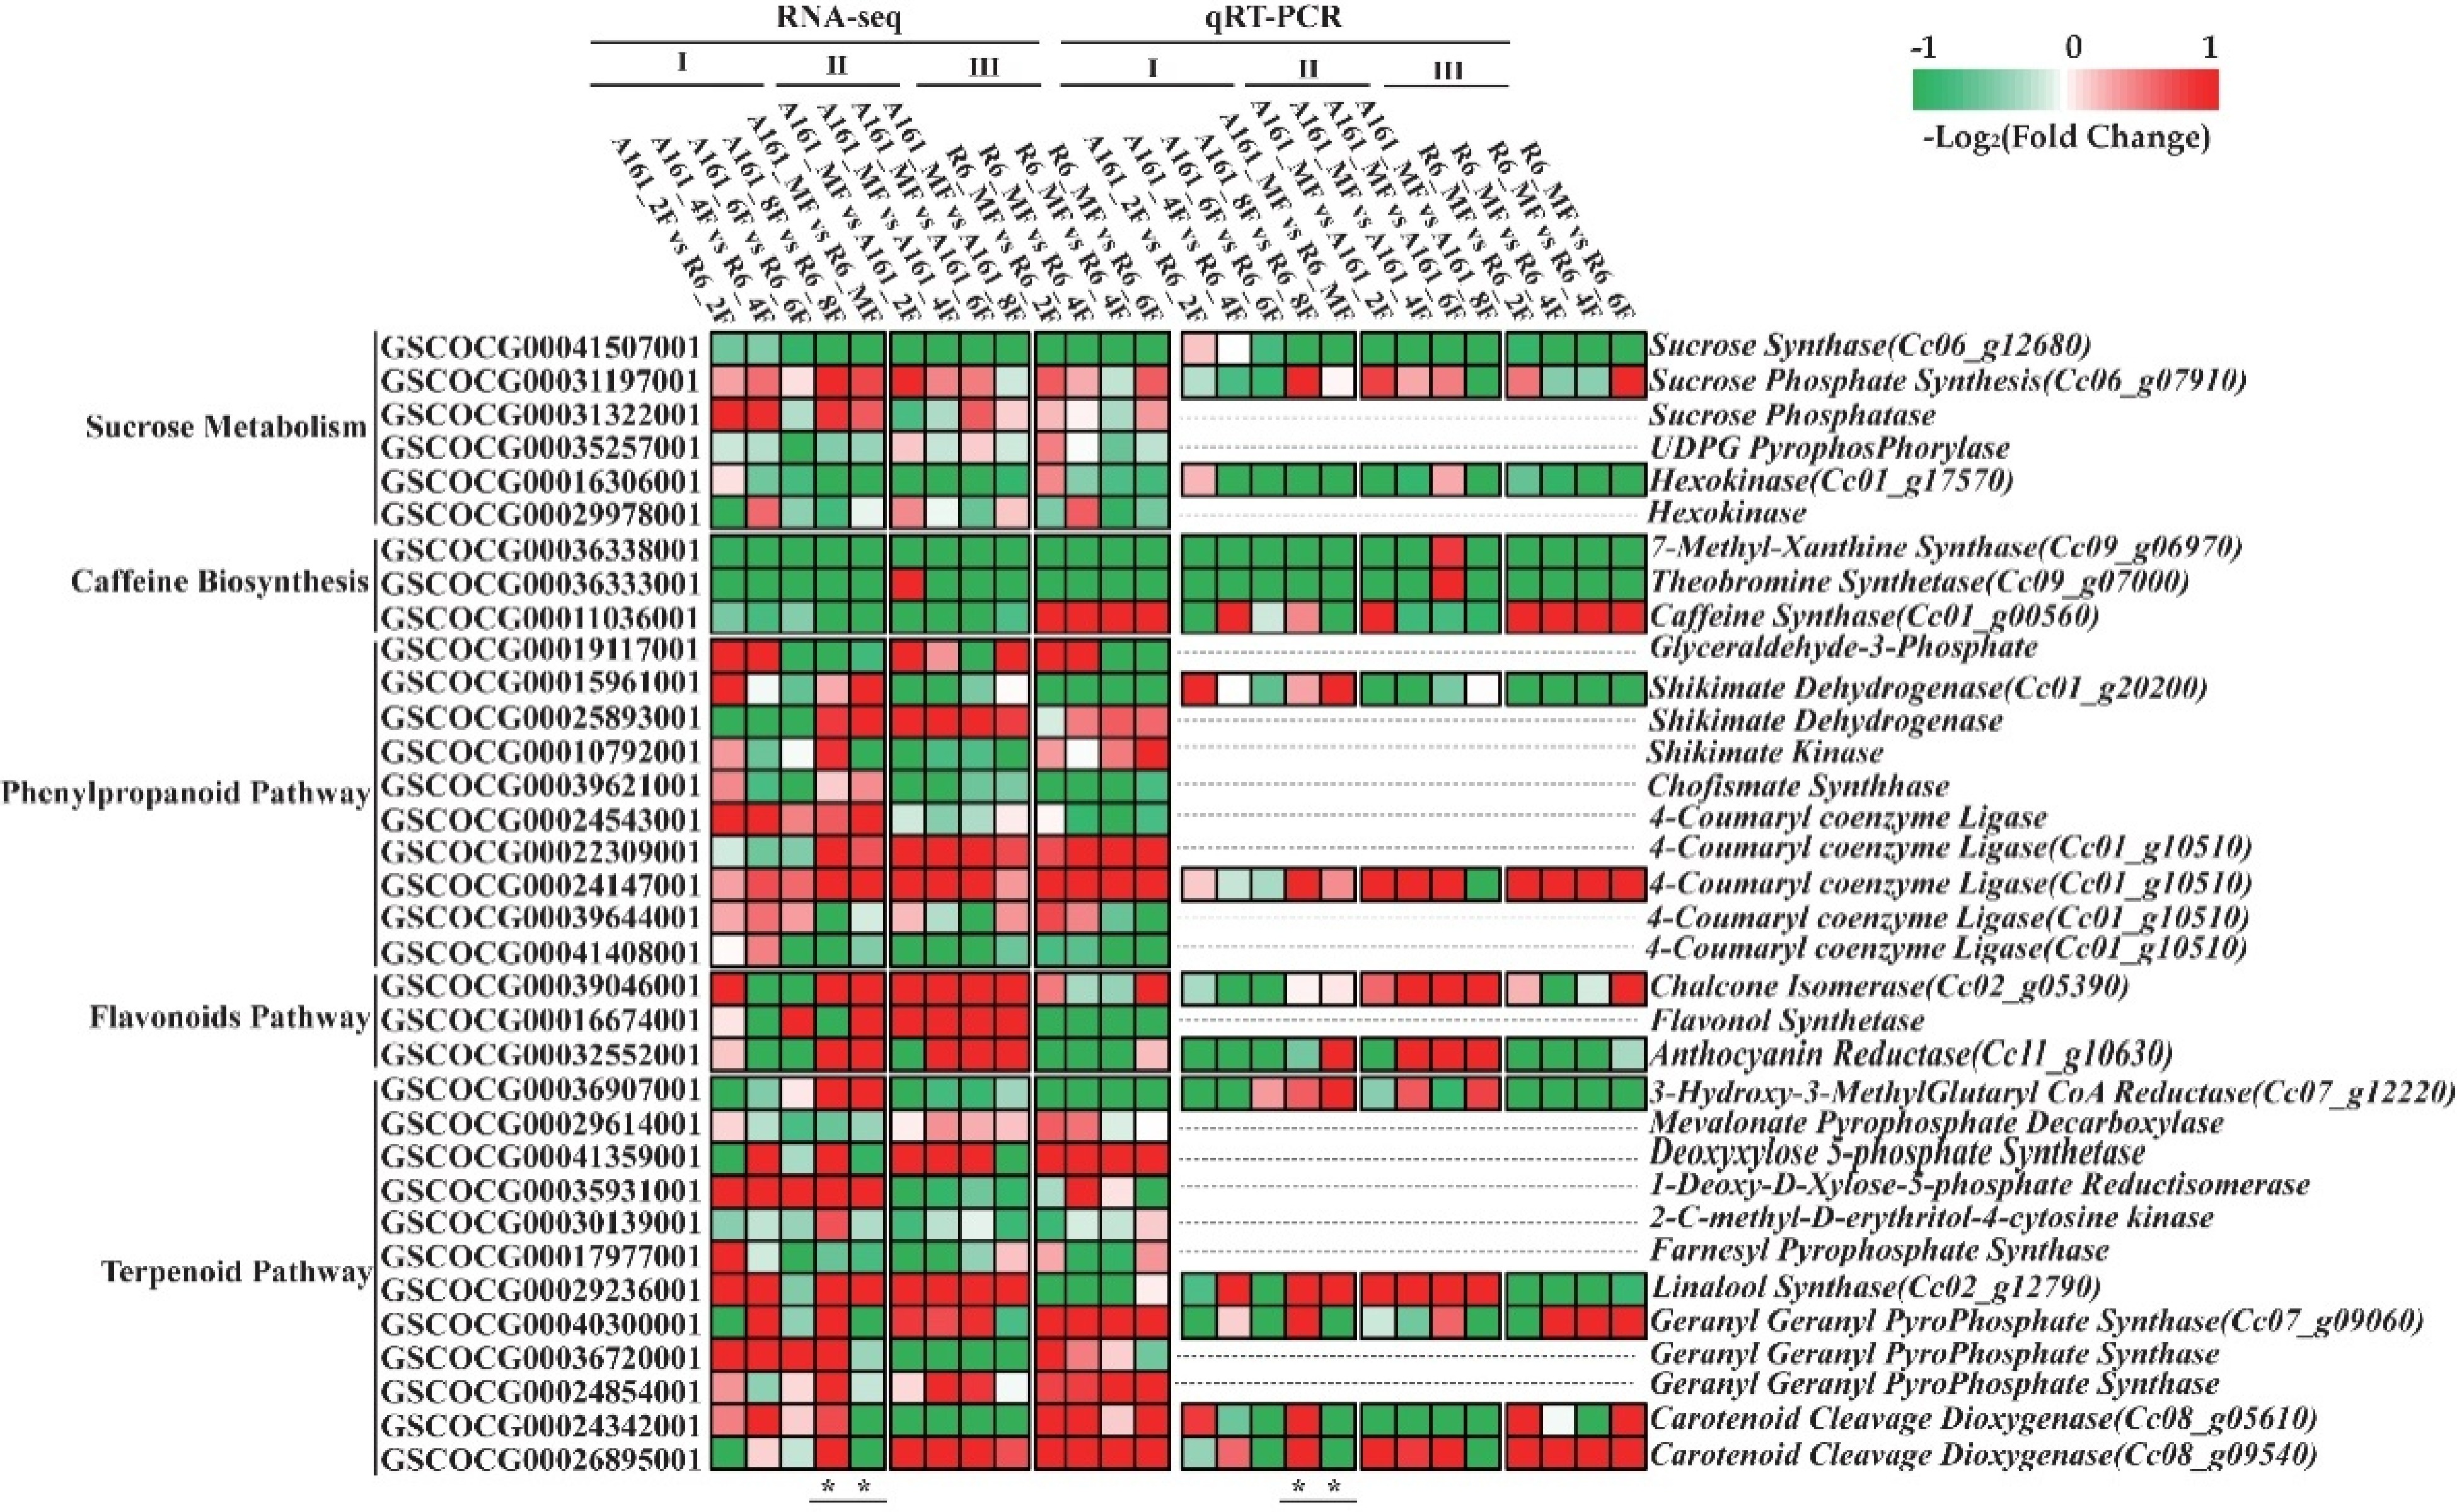
Figure 5. Candidate DEGs validated by qRT-PCR resulted in different content of sucrose and FT-related metabolites.
-
Metabolism Gene name Gene ID Sucrose biosynthesis Sucrose Synthetase Cc06_g12680 Sucrose Phosphate Synthase Cc06_g07910 Hexokinase Cc01_g17570 Caffeine synthesis 7-methyl-xanthine synthase Cc09_g06970 theobromine synthetase Cc09_g07000 caffeine synthase Cc01_g00560 Phenolic metabolism shikimate dehydrogenase Cc01_g20200 4-coumaryl coe-nzyme ligase Cc10_g00840 chalcone isomerase Cc02_g05390 anthocyanin reductase Cc11_g10630 Terpene metabolism 3-Hydroxy-3-MethylGlutaryl CoA Reductase Cc07_g12220 linalool synthase Cc02_g12790 geranyl geranyl pyrophosphate synthase Cc07_g09060 carotenoid cleavage dioxygenase Cc08_g05610 carotenoid cleavage dioxygenase Cc08_g09540 Table 1. Fifteen genes related to coffee quality screened out for qRT-PCR.
Figures
(5)
Tables
(1)