-
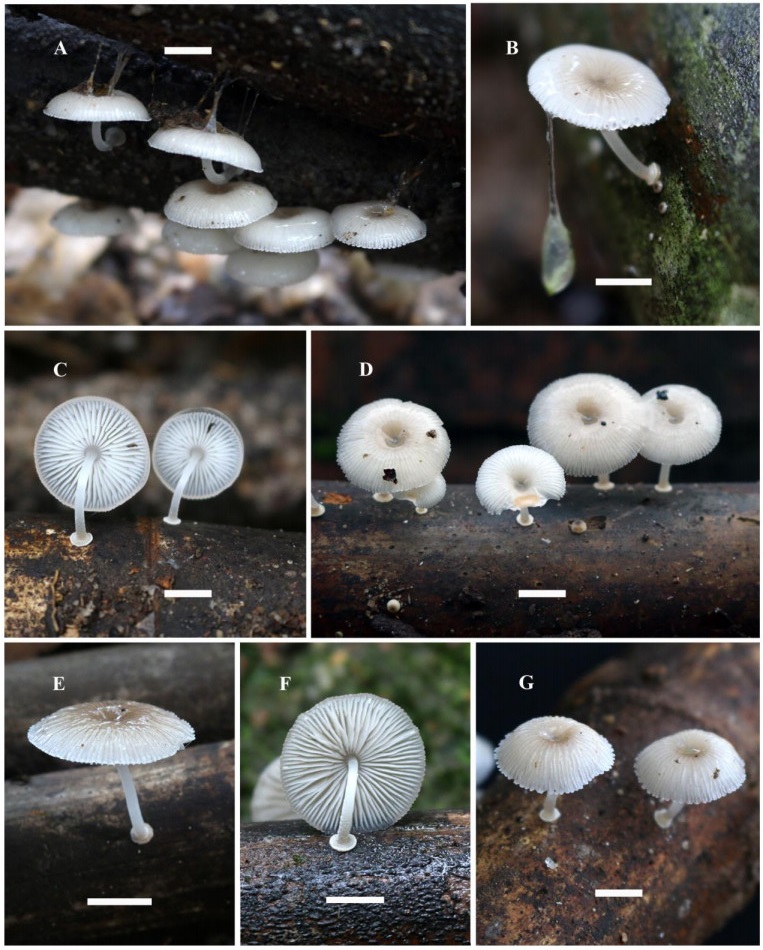
Figure 1. Mycena chlorophos. A–G Habit in situ. B Basidioma with gluten oozing. C Lamella view. E, G Basidioma in dry weather. F Basidioma with discoid stipe base. Scale bars = 10 mm.
-
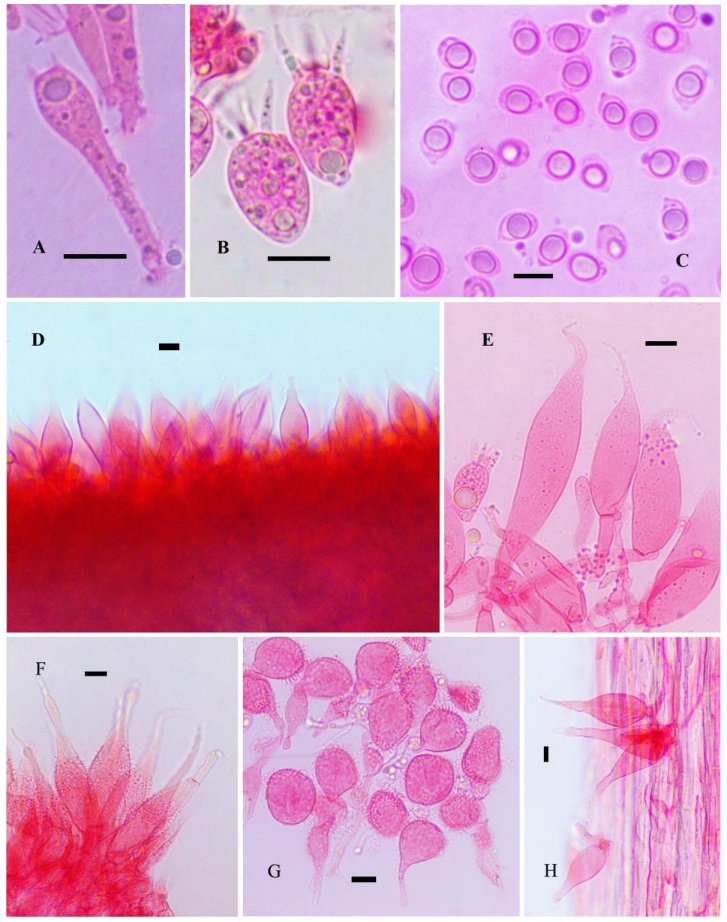
Figure 2. A Normal basidium. B Short basidia. C Basidiospores. D Lamella edge with cheilocystidia. E Cheilocystidia. F Pileus marginal cells. G Pileipellis terminal cells. H Caulocystidia. Scale bars: A-H = 10 μm
-
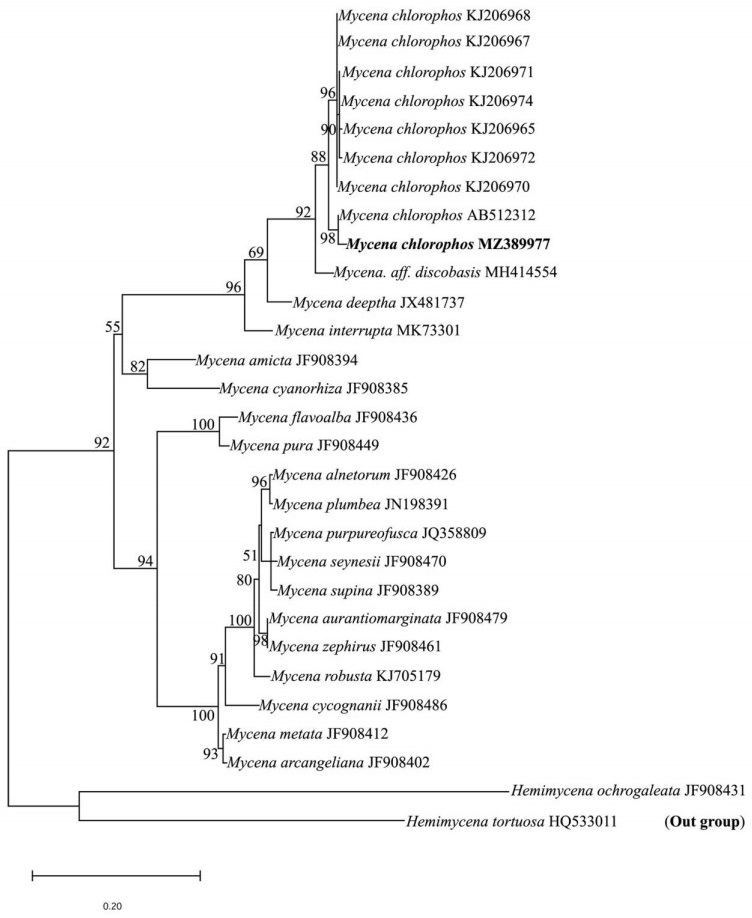
Figure 3. Maximum likelihood tree generated from ITS sequence data. Bootstrap values are indicated above/below branches. BS values greater than 50% are shown. Collection from Kerala, India is given in bold. GenBank accession numbers are given after the name of each taxon.
Figures
(3)
Tables
(0)