-
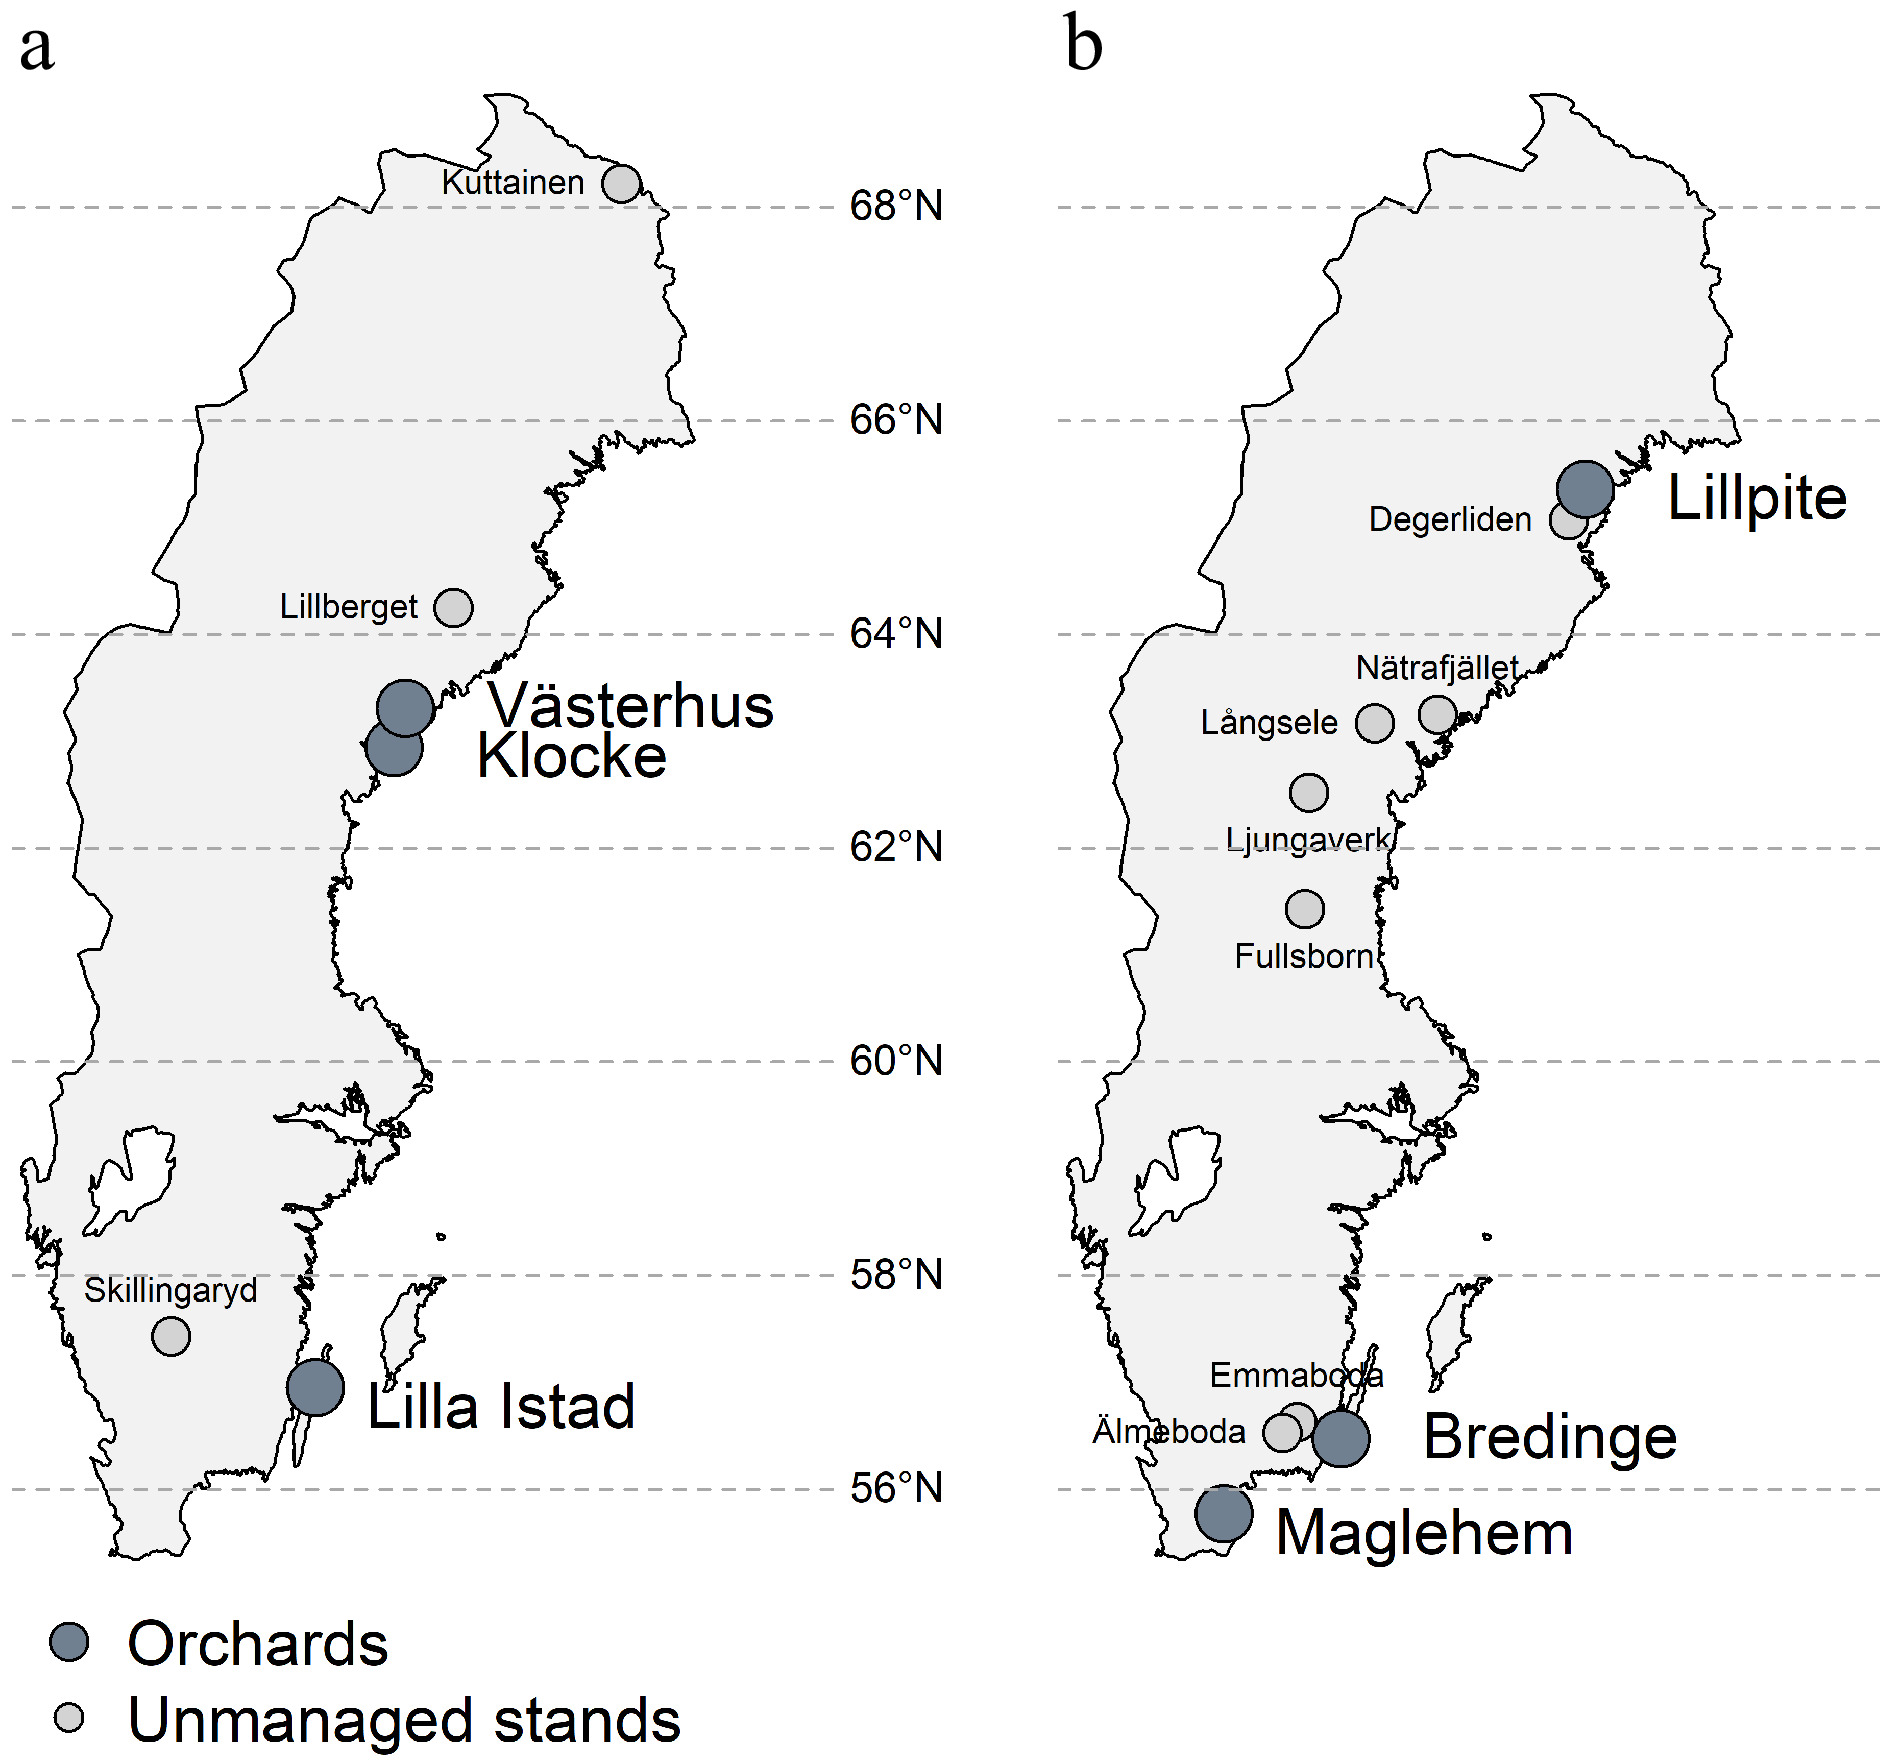
Figure 1.
Map of seed orchards and natural stand locations sampled for this study. (a) Scots pine, (b) Norway spruce.
-
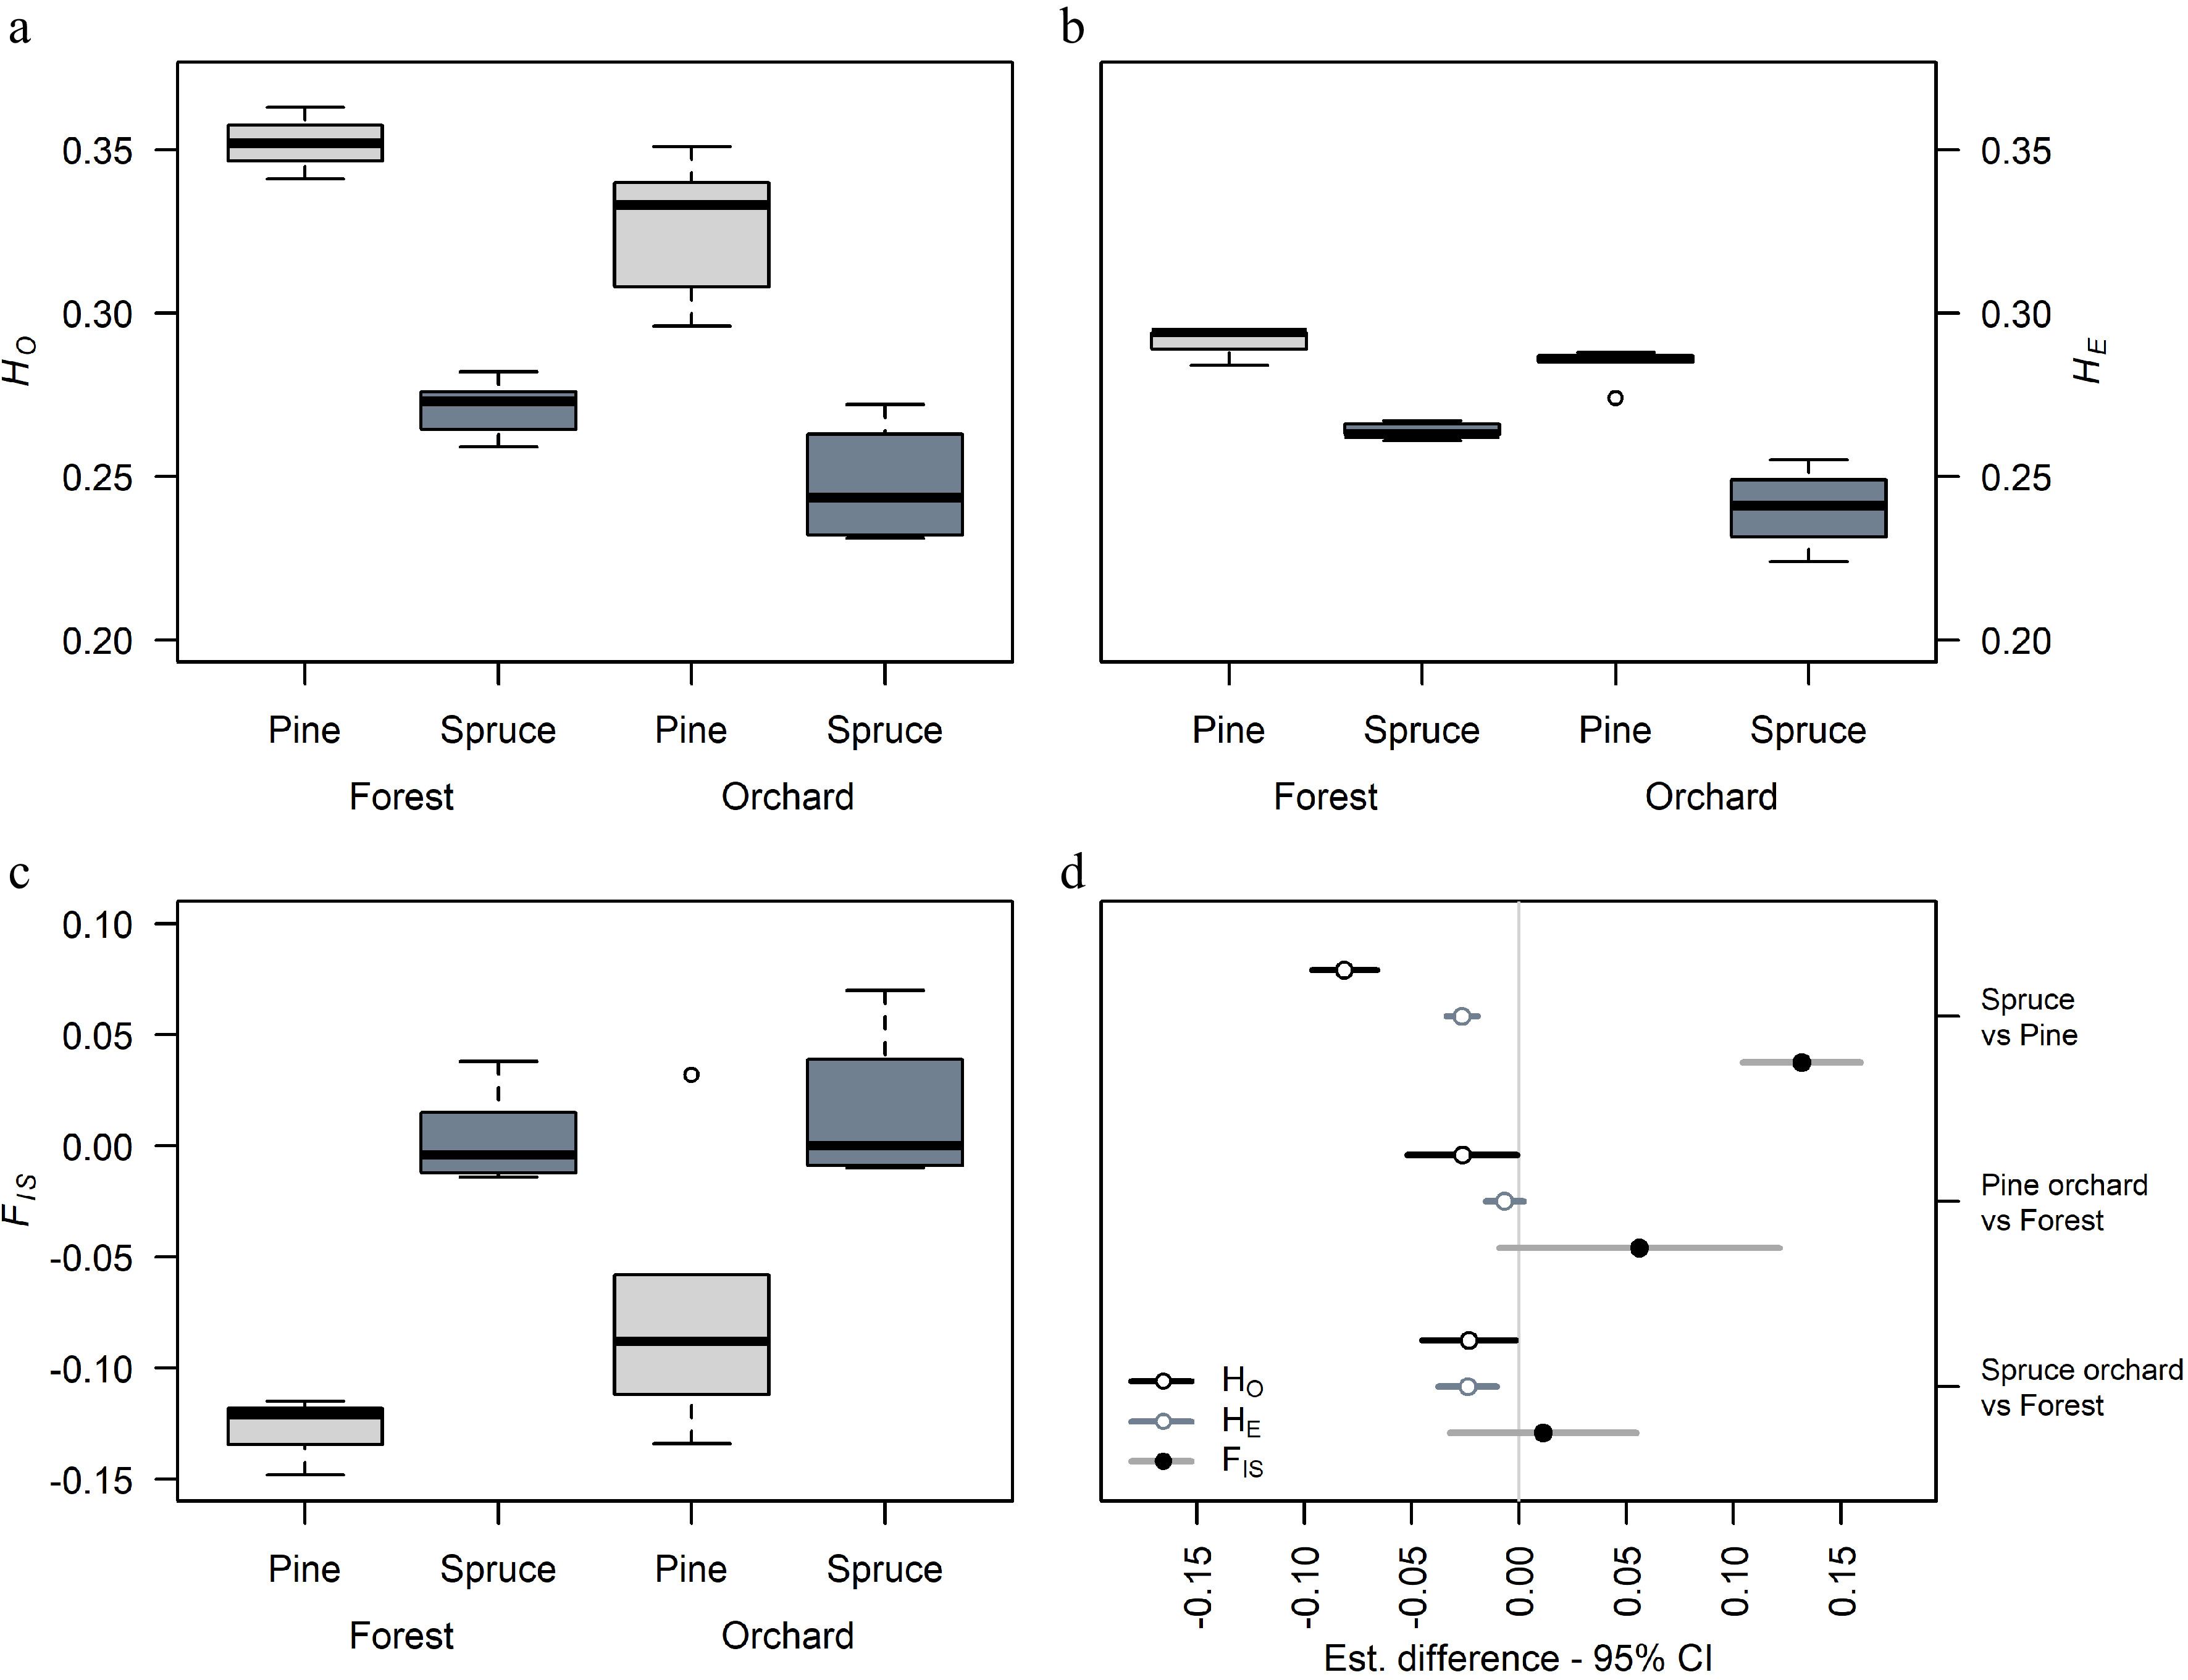
Figure 2.
Comparison of genetic diversity in Norway spruce and Scots pine seed orchard crops and natural stands. (a) Variation in observed heterozygosity HO, (b) expected heterozygosity HE, (c) inbreeding coefficient FIS in orchard crops and natural stands, and (d) the general least squares (gls) comparison between species and seed source within species in diversity estimates. Bar length indicates 95% confidence interval (CI).
-
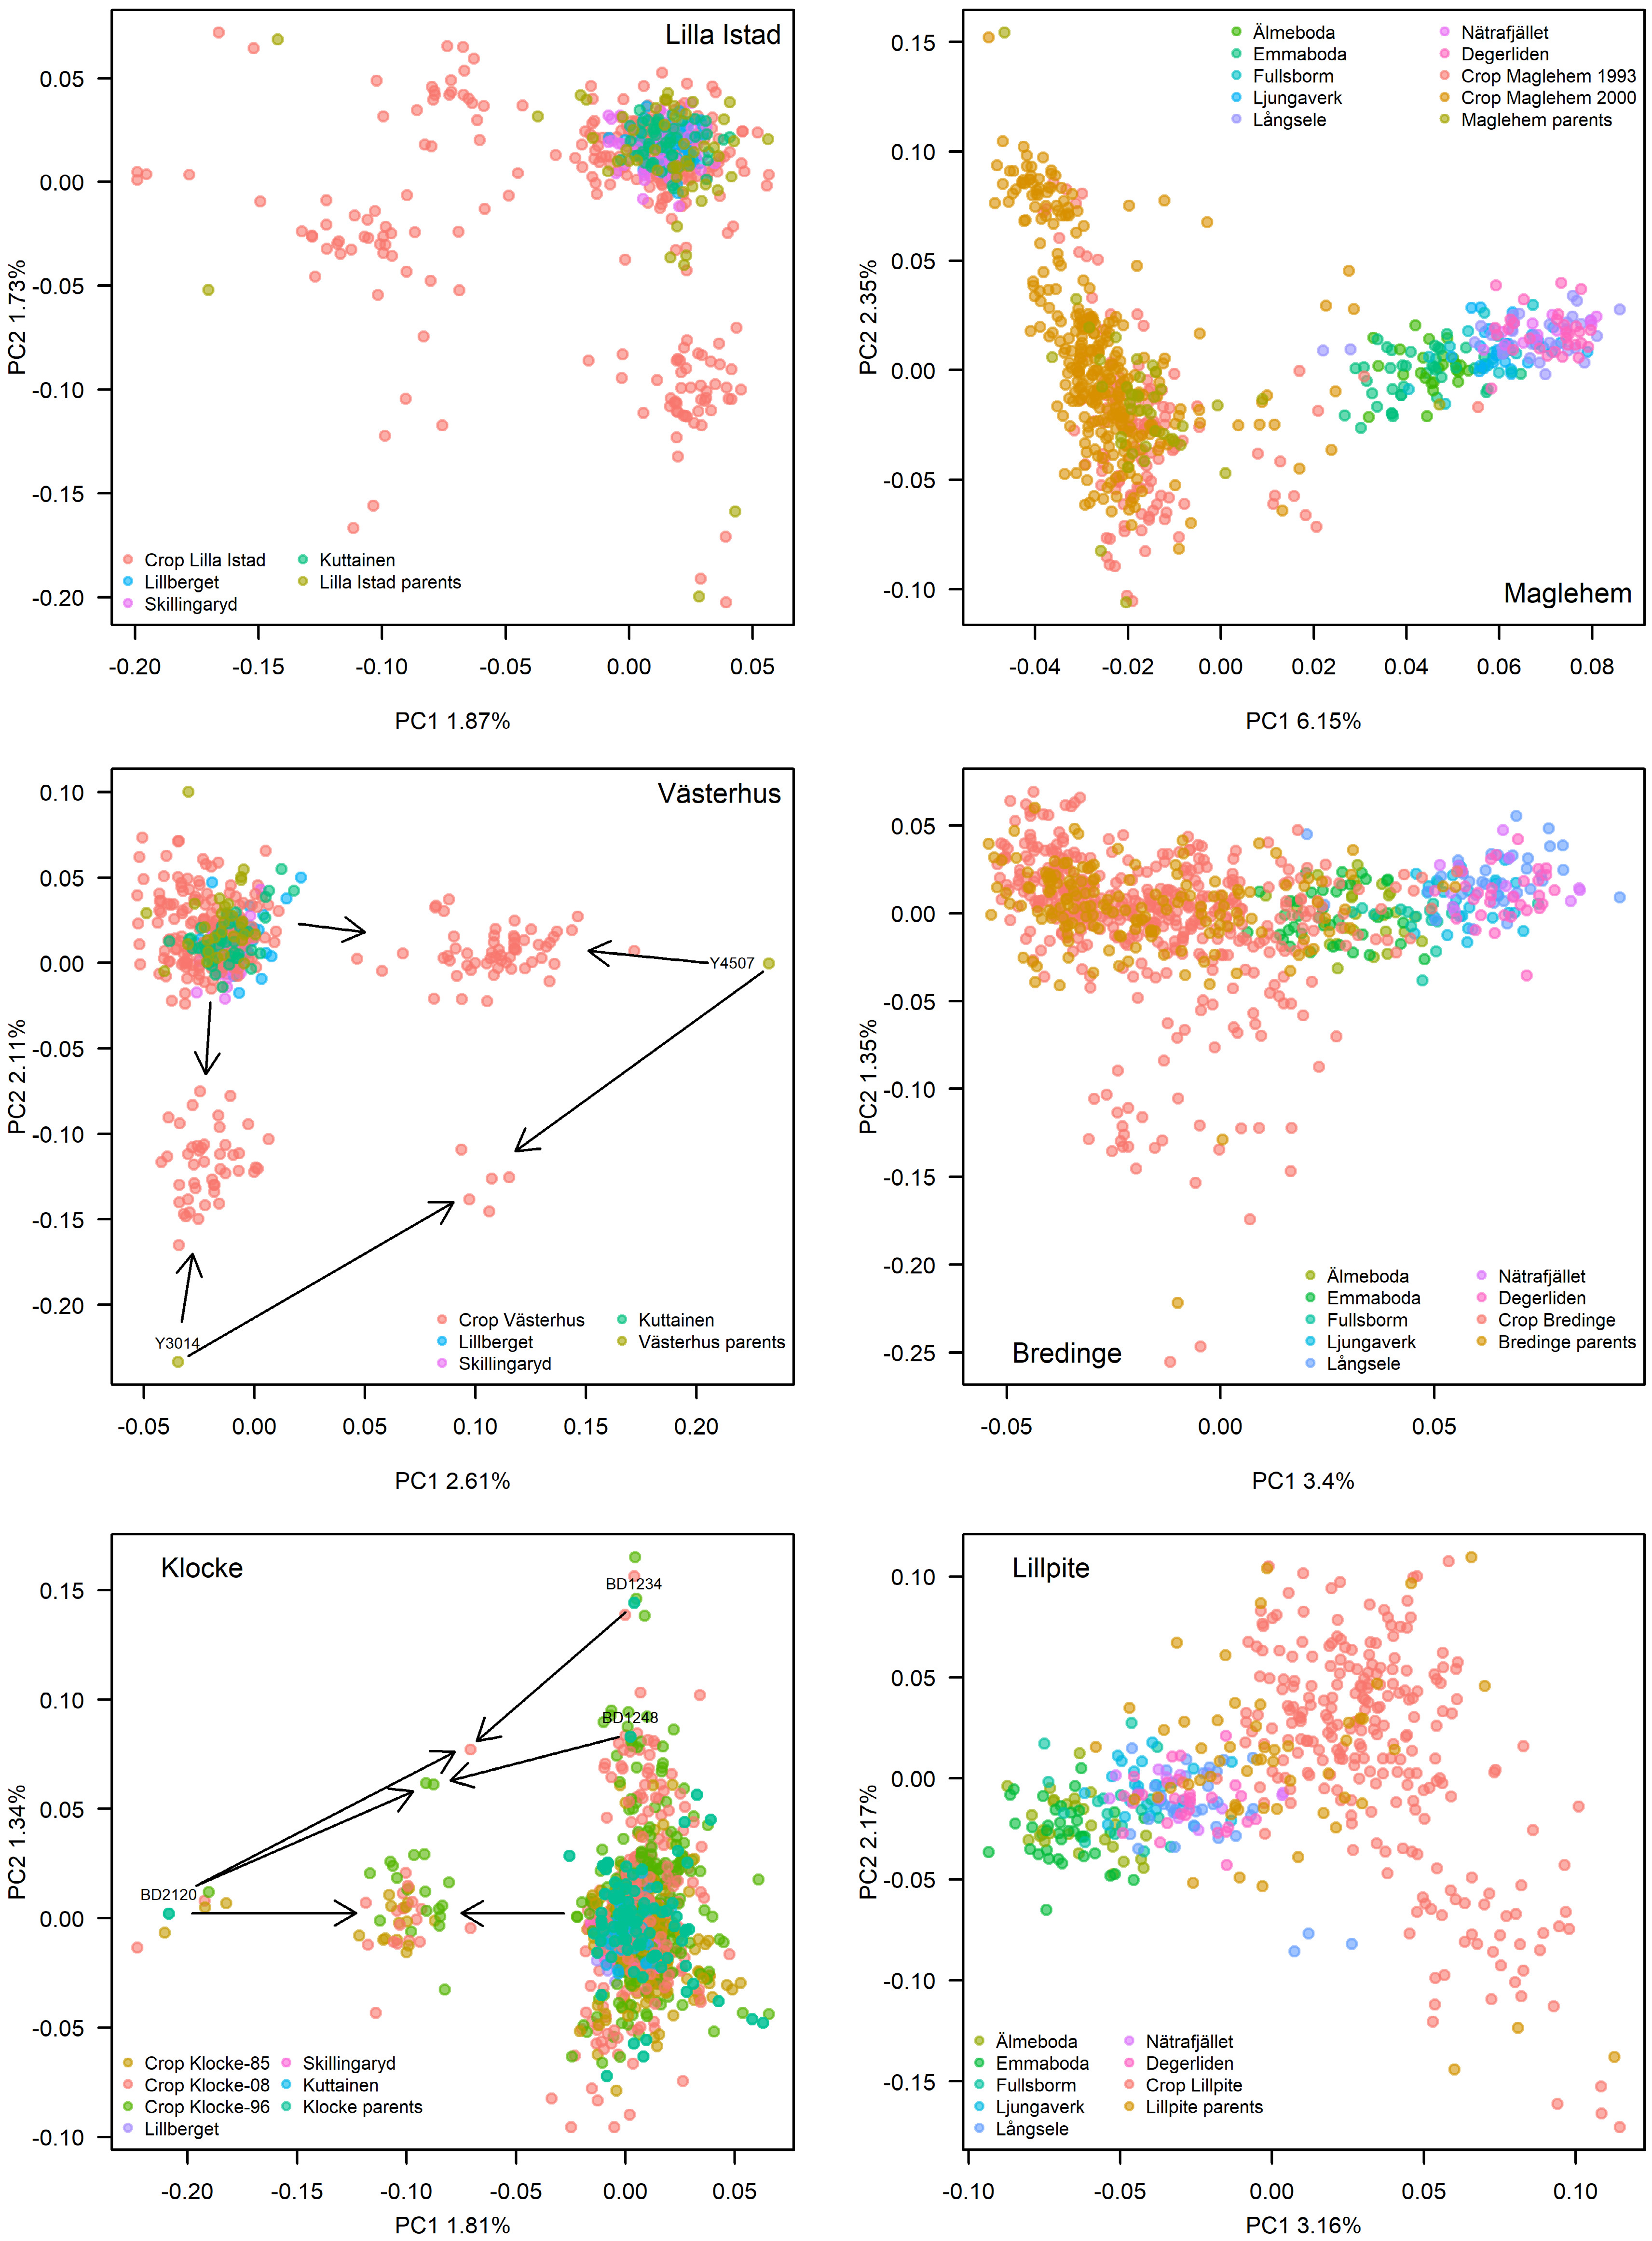
Figure 3.
PCA plots of genetic variation of each orchard crop(s) and parents in comparison to natural stands. Left panels depict the pine orchards while the right panels depict the spruce orchards. Where arrows are depicted, they point to a group of offspring, which the particular parent has contributed to. In Klocke, parent BD2120 and BD1234 each has six and five offspring from self-pollination, shown as dots around each parent.
-
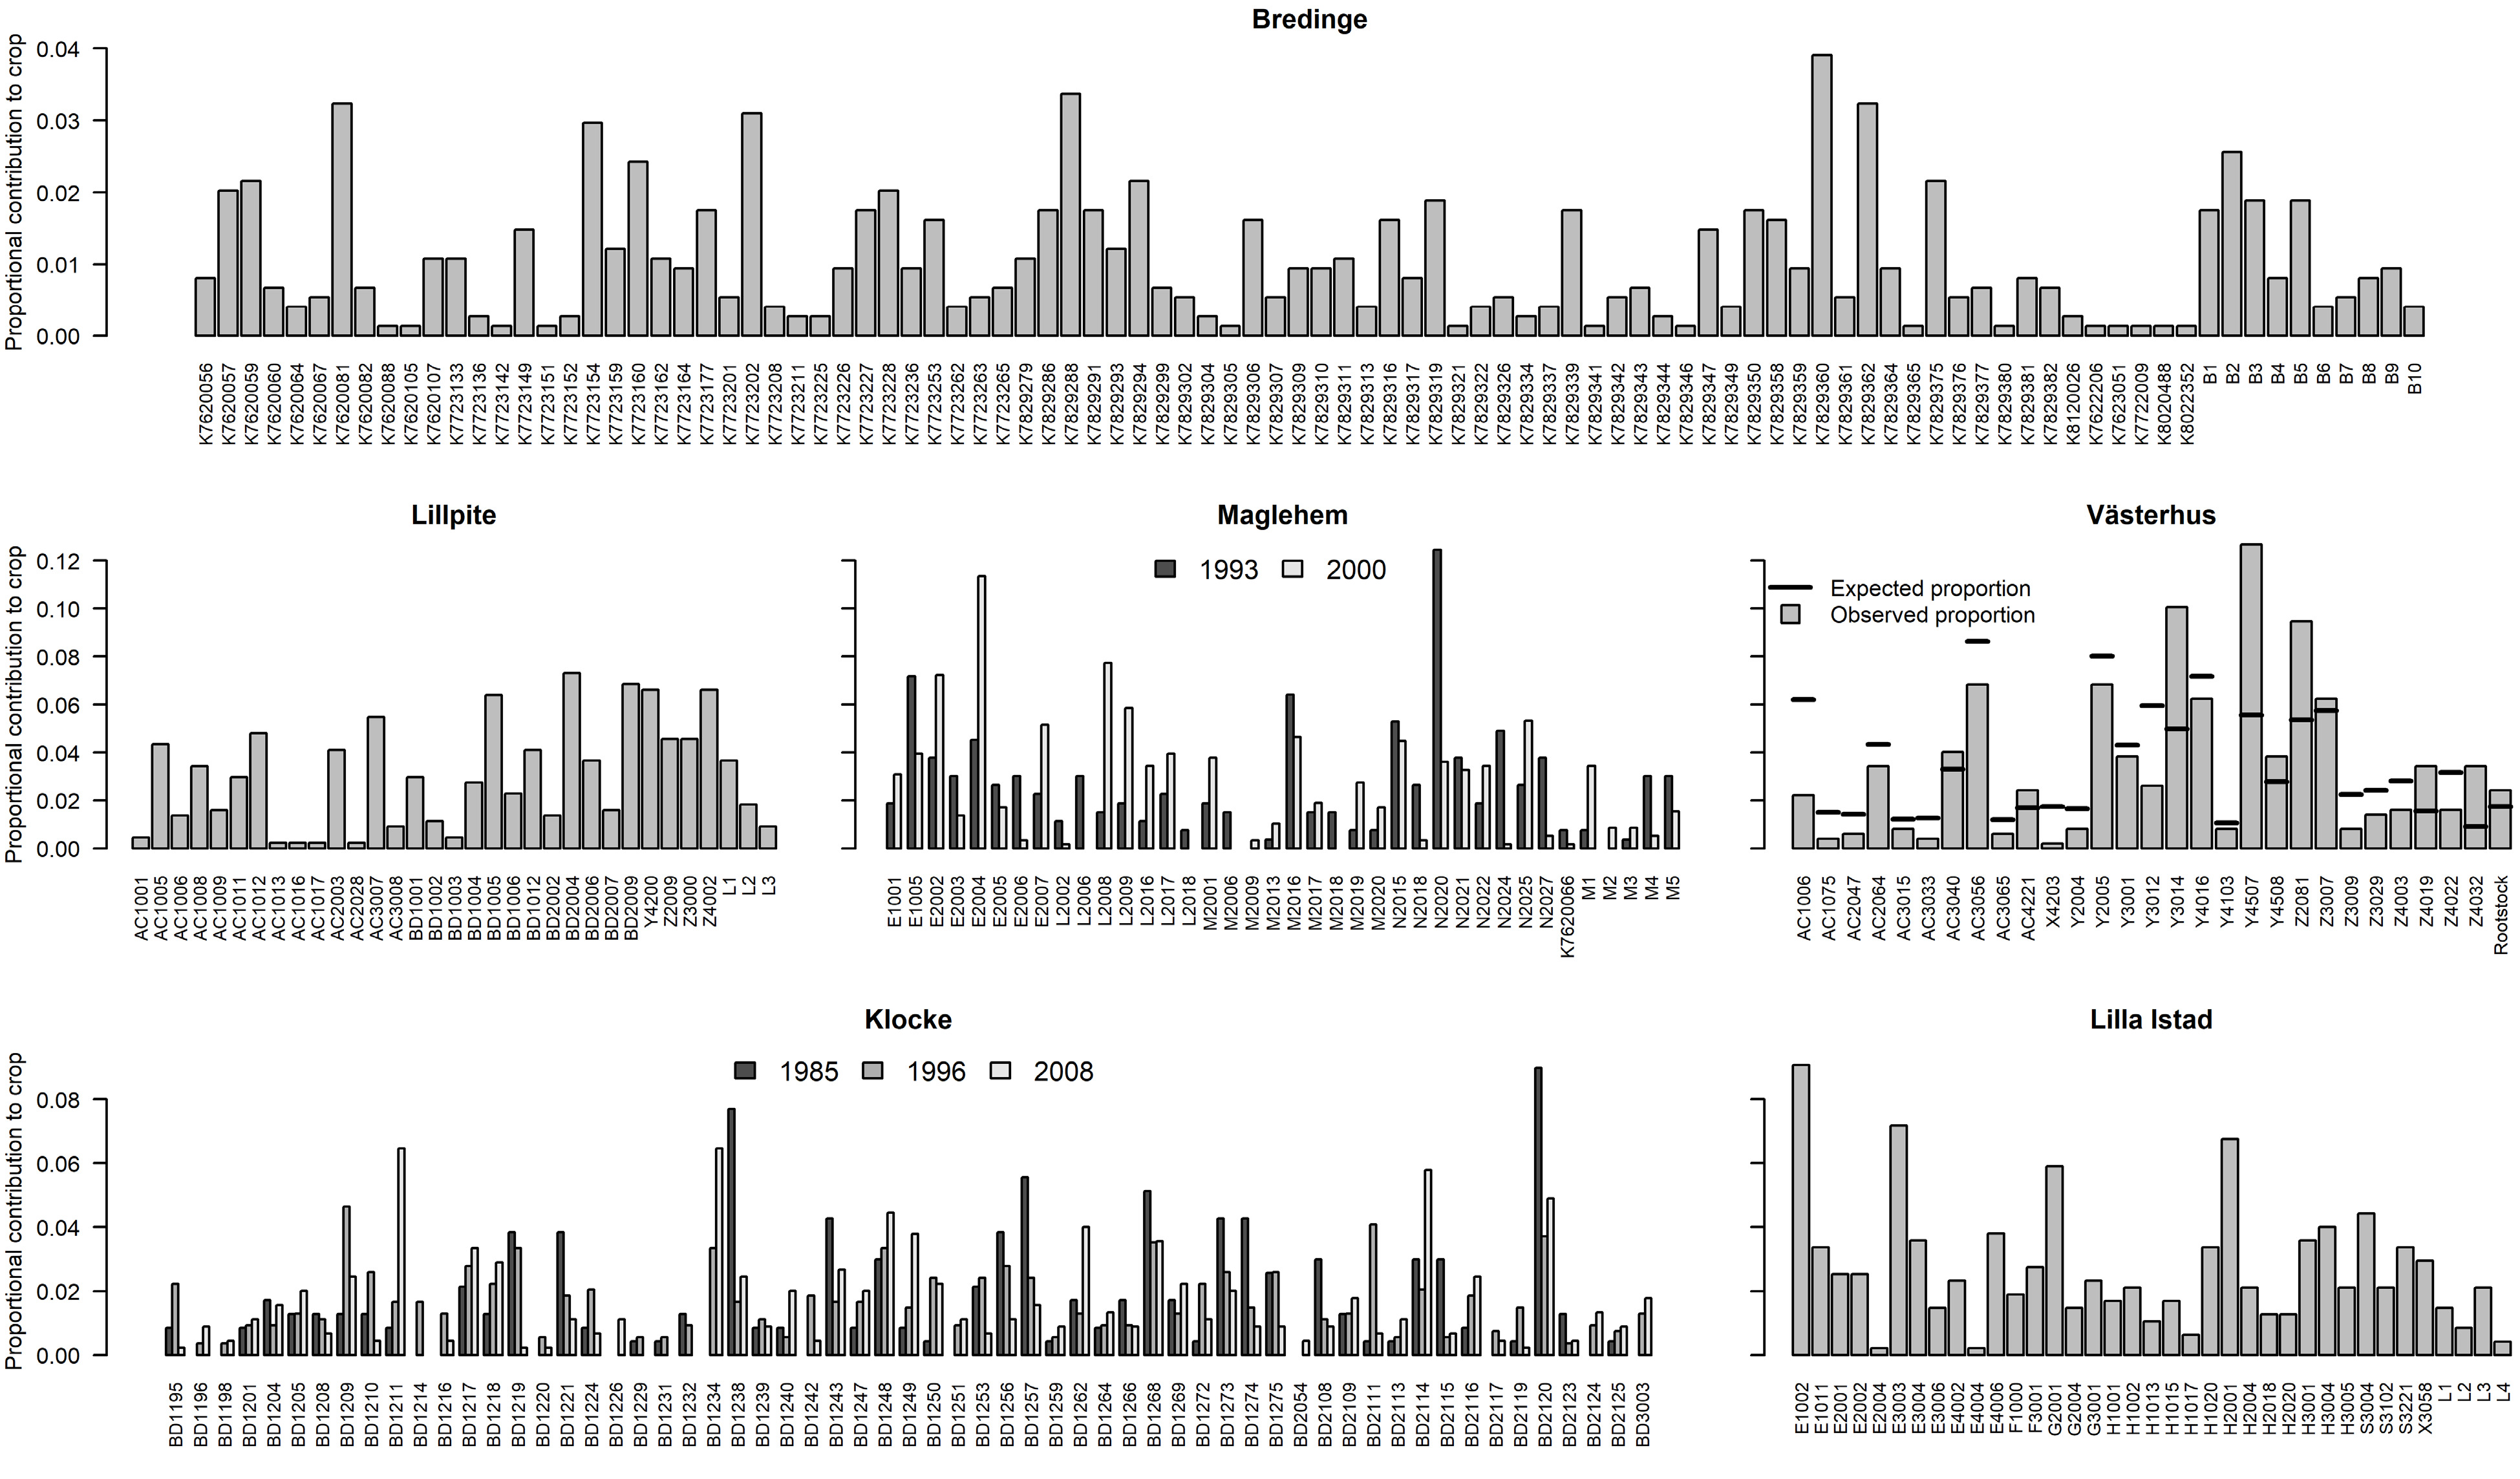
Figure 4.
Parental contribution to each orchard crop. Parent IDs are on the x-axis.
-
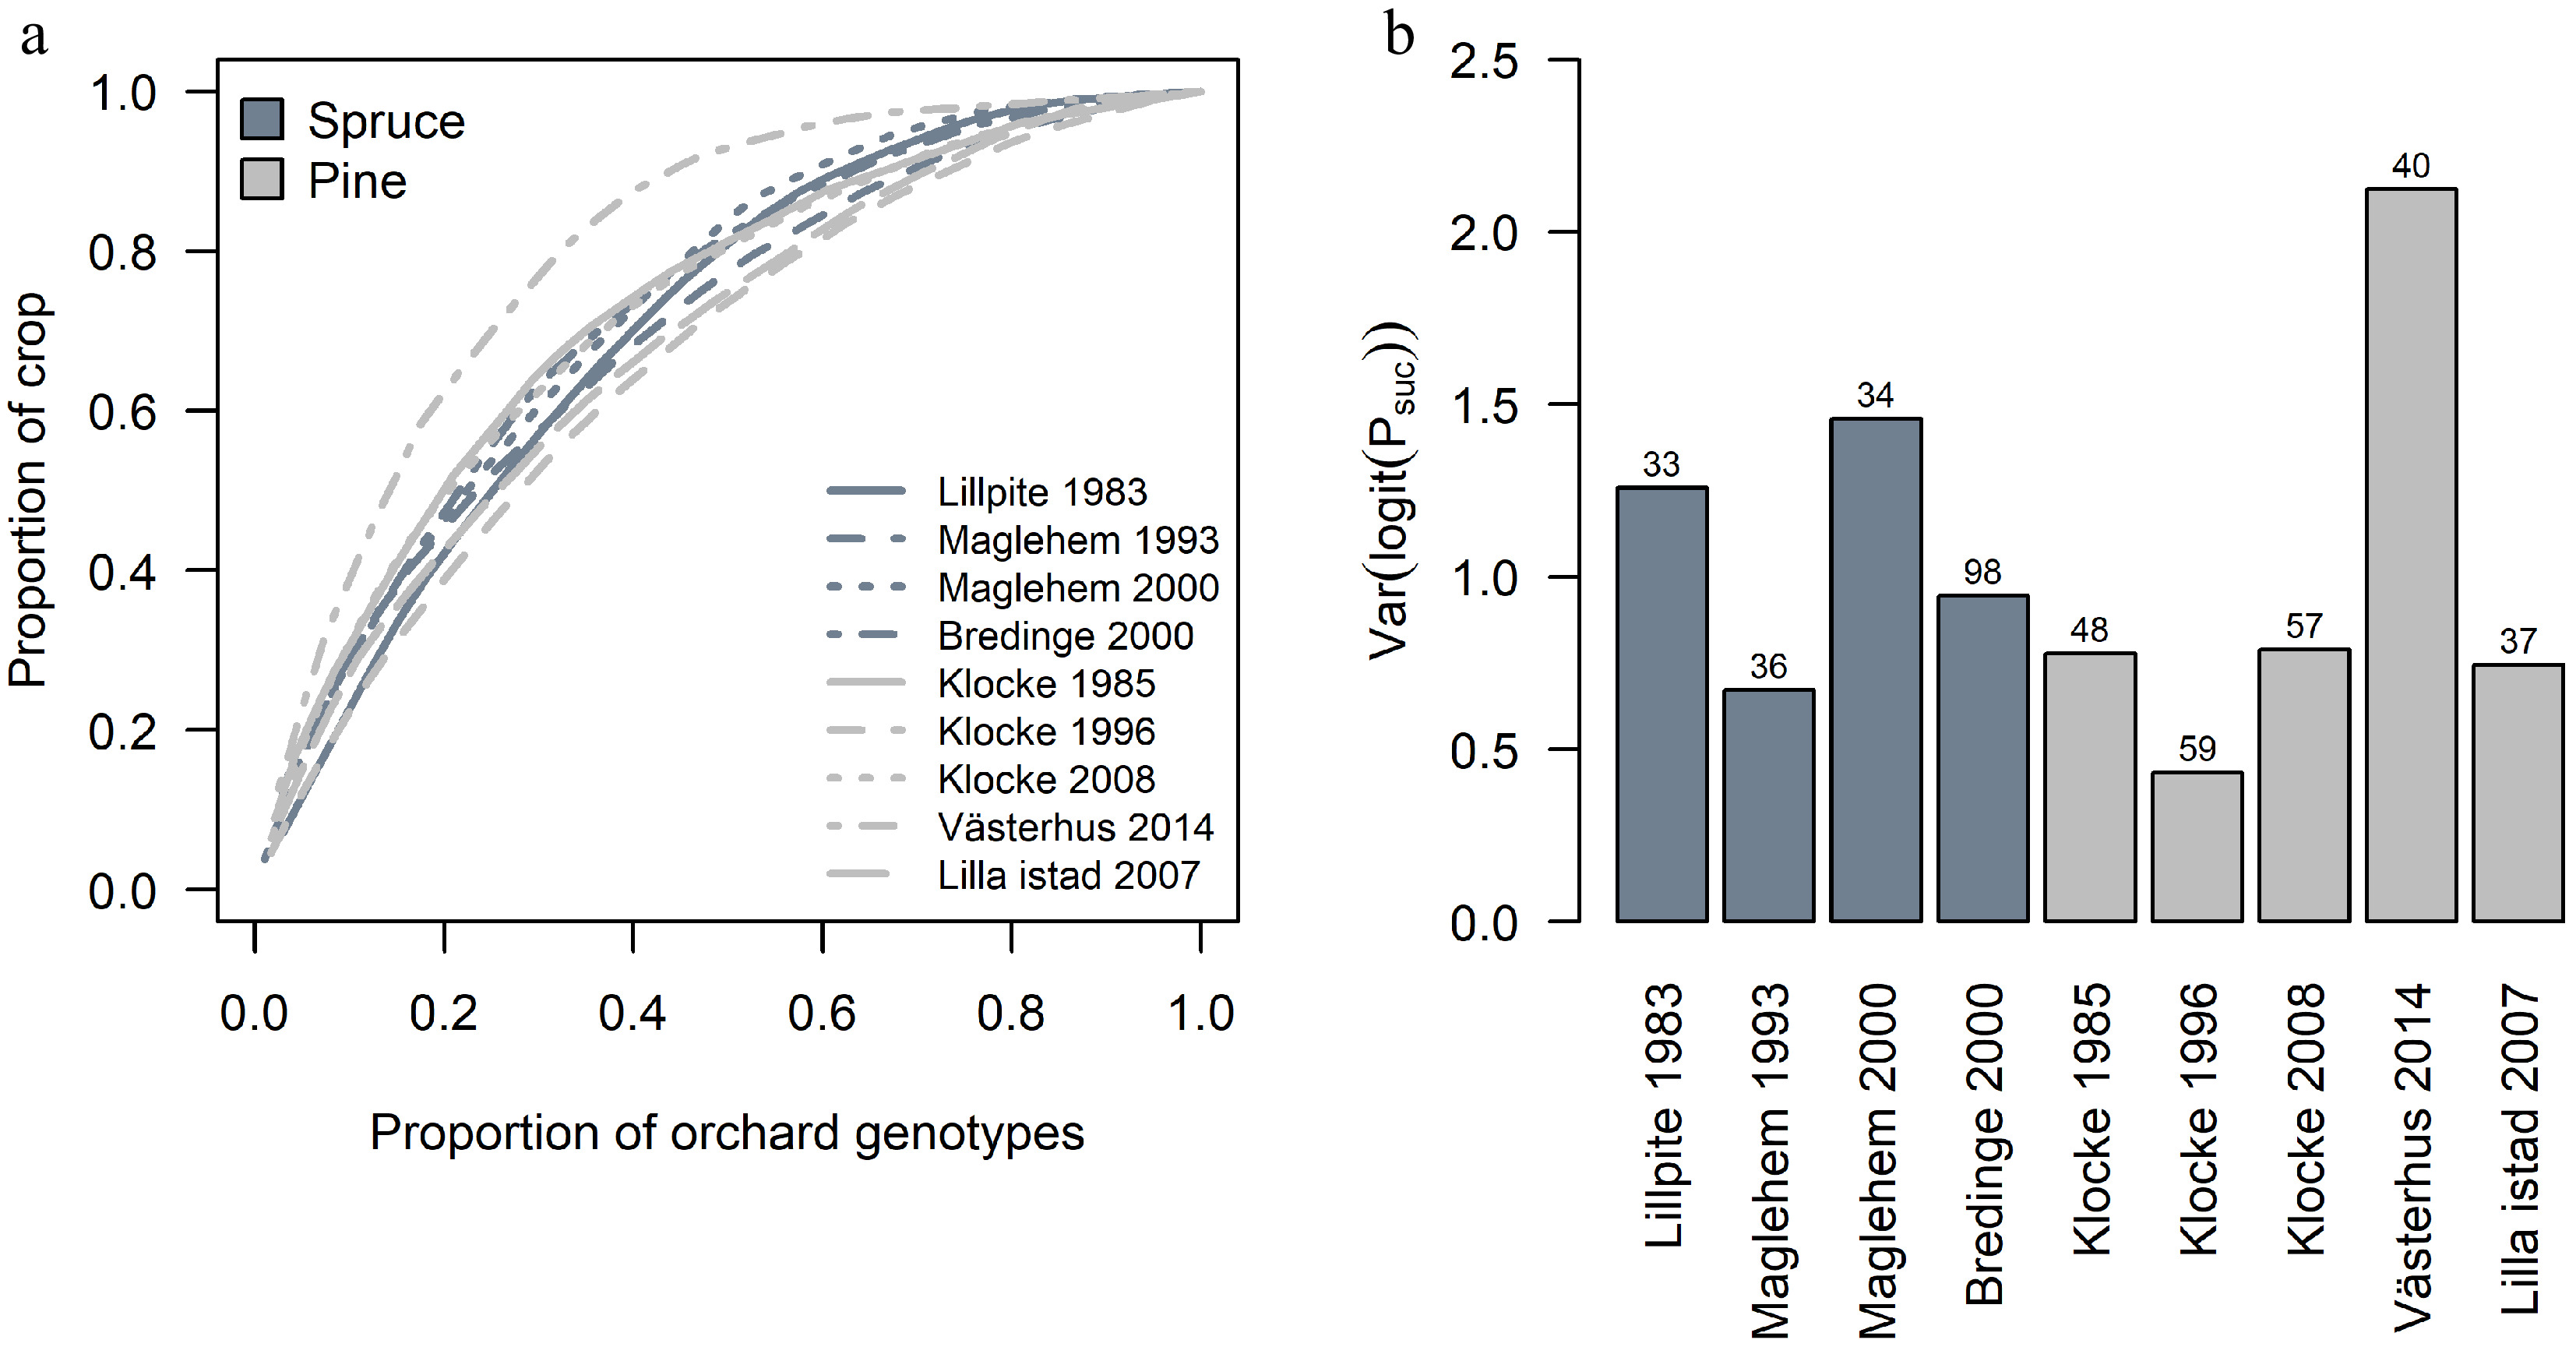
Figure 5.
Variation in parental contribution among orchard crops. (a) The cumulative sums of orchard parents' contribution to each crop. (b) The variation in parents' contribution among orchards crops. Numbers above bars indicate the number of identified parents (and rootstock for Västerhus) within the orchard that contributed to the crop.
-
Orchard & stand name Type of
materialLatitude Longitude Year orchard
establishedOrchard
size
(ha)Orchard
age of the
cropOrchard
crop size
(kg/ha)No.
parents
in orchardNo.
parents
genotypedNo.
seedlings
genotypedScots pine Lilla Istad orchard Crop 2007 56°57' N 16°48' E 1982 21 25 4.4 40 39 314 Klocke orchard Crop 1985 62°56' N 18°21' E 1970 16 15 0.8 661 63 215 Klocke orchard Crop 1996 26 2.8 293 Klocke orchard Crop 2008 38 1.1 301 Västerhus orchard Crop 2014 63°18′ N 18°33′ E 1991 13.7 23 5.4 28 28 299 Västerhus orchard Rootstock 67 Skillingaryd Natural stand 57°43' N 14°02' E 50 Kuttainen Natural stand 68°22' N 22°48' E 50 Lillberget Natural stand 64°17' N 19°33' E 50 Total 197 1,572 Norway spruce Lillpite orchard Crop 1983 65°21' N 21°10' E 1963 10 20 38.0 36 35 231 Bredinge orchard Crop 2000 56°28' N 16°25' E 1983 12 17 4.4 2042 146 431 Maglehem orchard Crop 1993 55°46' N 14°10' E 1957 5 36 21.0 36 32 137 Maglehem orchard Crop 2000 43 44.0 323 30 304 Älmeboda Natural stand 56°38' N 15°15' E 27 Emmaboda Natural stand 56°37' N 15°31' E 39 Fullsborn Natural stand 61°25' N 15°42' E 17 Ljungaverk Natural stand 62°31' N 15°48' E 26 Långsele Natural stand 63°10' N 17°4' E 36 Nätrafjället Natural stand 63°10' N 18°14' E 11 Degerliden Natural stand 65°04' N 20°51' E 29 Total 243 1,288 1 Six genotypes were planted with 1 or 2 ramets at establishment, some of them were lost at later age.
2 Genetic thinning in Bredinge during 2012−2013 removed a section containing 58 parents.
3 Genetic thinning in Maglehem in 1994 reduced the number of genotypes and changed ramet frequency among remaining genotypes.Table 1.
Summary of samples included in this study.
-
Orchard crop,
natural standSample
size*HO (± SE) HE (± SE) FIS (95% CI) Both parents assigned BPC Selfing Not
assignedNep Nep2 Scots pine Lilla Istad 2007 314 (261) 0.351 ± 0.001 0.288 ± 0.0006 −0.134 (−0.189−0.083) 169 (53.9%) 136 (43.3%) 5 (1.6%) 9 26.6 46.1 Klocke 1985 215 (199) 0.333 ± 0.0012 0.287 ± 0.0008 −0.088 (−0.145−0.034) 24 (11.2%) 186 (86.5%) 6 (2.8%) 5 29.8 122.0 Klocke 1996 293 (212) 0.308 ± 0.0011 0.274 ± 0.0007 −0.058 (−0.113−0.007) 251 (85.7%) 35 (11.9%) 17 (5.8%) 7 51.5 59.5 Klocke 2008 301 (276) 0.296 ± 0.0009 0.285 ± 0.0005 0.032 (−0.031−0.092) 152 (50.5%) 145 (48.2%) 16 (5.3%) 4 36.7 68.7 Västerhus 2014 299 (277) 0.340 ± 0.0009 0.286 ± 0.0005 −0.112 (−0.166−0.061) 202 (67.6%) 93 (31.1%) 9 (3.0%) 4 16.8 24.0 Skillingaryd 50 (45) 0.341 ± 0.0057 0.284 ± 0.0035 −0.121 (−0.181−0.064) Kuttainen 50 (47) 0.352 ± 0.0057 0.294 ± 0.0033 −0.115 (−0.181−0.051) Lillberget 50 (49) 0.363 ± 0.0055 0.294 ± 0.0031 −0.148 (−0.210−0.088) Sum 1,572 (1,366) 798 595 53 29 Norway spruce Lillpite1983 231 (160) 0.233 ± 0.0012 0.243 ± 0.001 0.070 (0.018−0.121) 209 (90.5%) 20 (8.7%) 7 (3.0%) 2 23.6 26.0 Bredinge 2000 431 (347) 0.272 ± 0.0006 0.255 ± 0.0004 −0.010 (−0.060−0.036) 313 (72.6%) 116 (26.9%) 11 (2.6%) 2 65.0 89.7 Maglehem1993 137 (127) 0.254 ± 0.0017 0.239 ± 0.0013 −0.008 (−0.066−0.048) 130 (94.9%) 5 (3.6%) 5 (3.6%) 2 25.1 26.2 Maglehem 2000 304 (259) 0.231 ± 0.0008 0.224 ± 0.0006 0.008 (−0.041−0.055) 277 (91.1%) 20 (6.6%) 7 (2.3%) 7 20.9 22.4 Älmeboda 27 (22) 0.273 ± 0.0098 0.263 ± 0.0072 −0.004 (−0.069−0.059) Emmaboda 39 (36) 0.282 ± 0.0058 0.267 ± 0.0042 −0.014 (−0.073−0.043) Fullsborn 17 (17) 0.260 ± 0.0127 0.263 ± 0.0099 0.029 (−0.042−0.102) Ljungaverk 26 (26) 0.259 ± 0.008 0.263 ± 0.0063 0.038 (−0.027−0.103) Långsele 36 (34) 0.277 ± 0.0063 0.265 ± 0.0047 −0.010 (−0.072−0.052) Nätrafjället 11 (10) 0.269 ± 0.024 0.261 ± 0.0183 −0.014 (−0.095−0.07) Degerliden 29 (24) 0.275 ± 0.0092 0.267 ± 0.0069 0.001 (−0.067−0.069) Sum 1,288 (1,062) 929 161 30 13 BPC – Background pollen contamination. Nep – effective no. of parents from orchard. Nep2 – effective no. of parents including external pollen donors. Selfing belongs to the category 'Both parents assigned'
* Sample size within parenthesis are the number of samples with high breadth of coverage (≥ 80% of the total number of SNPs) used for heterozygosity and FIS estimatesTable 2.
Results of genetic diversity and parentage analyses. Genetic diversity in orchard crops and natural stands were measured by observed HO and expected HE heterozygosity and inbreeding coefficient FIS.
-
HO HE FIS BPC Selfing Nep Nep2 Age Census no. parents HE 0.94*** FIS −0.88** −0.66 BPC 0.68* 0.74* −0.47 Selfing −0.01 0.19 0.27 −0.13 Nep 0 0.09 0.11 0.01 0.34 Nep2 0.39 0.48 − 0.2 0.78* 0.09 0.57 Age −0.41 −0.42 0.34 −0.44 0.25 −0.31 −0.53 Census no. parents 0.05 0.14 0.07 0.13 0.18 0.93*** 0.61 −0.36 Var(logit(Psuc)) −0.05 −0.12 −0.05 −0.14 −0.40 −0.53 −0.47 0.00 −0.28 Significance level * p < 0.05, ** p < 0.01, *** p < 0.0001
HO – observed heterozygosity; HE – expected heterozygosity; FIS – inbreeding coefficient; BPC – background pollen contamination; Nep – effective no. of parents from orchard; Nep2 – effective no. of parents including external pollen donors; Psuc – relative reproductive successTable 3.
Spearman´s rank correlation between diversity and mating system parameters across orchard crops for both species. Significant ρ are in bold.
-
Orchard Plantval Under the observed BPC Exp. gain BPC Crop BPC Gain Norway spruce Lillpite 10% 0% Lillpite1983 8.7% 9.1% Bredinge 15% 0% Bredinge 2000 26.9% 11.0% Maglehem 10% 0% Maglehem 1993 3.6% 9.6% Maglehem 2000 6.6% 9.3% Scots pine Klocke 5% 40% Klocke 1985 86.5% 1.1% Västerhus 19% 40% Klocke 1996 11.9% 7.3% Lilla istad 11% 40% Klocke 2008 48.2% 4.3% Västerhus 2014 31.1% 21.8% Lilla Istad 2007 43.3% 10.4% Table 4.
Impact of background pollen contamination (BPC) on expected breeding gain.
Figures
(5)
Tables
(4)