


HTML
-
Tea beverages are loved and consumed by many people, and green tea is a popular and extensively consumed beverage worldwide[1]. Tea is a popular drink, mainly made using the leaves of Camellia sinensis, which has a unique taste and aroma, and is beneficial to health[2]. Tea is therefore of great economic significance in many areas, especially in mountainous regions where C. sinensis grows well. For tea, its quality evaluation is mainly determined by its color, aroma, taste and health benefits. The volatile components in tea conduce to form unique flavor and aroma, while the taste, color and health attributes of tea are mainly composed of non-volatile substances[3]. Before the processing of tea leaves, many factors affect the type and content of volatile and non-volatile components, such as altitude, shade, season, variety, climate, soil and fresh leaf storage conditions[4]. According to the taste of consumers and the therapeutic characteristics of bioactive compounds, people have developed many tea products with unique flavor by using different tea varieties, processing technologies and brewing methods[5,6]. Tea can be classified into six categories: green, black, white, yellow and oolong. Due to different processing methods, the metabolic characteristics of tea made from the same fresh leaf materials are also widely divergent[7,8].
Green teas are non-fermented and they are widely consumed in China, Japan, Korea and elsewhere, owing to their refreshing flavors and valuable health benefits[9]. Green teas are rich in natural phenolic compounds with anti-oxidant, anti-cancer and anti-microbial properties[10]. In addition, regular tea intake has positive effects on patients with elevated blood pressure or hypertension[11]. Yuhua tea is a well known Chinese stir-fried green tea, which originated from, and is mainly produced in, Nanjing, Jiangsu Province, China. The content of the tea is the basis of its quality. The change in the tea content during processing directly affects the quality and flavor of the tea. The biochemical components of green tea mainly include the following: tea polyphenols, amino acids and caffeine. The content and ratio of each component determines the tea's taste. In the past, research on the change in the content of stir-fried green tea was mostly limited to analysis of the start and end samples, while research on the dynamic changes in the metabolites during green tea production was limited.
The chemical changes in tea processing could not be detected accurately prior to the non-target metabolomics methods developed, which provide a highly sensitive tool for detection of the chemicals. In some non-targeted studies, liquid chromatography in tandem with mass spectrometry (LC-MS)[12,13], gas chromatography in tandem with mass spectrometry (GC-MS)[14], nuclear magnetic resonance (NMR)[4] and Ultra-High-Performance liquid chromatography (UPLC)[15] are used to analyze the metabolites in tea. In recent years, a broadly targeted metabolomics process has been developed by LC-MS technology, which is based on a new strategy of stepwise multi-reaction monitoring-enhanced production (MRM–EPI)[16], and it complements the disadvantages of non-targeted metabolomics and a targeted metabolism. In MRM mode, the inherent triple quadrupole linear ion trap (LC–Q-TRAP)–MS can not only accurately quantify thousands of compounds, but also recognize new compounds based on the self-built metware database (MWDB). This broadly targeted metabolomics method has been used to assess the metabolite differences between wild rice species in China and North America, in which it successfully identified 672 metabolites[16]. Additionally, using this method, Wang et al.[17] detected and annotated 213 metabolites in sweet potatoes with different flesh colors.
In this study, C. sinensis 'Yinshuang' was used as the raw material to produce stir-fried green tea in accordance with the usual method of Yuhua tea processing. The metabolites at each stage were detected precisely, and the metabolites showing obvious changes at each stage were screened. Research on changes in moisture, taste components and other components related to the quality of stir-fried green tea will provide a scientific basis for determining a reasonable quality index for stir-fried green tea. Therefore, it is of significance to determine the changes in metabolites that occur during the processing of stir-fried green tea.
-
All the chemicals used in this study for liquid chromatography were of chromatographic grade. Acetonitrile, methanol and formic acid were purchased from Merck (Darmstadt, Germany). Acetic acid and methyl alcohol were purchased from Tedia Co. (Fairfield, OH, USA). Deionized water was purified using a Milli-Q water purification system (Millipore, Billerica, MA, USA). Standard substances (dissolved in dimethyl sulfoxide or methanol, stored at –20 °C and diluted with 70% methanol to appropriate concentrations before MS) were purchased from BioBioPha Co., Ltd (Yunnan, China).
Tea processing and sampling
-
Shoots with one bud and one leaf were freshly plucked from tea plants (C. sinensis 'Yinshuang') grown on a tea farm in Hengxi County (Nanjing, Jiangsu Province, China) (31°43′4″N, 118°44′59′′E) on April 12, 2019.
The manufacturing process of stir-fried green tea can be approximately divided into the following five stages: plucking fresh leaves (S1), spreading (S2), fixation (S3), rolling (S4) and drying (S5), which are shown in Fig. 1.
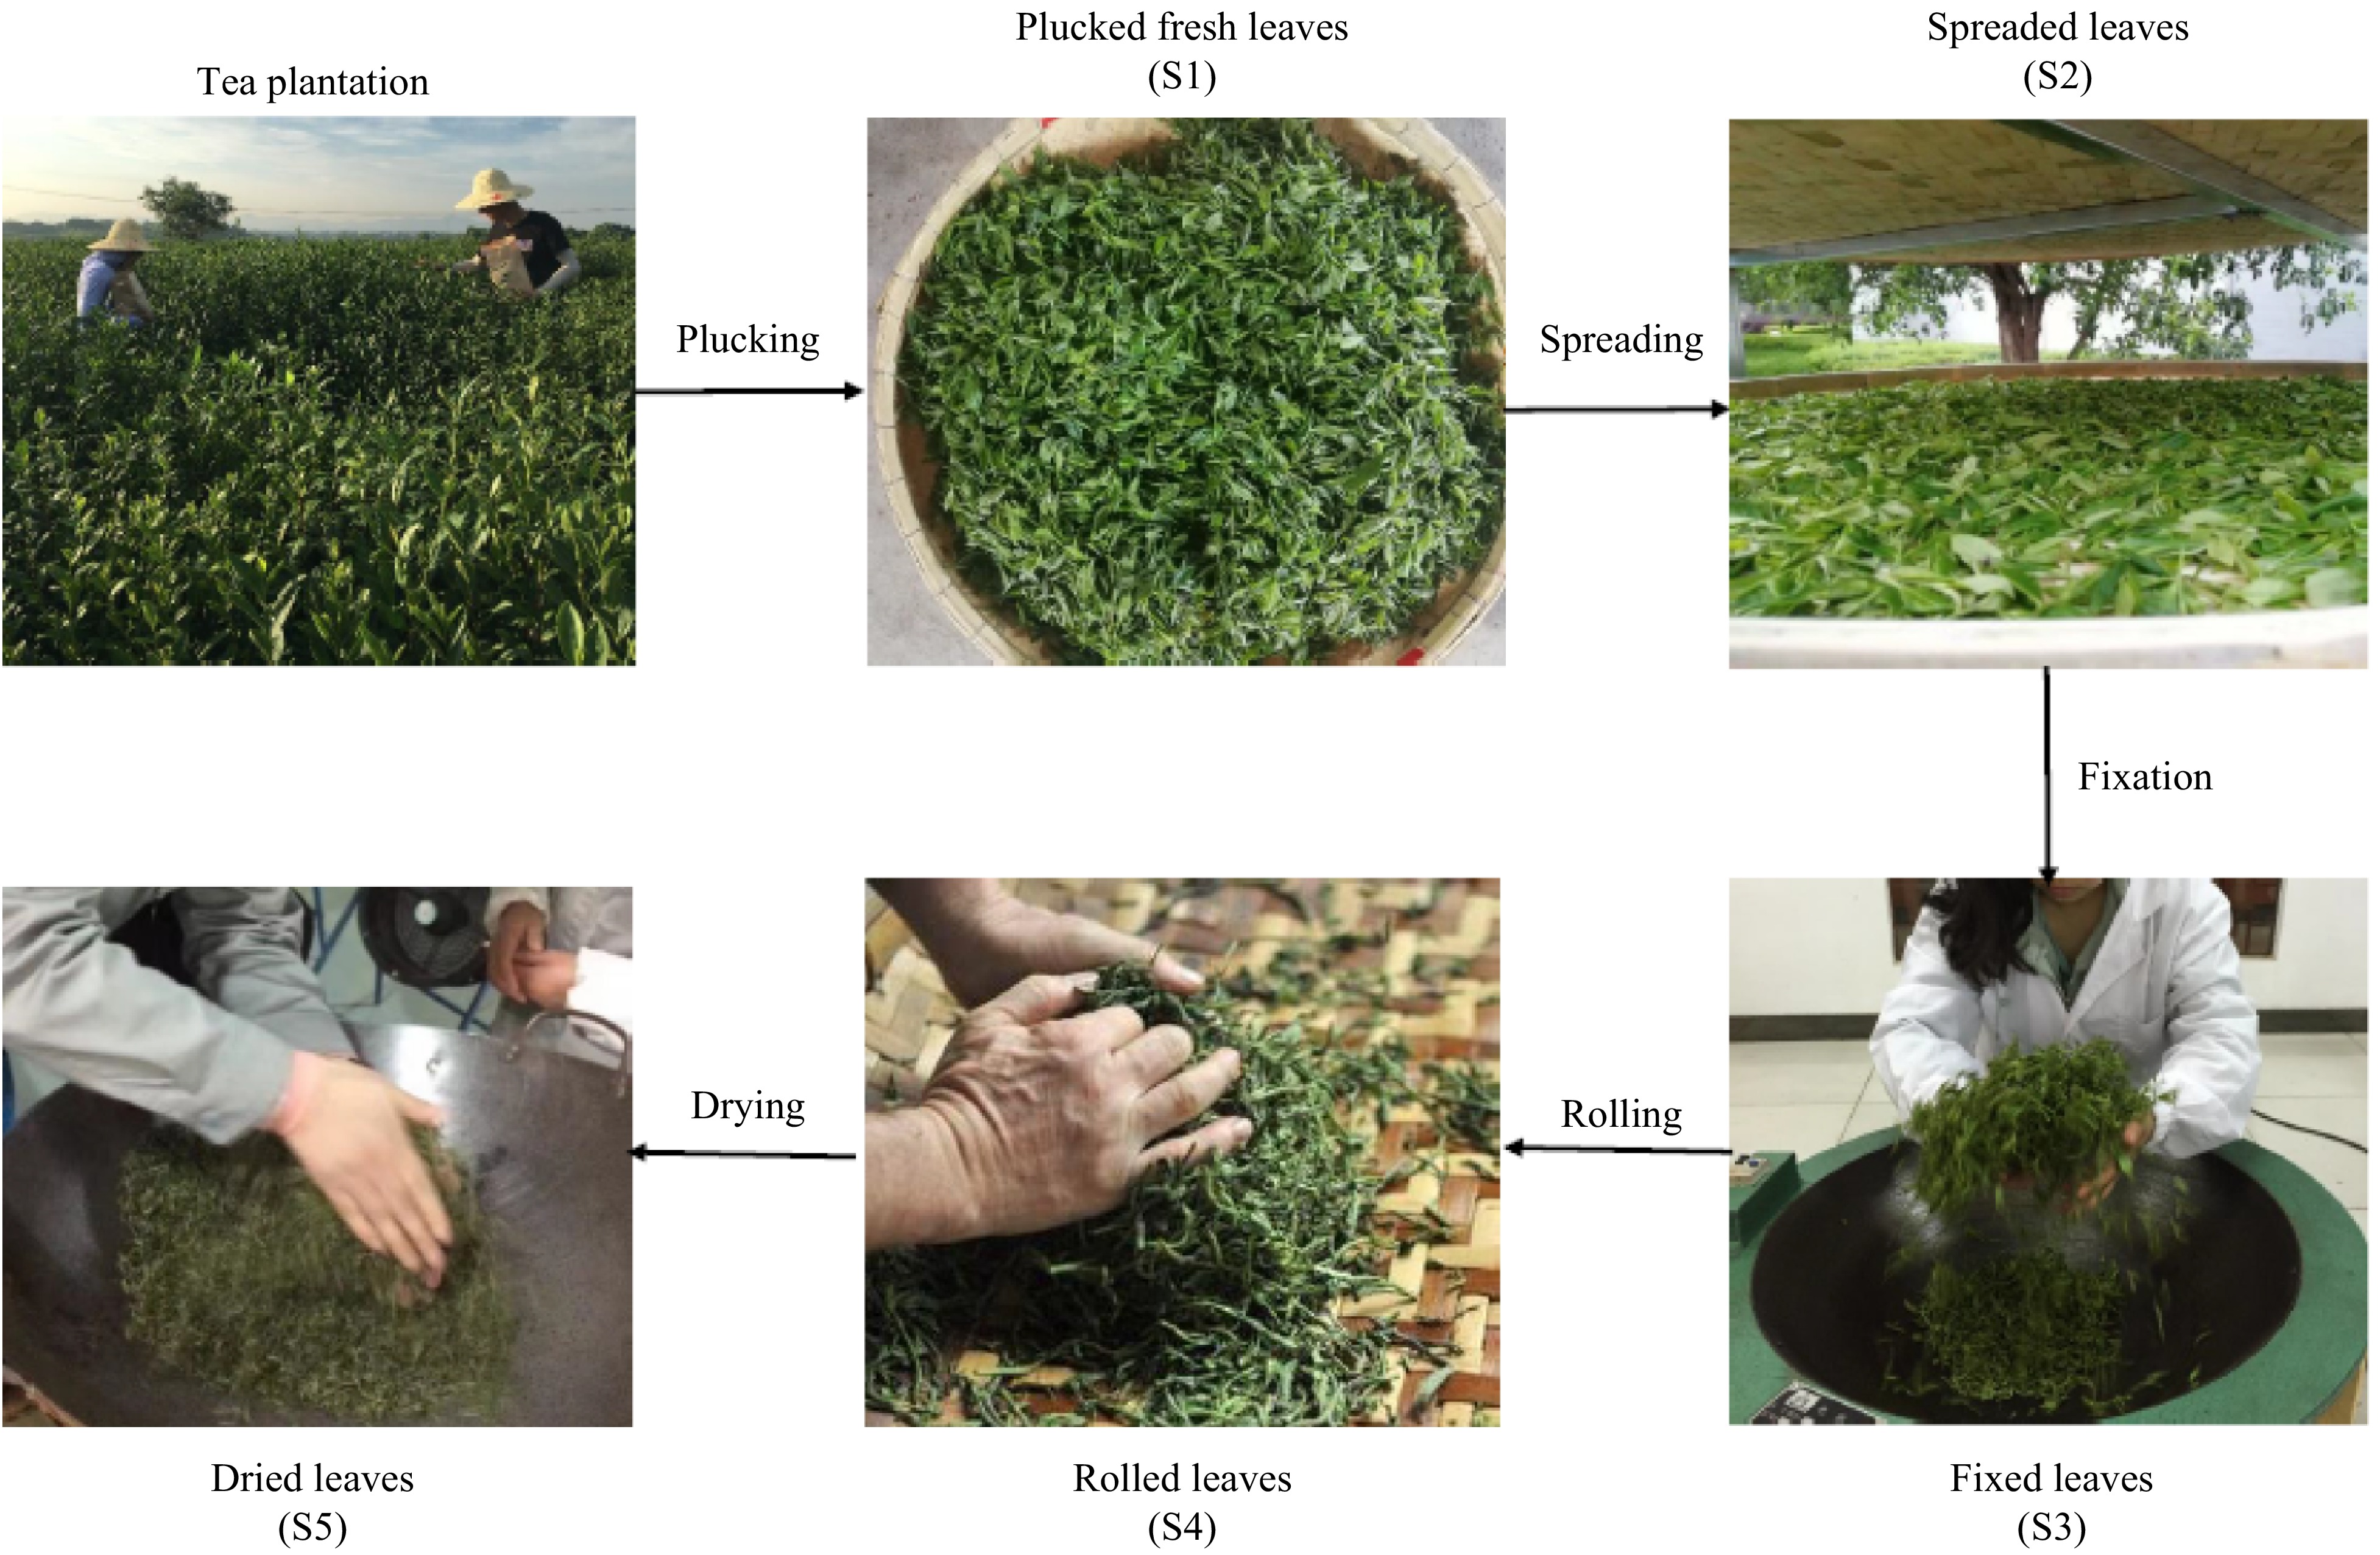
Figure 1.
The Yuhua tea (stir-fried green tea) processing of 'Yinshuang' tea leaves. Photographs show the five major stages of the Yuhua tea manufacturing process: plucking (S1), spreading (S2), fixation (S3), rolling (S4) and drying (S5).
After the fresh leaves were plucked (S1), they were placed on a water screen in a cool and well ventilated place at a thickness of 2–3 cm for 2 h (S2). When the spreading period was completed, the leaves were put into a pot at 240 °C for 5 min (S3) to terminate enzymatic activities. Then, the fixed leaves were rolled for 15 min at room temperature (28–30 °C) to tighten the tea strips and moderately injure the leaf cells (S4). Finally, the rolled leaves were placed into a drying machine at 120 °C for 20 min and then at 80 °C for 30 min (S5). Samples were collected at S1, S2, S3, S4 and S5, and were frozen immediately in liquid nitrogen and stored at −80 °C for further study.
Sample preparation and extraction
-
The freeze-dried leaves were crushed using a mixer mill (MM 400, Retsch) with a zirconia bead for 1.5 min at 30 Hz. Then, 100 mg powder was weighed and extracted overnight at 4 °C with 0.6 ml 70% aqueous methanol. Following centrifugation at 10,000 ×g for 10 min, the extracts were absorbed (CNWBOND Carbon-GCB SPE Cartridge, 250 mg, 3 ml; ANPEL, Shanghai, China,
http://www.anpel.com.cn/ ) and filtrated (SCAA-104, 0.22-μm pore size; ANPEL) before UPLC–MS/MS analysis[18].HPLC condition
-
The sample extracts were analyzed using an UPLC–ESI–MS/MS system (UPLC, Shim-pack UPLC SHIMADZU CBM30A system,
http://www.shimadzu.com.cn/ ; MS, Applied Biosystems 4500 Q TRAP,http://www.appliedbiosystems.com.cn ). The UPLC used a Waters ACQUITY UPLC HSS T3 C18 column (1.8 µm, 2.1 mm × 100 mm). The mobile phase was solvent a. 0.04% acetic acid, solvent B, acetonitrile and 0.04% acetic acid were added to pure water. The gradient procedure is used to measure the sample, which uses the starting conditions of 95% A and 5% B. Within 10 min, the linear gradients were programmed to 5% A and 95% B and held for 1 min. The composition of 95% A and 5.0% B was then adjusted within 0.10 min and held for 2.9 min. The column greenhouse is set at 40 °C. The injection volume was 4 μl. The effluents were alternately connected to ESI-QQ-Trap-Ms.ESI-Q TRAP-MS/MS
-
The LIT and QQQ scans were obtained on the API 4500 Q TRAP UPLC/MS/MS system. The system is equipped with an ESI Turbo ion spray interface, operated under positive ion and negative ion mode, and controlled by Analyst 1.6.3 software (AB 1.6.3). The working parameters of the electrospray source are: ion source and turbine spray. Source temperature, 550 °C; Ion jet voltage, 5,500 V (positive ion mode) / −4,500 V (negative ion mode); The ion source gas I, gas II and curtain gas are set at 50, 60 and 30.0 psi respectively; The collision gas is very high. Instrument tuning and mass calibration using 10 and 100 μM in QQ and lit mode respectively. Qqq scan was obtained as MRM experiment, and collision gas (nitrogen) was set to 5 psi. The DP and CE of single MRM conversion are further optimized[18].
Based on the metabolites eluted in each cycle, a specific set of MRM transitions in each cycle was monitored.
Determination of total free amino acids
-
The total amount of free amino acids were determined according to GB/T8314-2013.
Data processing
-
The original data files obtained from UPLC–MS/MS analysis were imported into Progenesis QI software (Waters, Manchester, UK). The metabolites were identified by accurate quality, MS2 spectrum, metabolomics database and literature. We first used the human metabolome database (
http://www.hmdb.ca ), and ChemicalSpider (http://www.chemspider.com ), and then queried the Metlin database (http://metlin.scripps.edu ). A table containing the following information was generated: mass charge ratio (m/z), retention time, molecular weight and ionization model of each metabolite in the sample. By comparing with blank samples, the data set was manually corrected to remove system pollutants and uninformative data, and then the data is normalized to sample weight before carrying out various statistical analysis.Statistical and multivariate analyses
-
Data for all the chemical assays are represented as means ± SD from three independent biological replicates. A principal component analysis (PCA) was performed using SIMCA-P+ 14.1 software (Umetrics, Umeå, Sweden). PCAs are generally used to obtain a better visualization by projecting the objects of the dataset into the spaces of the first few components. A one-way analysis of variance (Duncan's new multiple range test) using the DPS software package (
http://www.chinadps.net/index.html ) was performed. A supervised orthogonal partial least squares-discriminant analysis (OPLS-DA) was performed to separate variations among samples and to identify nonvolatile components which is important for class separation[19]. OPLS-DA models were used to visualize the dissimilarities/distinctbuions among samples. The quality of each OPLS-DA model was evaluated by employing three parameters: R2X, R2Y and Q2Y. The goodness-of-fit measure was quantified by R2X and R2Y, and the predictive ability was indicated by Q2Y. Models were subjected to a seven-fold cross-validation, and the reliabilities of the models were rigorously confirmed by a permutation test (n = 200). The data points on the OPLS-DA loading plot were assigned a variable of importance (VIP). The VIP value of the metabolite was calculated. A VIP value greater than 1 indicates that the metabolite has a significant contribution to the separation of the sample group in the OPLS-DA model[20].
Chemicals
-
To minimize the influences of other factors, samples from each stage were collected from the same producer on the same day. Supplemental Fig. 1 and Supplemental Fig. 2 present the total ion chromatograms of the quality control sample and substances detected during all processing stages of stir-fried teas. In total, 898 metabolites were detected in the samples and profiled in a heatmap (Fig. 2a). The relative contents of individual compounds were similar between the three biological duplicates of each stir-fried tea but remarkably different among the different stages of stir-fried tea production, except the stir-fried metabolites between S3 and S4.

Figure 2.
Heatmap and principal component analysis (PCA) plot of three Yuhua tea samples with three duplicates. (a) Heatmap; (b) 2D score scatter plots of the PCA for five samples (S1, S2, S3, S4, S5 and QC). The QC (quality control) sample was a mixture of S1, S2, S3, S4 and S5.
To visualize the sample similarities, the metabolites were subjected to a PCA (Fig. 2b) to preliminarily understand the overall metabolic differences between samples in different groups and the variations among samples within groups. Among groups, there was a trend of metabolomics separation, indicating differences in metabolomics between sample groups[21]. The mixed quality control samples clustered in the center of the PCA score plot, indicating that the compound extractions and LC–MS analysis were reliable.
The first and second PCs explained 32.25% and 15.31% of the total variance, respectively. In the PCA score plot, the S3 and S4 samples were closely clustered, and there were significant separations among S1, S2, S3/S4 and S5. As a result, S1 and S5 were distinctly separated only by PC1 (32.25%), S1 and S2 were clearly separated by PC2 (15.31%) and they were also discriminated by PC1 (32.25%). The other samples were significantly separated by PC1 (32.25%) and PC2 (15.31%), with the exception of S3 and S4.
The PCA score plot showed that the metabolites at each stage had changed significantly, except S3 to S4. S3 was close to S4 on the PCA score plot, suggesting that the metabolites of S3 were similar to those of S4, indicating that spreading, fixation and drying caused the metabolites of tea leaves to change distinctly.
Changes in the main biochemical component content in tea during different manufacturing processes
-
The main biochemical components of green tea are tea polyphenols, amino acids and caffeine. The content and ratio of each component determines the quality of the tea's taste. The astringency and bitterness of green tea are believed to be closely related to some nonvolatile compounds, including polyphenols, catechins[22] purine alkaloids and caffeine[23]. Thus, in this study, we detected the content of tea polyphenols, caffeine and free amino acids using UPLC (Fig. 3). The tea polyphenol content increased significantly during the fixation and drying processes but decreased obviously during the rolling stage (Fig. 3a). The differences in caffeine content were not statistically significant among the five manufacturing stages (Fig. 3b). Amino acids determine the fresh taste of green tea, and, although the amino acid content showed an obvious downward trend, the content in the final production stage remained high (Fig. 3c).
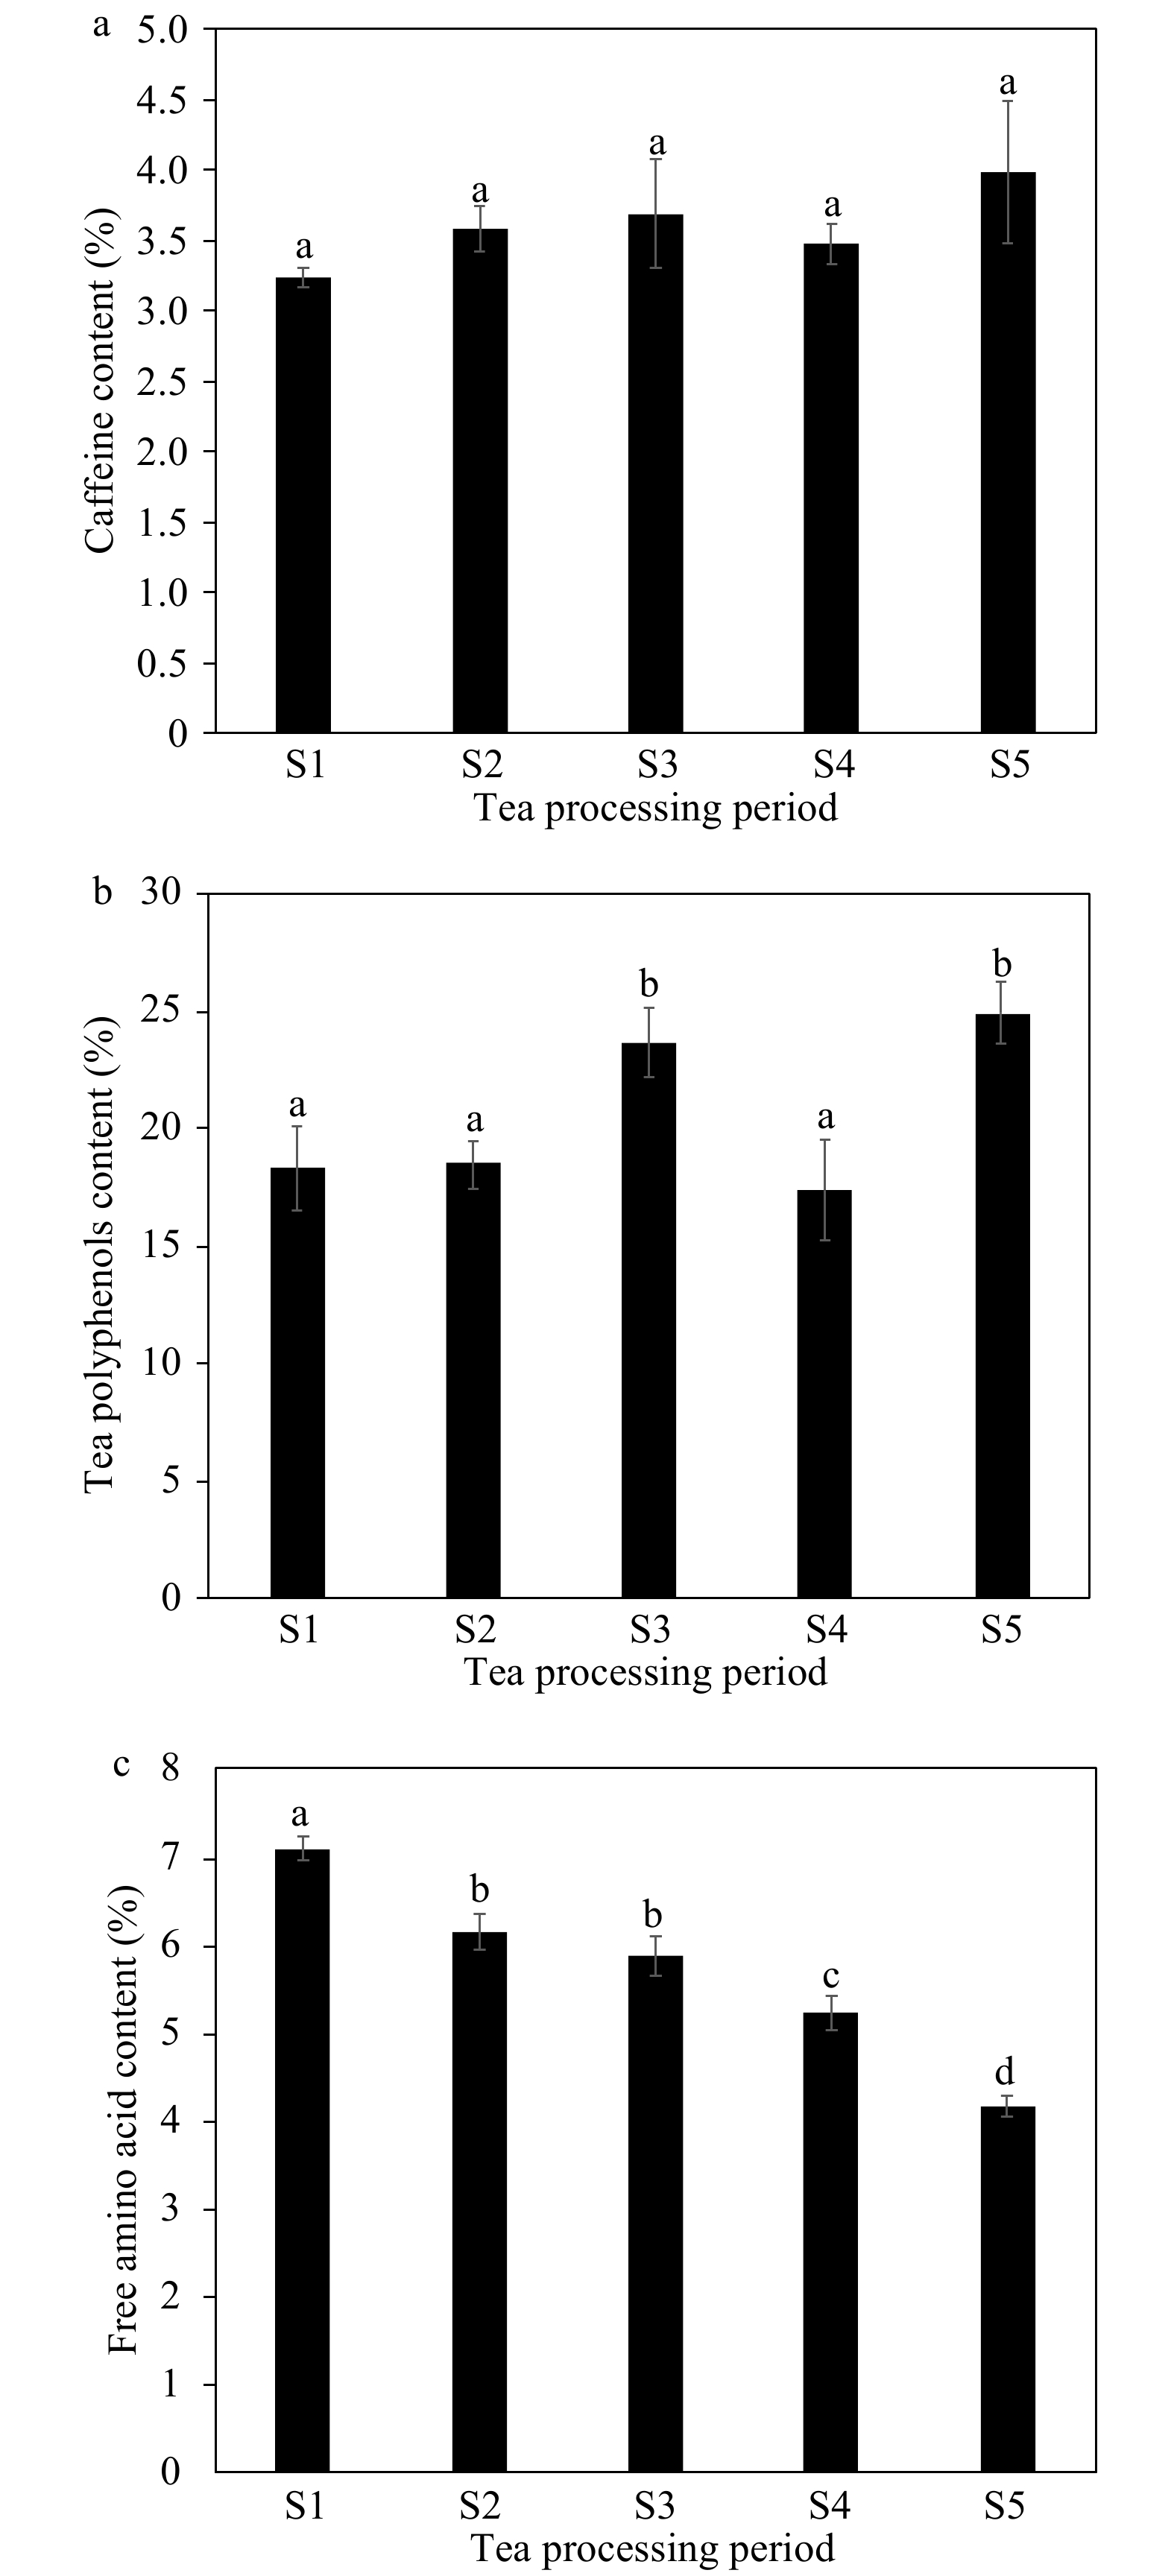
Figure 3.
Changes in the main biochemical component content of tea during different manufacturing processes. The changes in (a) tea polyphenols, (b) caffeine and (c) free amino acid content during different tea processing stages.
Characterization of four comparisons of differential metabolites
-
A total of 898 compounds were extracted, and OPLS-DA modeling was applied to the LC–MS datasets to determine which metabolites were significantly changed during the different stage of Yuhua green tea manufacturing (Fig. 4a–e). Compared with a PCA, OPLS-DA maximizes the differentiations between groups, which is helpful for finding differential metabolites. OPLS-DA combines orthogonal signal correction and PLS-DA, which decomposes the X-matrix information into Y-related and irrelevant information and selects the difference variables by removing the irrelevant differences. Using the OPLS-DA model, the metabolomics data were analyzed, and a score map of each group was constructed to further illustrate the differences among the groups[24]. These models were constructed with data from samples taken at different stages of the tea manufacturing process. Potential biomarkers for separation by shade effects were subsequently identified using S-plots, which represented covariance (p) against correlation (p-corr)[25].
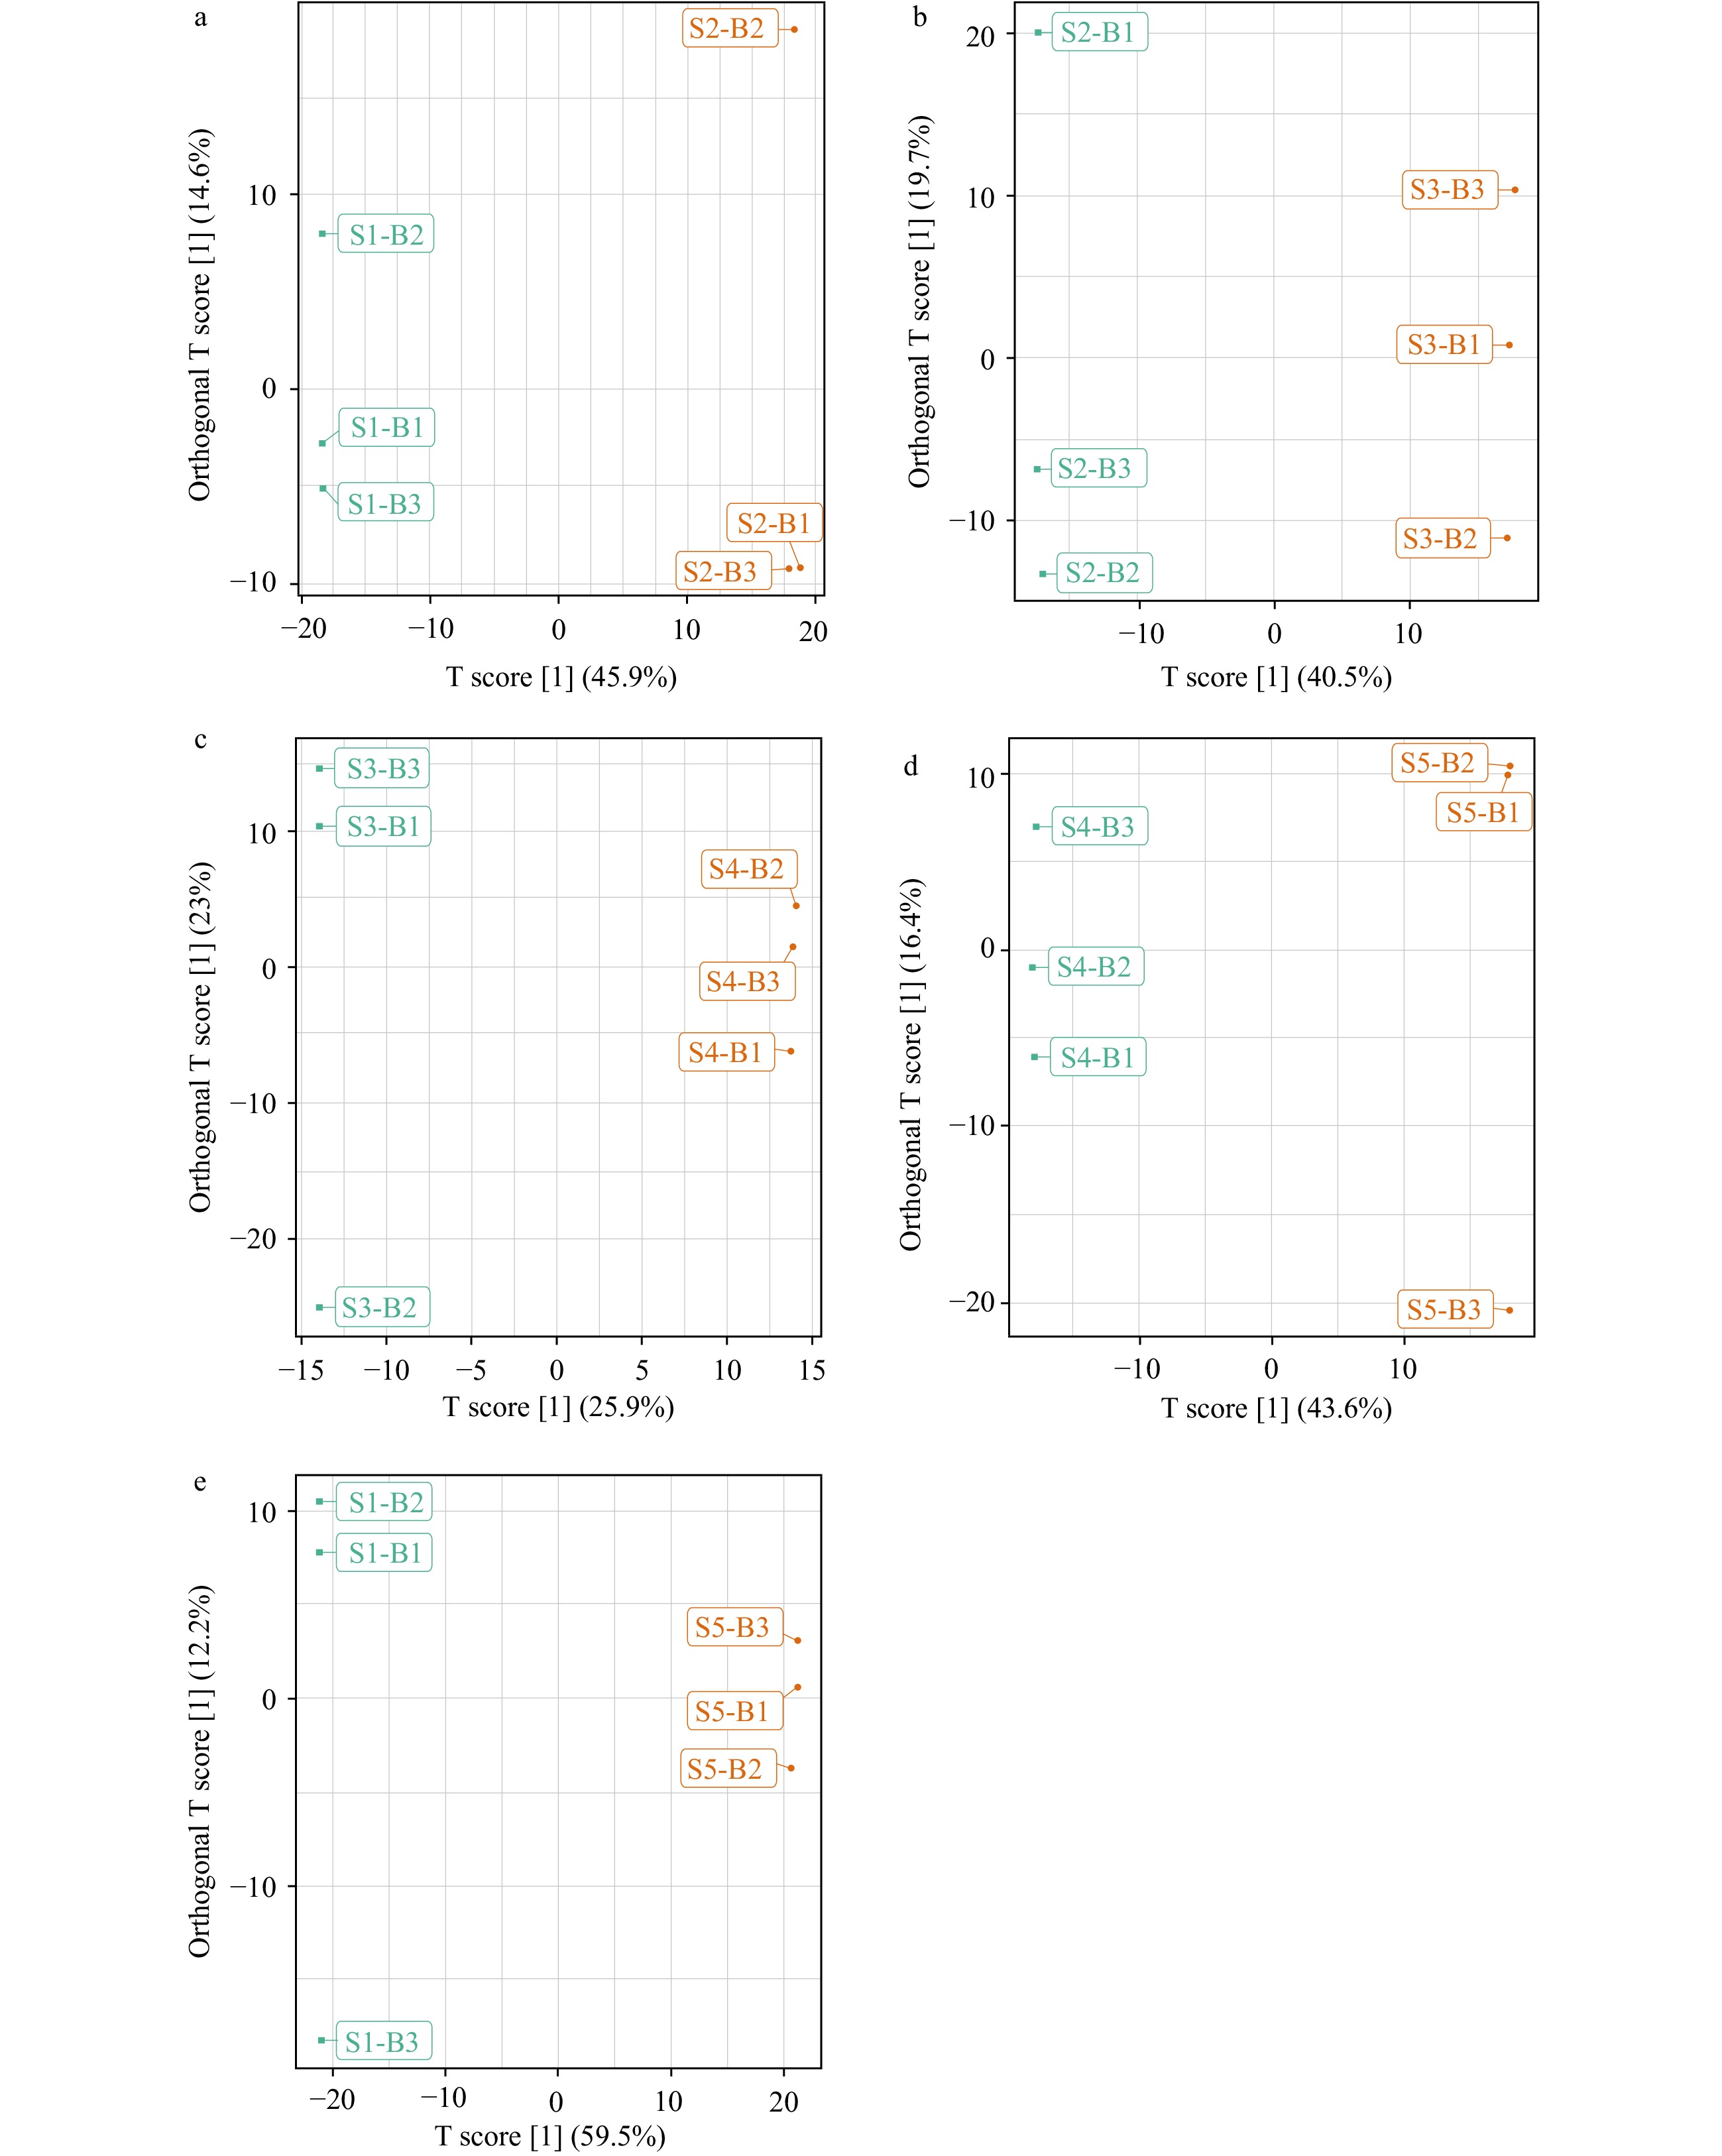
Figure 4.
Orthogonal projections to latent structures-discriminant analysis (OPLS-DA). Score scatter plots of the OPLS-DA model for S1 vs S2 (a), S2 vs S3 (b), S3 vs S4 (c), S4 vs S5 (d) and S1 vs S5 (e).
Pairwise comparisons of the metabolite contributions between S1 and S2, S2 and S3, S3 and S4, and S4 and S5 were performed using the OPLS-DA models (Supplemental Fig. 3) further supporting that the two models were meaningful, and their differential metabolites were screened using the VIP value analysis. As shown in Fig. 3 and Fig. 4, each comparison was clearly separated, with the S1 triplicates all grouped to the left and the S2 triplicates to the right (Fig. 4a). Similar results were obtained between S1 and S2, S2 and S3, S3 and S4, S4 and S5, and S1 and S5 (Fig. 4b–e), providing visual evidence of the clustering of tea samples by manufacturing process.
The above OPLS-DA models were then used to construct an S-plot (Fig. 5a–e), which provided a graphical projection of specific compounds. Metabolites far from the plot origin contributed greatly to the separation between different samples. The abscissa represents the covariance between the PC and the metabolite, and the ordinate represents the correlation coefficient between the PC and the metabolite. The closer the metabolite is to the upper right corner and the lower left corner, the more significant the difference. The red dots indicate that the VIP values of these metabolites are greater than or equal to 1, and the green dots indicate that the VIP values of these metabolites are less than 1. As shown in Fig. 5a and 5b, 167 and 150 compounds (Supplemental Table 2) contributed significantly to the separations between S1 and S2 and between S2 and S3, respectively. As shown in Fig. 5c and 5d, 26 and 95 compounds (Supplemental Table 2) are significantly different metabolites that contribute to the separations between S3 and S4 and between S4 and S5, respectively. As shown in Fig. 5e, 306 compounds (Supplemental Table 2) are significantly different metabolites that contribute to the separations between S1 and S5. They are the compounds from the S-plot that were farthest in the positive and negative directions, respectively, from the origin. The farther a compound was from the origin, the greater its contribution to the distinction between samples.
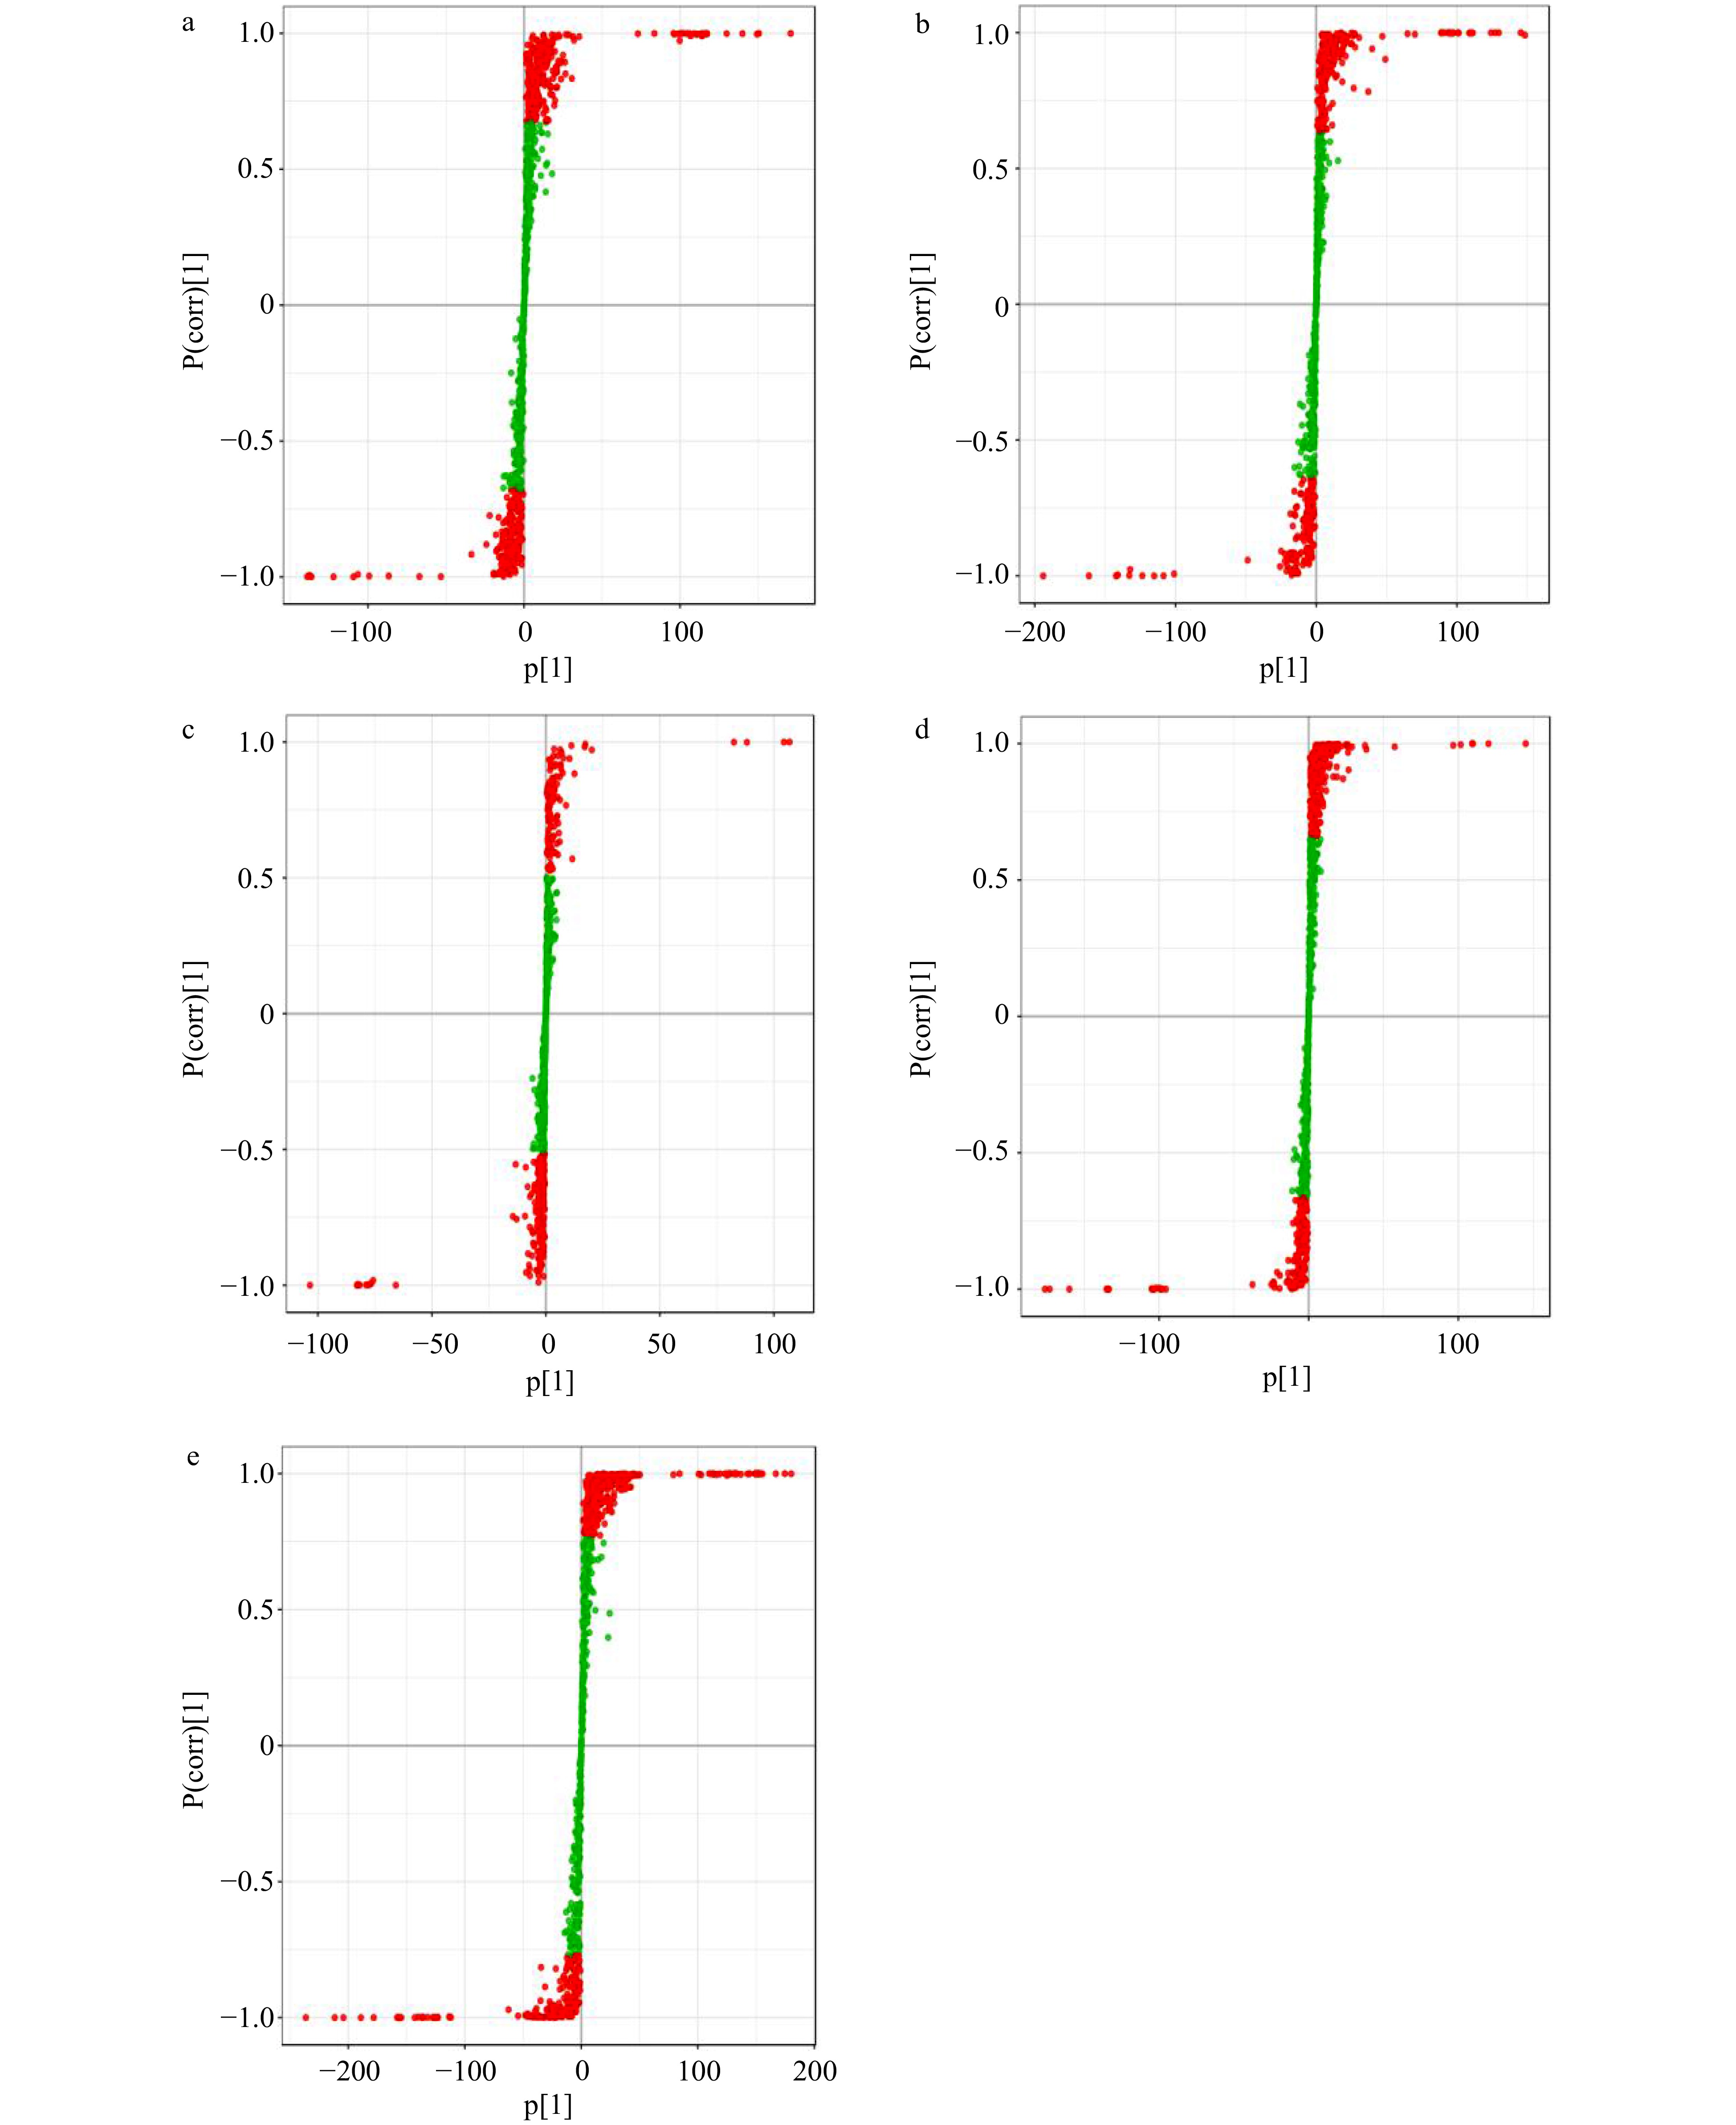
Figure 5.
Orthogonal projections to latent structures-discriminant analysis (OPLS-DA). S-plots of the OPLS-DA model for S1 vs S2 (a), S2 vs S3 (b), S3 vs S4 (c) and S4 vs S5 (d), S1 vs S5 (e).
The heatmap analysis characterized the relative content of the recognized differential metabolites in the Yuhua teas at the five different tested stages (Fig. 6). The color coding, from red to green, indicates their relative content, from high to low, respectively. As shown in Fig. 6a–d, the differential metabolites were clearly clustered into two differently colored sections, indicating that significant differences existed between S1 and S2, S2 and S3, S3 and S4, and S4 and S5.
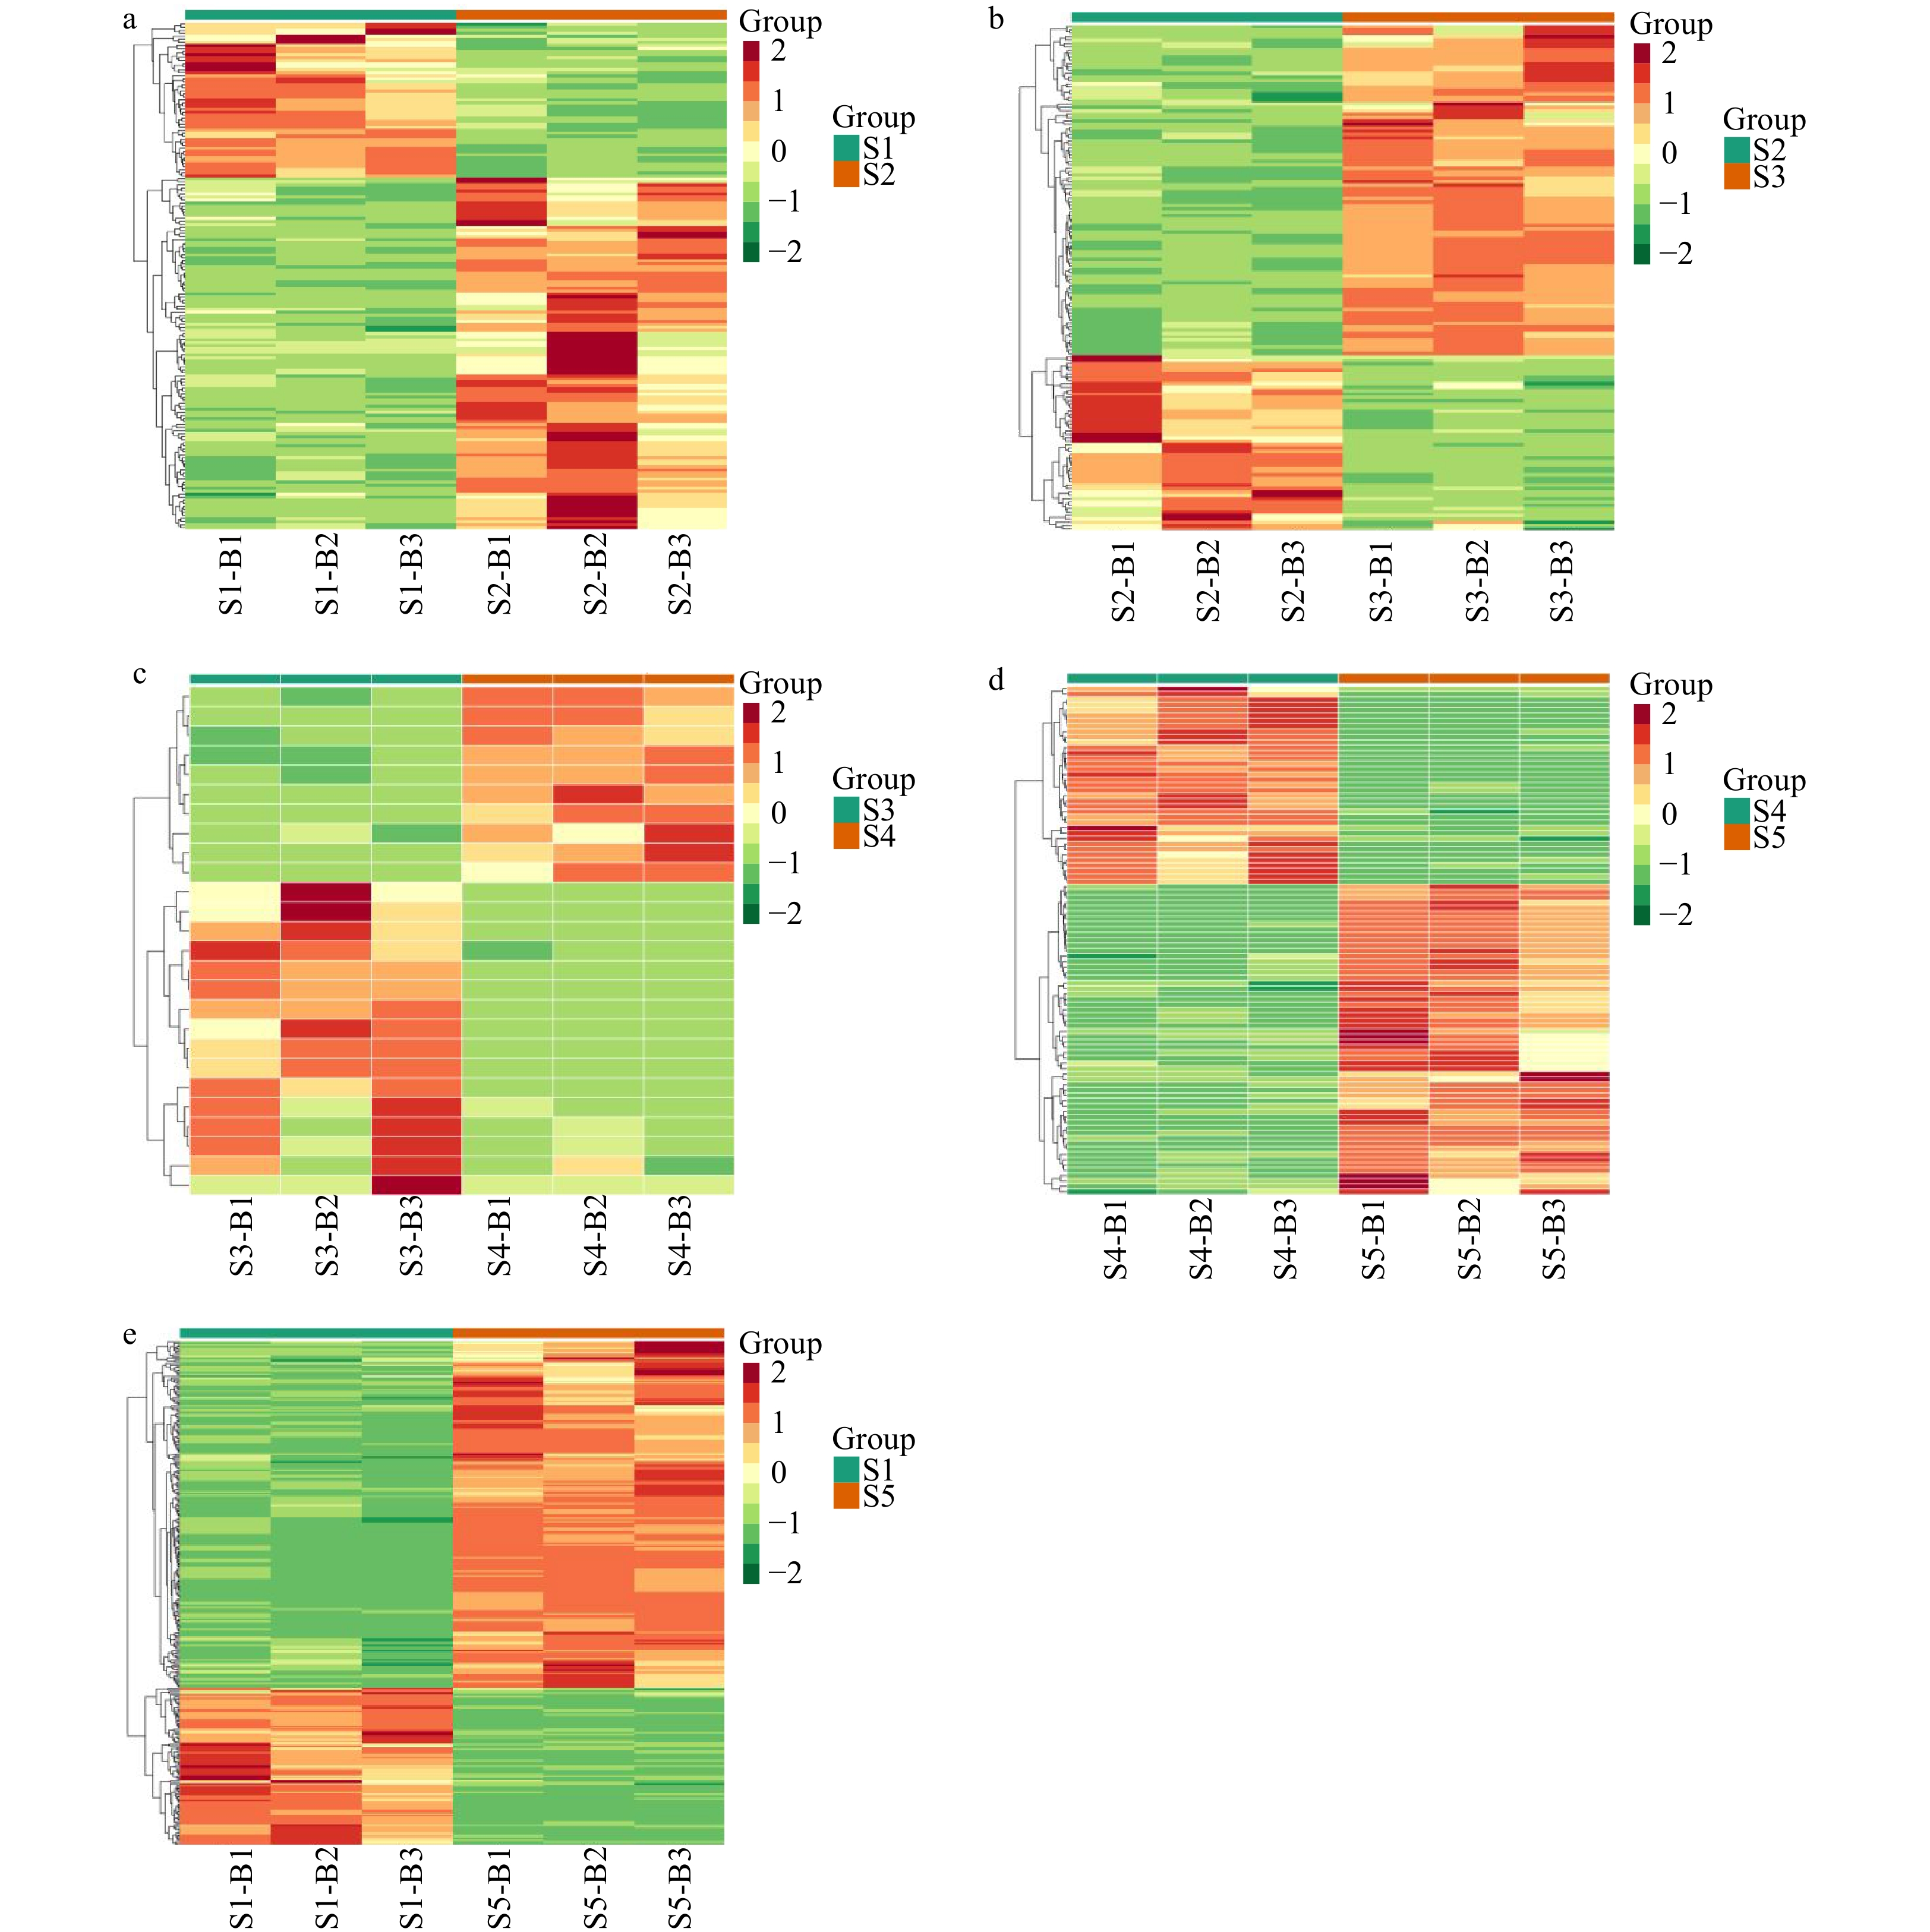
Figure 6.
Four pairwise heatmaps of all the identified compounds from the five stir-fried green teas. Pairwise heatmaps of the relative differences in metabolites between (a) S1 and S2, (b) S2 and S3, (c) S3 and S4, (d) S4 and S5 and (e) S1 vs S5. Red and green indicate higher and lower abundances, respectively.
Changes in the metabolites between S1 and S2
-
As shown in Fig. 7a, 167 significantly different metabolites were detected between S1 and S2. The expression levels of 116 metabolites were obviously increased and 51 metabolites were clearly decreased. Flavonoids, organic acids and their derivatives, amino acids and their derivatives, and lipids were mainly increased metabolites, including engeletin, apigenin C-glucoside, quercetin 3-O-rutinoside, quercetin 7-O-rutinoside, isovitexin 7-O-glucoside, trans-citridic acid, sebacate, punicic acid, proline, quercetin O-acetylhexoside and luteolin 3',7-di-O-glucoside. The flavonoids (47 kinds) accounted for the largest proportion among the significantly increased metabolites. The decreased metabolites mainly included nucleotides and their derivatives, isoacteoside, and vitamins and their derivatives, including p-coumaraldehyde, hydrocinnamic acid, L-ascorbate, niacinamide and 2-(formylamino) benzoic acid.
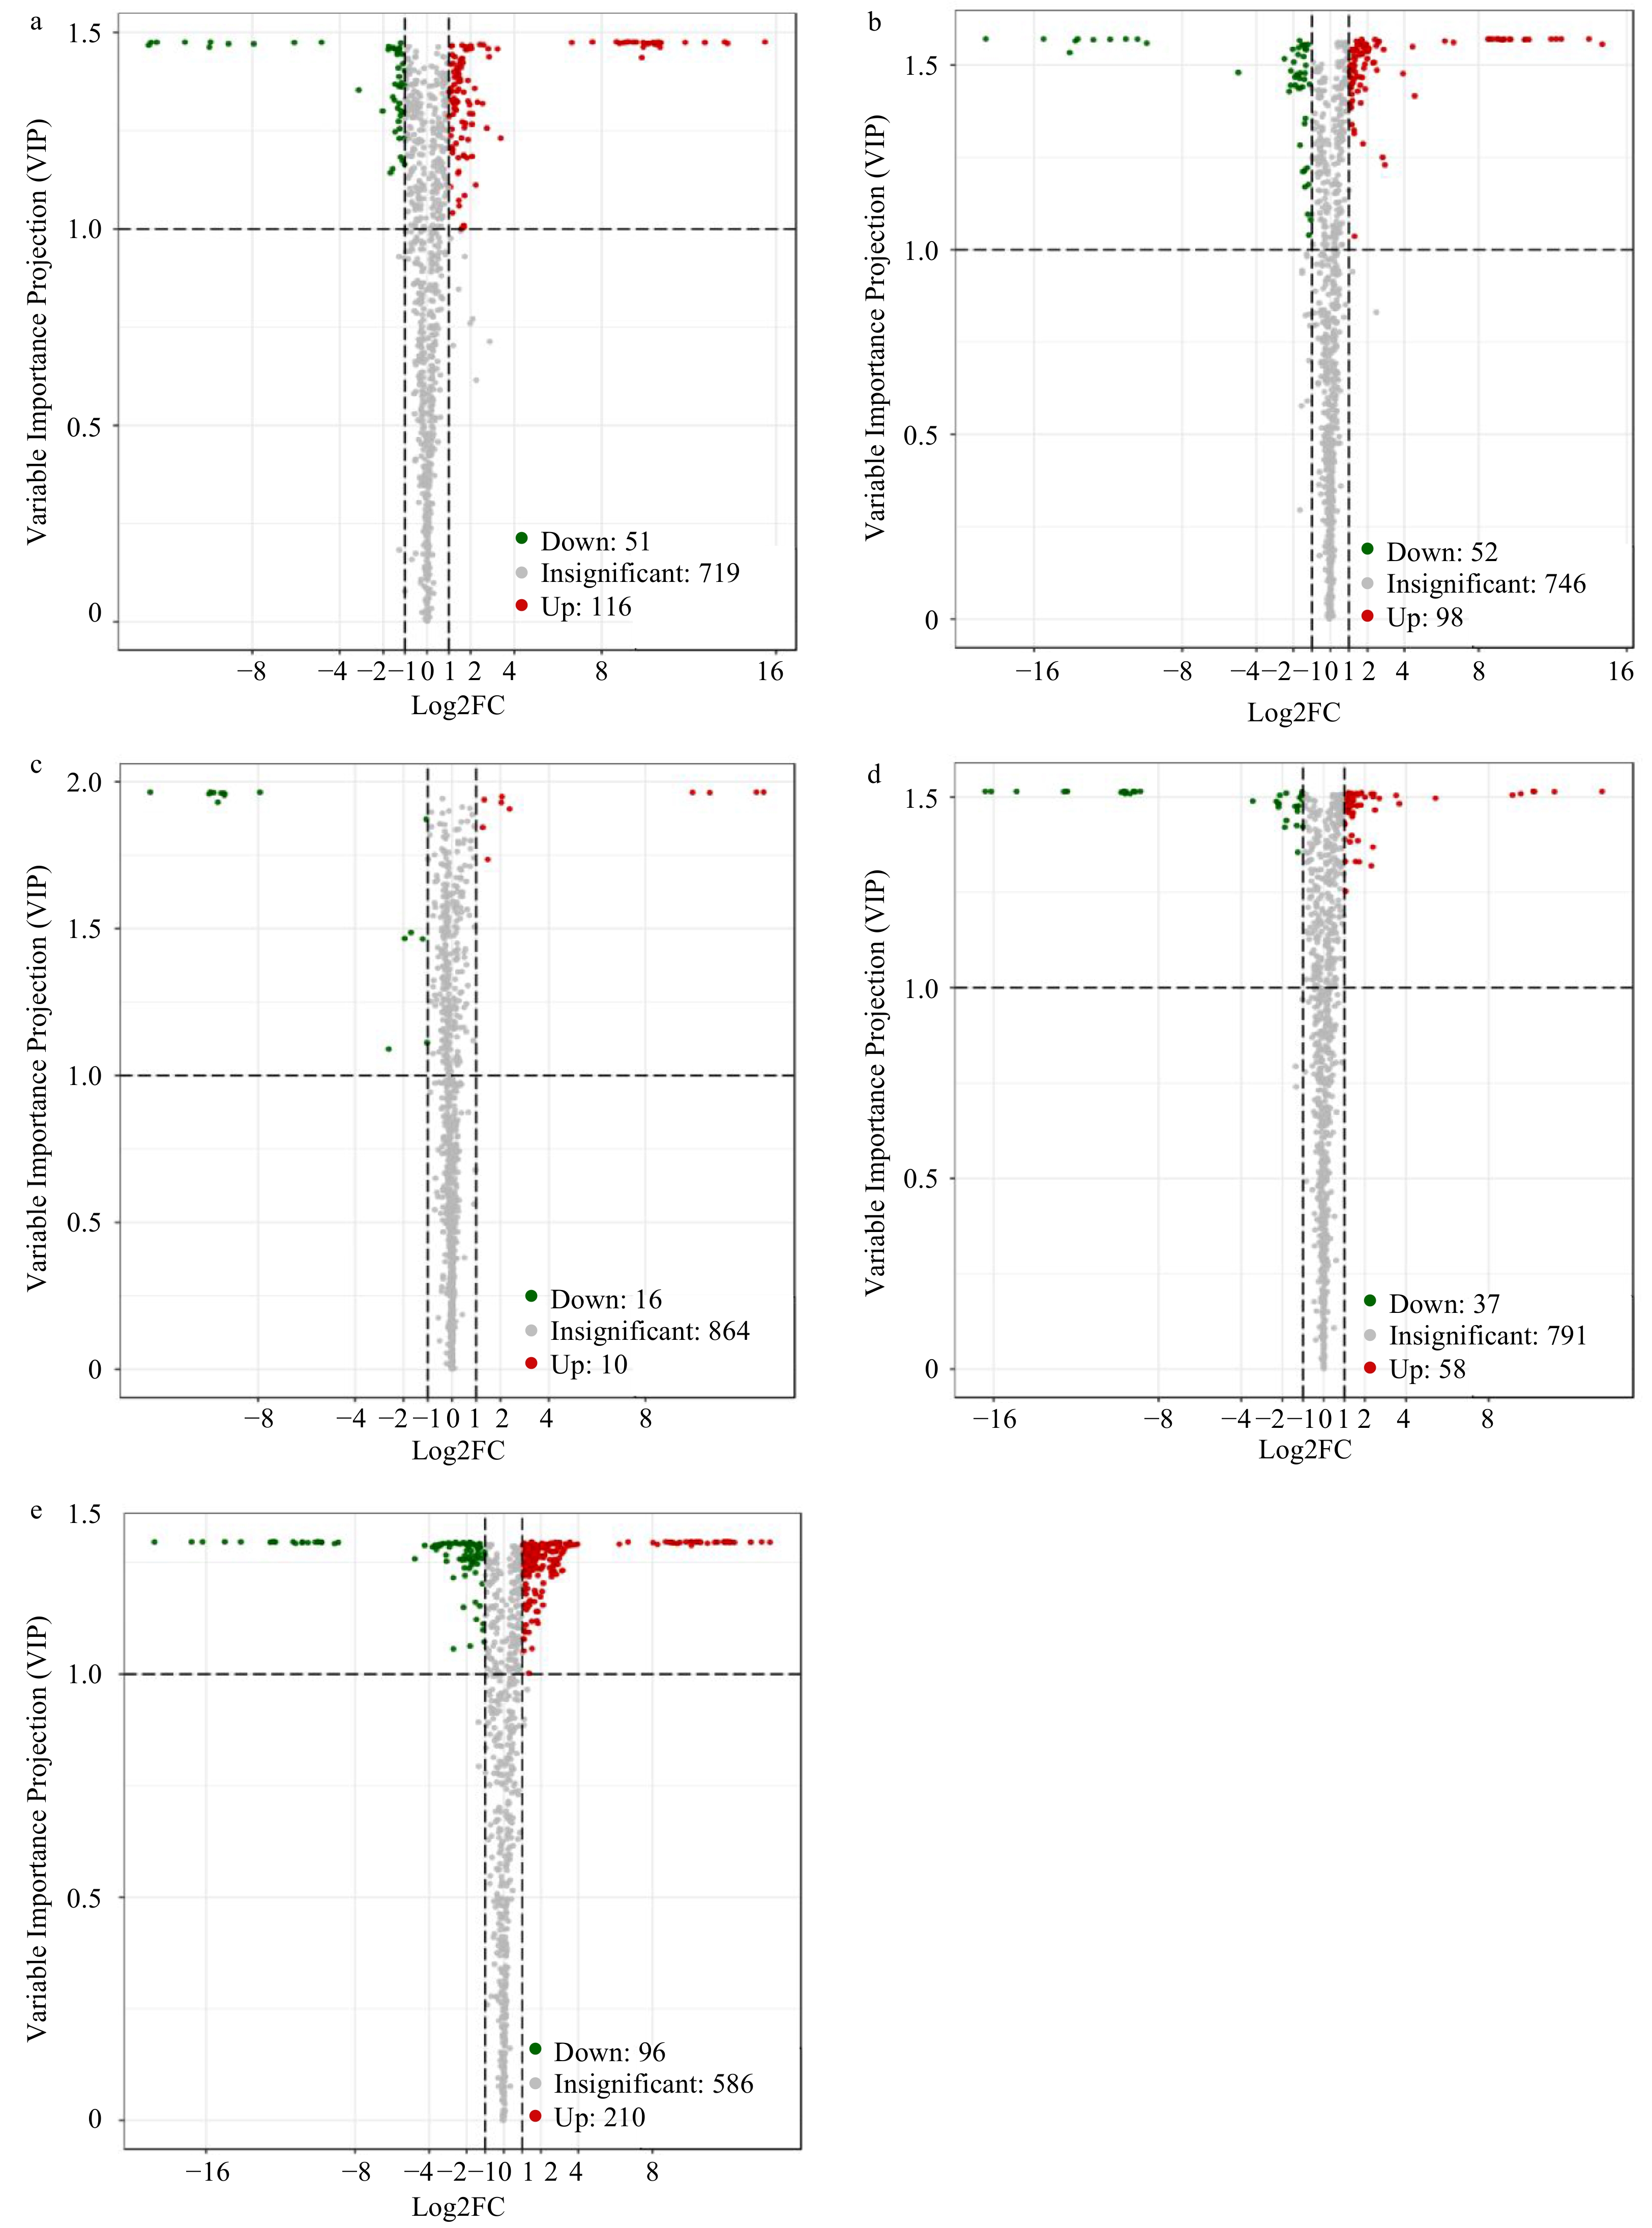
Figure 7.
Differential metabolite analyses for different stages using the criteria VIP ≥ 1 and FC ≥ 2 or ≤ 0.5. Volcano plots of differential metabolites between (a) S1 vs S2, (b) S2 vs S3, (c) S3 vs S4, (d) S4 vs S5 and (e) S1 vs S5. Red and green dots represent increased and decreased differential metabolites, respectively; gray dots represent non-differential metabolites.
As the main secondary metabolites in plants, flavonoids are the most important quality-related compounds, contributing to the color, taste and aroma of brewed tea[26]. The synthesis and accumulation of flavonoids occurs in response to environmental cues[27]. Flavonoids are the main growth and defense regulators in plants, and they are induced and biosynthesized as the result of long-term natural selection and acclimatization processes[28]. The spreading of freshly plucked leaves may represent a stressful environmental change, which results in the increased metabolic levels of flavonoids. In addition, the proline content increased, which also indicates a stress response. Moreover, during this process, the overall expression levels of amino acids and their derivatives increased significantly, which may be as a result of protein degradation initiated by proteases and peptidase released from damaged cells[29] or dissimilated from sugars[30].
Changes in the metabolites between S2 and S3
-
In total, 150 significant differences in metabolites were found between the S2 and S3 samples. In the score plots (S2 vs S3, Fig. 2b), S2 and S3 are obviously separated, indicating that during fixation, the metabolites have changed significantly. Among these metabolites, 98 and 52 increased and decreased, respectively (Fig. 7b). Lipids represented the most increased metabolites. The number of nucleotides and their derivatives increased by 16, slightly less than that of lipids (19). In addition, there were 15 flavonoids, 10 phenylpropanoids, seven organic acids and derivatives, six amino acid and derivatives, four vitamins and derivatives, three carbohydrates and other metabolites that increased obviously. In addition, 11 flavonoids, nine phenylpropanoids, eight organic acids and derivatives, six lipids, three amino acid and derivatives, two nucleotide and derivatives and other kinds of metabolites decreased. As shown in Supplemental Table 1, oxoadipic acid, trans-citridic acid, C-hexosyl-isorhamnetin O-hexosi, luteolin 3',7-di-O-glucoside, procyanidin A3, apigeninidin chloride, bilobalide, tricin O-feruloylhexoside O-hexoside, C-hexosyl-luteolin O-feruloylpentoside and maslinic acid were the most significantly decreased metabolites.
Thus, fixation is the critical time period for the increase in lipids involved in the flavor quality of tea. Lipid-soluble chlorophylls and carotenoids are the main pigments in tea plants, and they impact the color quality of tea products, especially green tea[31]. During the production of green tea, especially during fixation, significant lipidomic variations were observed, which were mainly related to chlorophyll decomposition, phospholipid acid reduction and glycolipid degradation, which may contribute to the color and aroma qualities of tea[32]. The fixation stage is the key period of chlorophyll decomposition and pheophytin production; therefore, these results are consistent with those of previous studies[31,33].
Changes in the metabolites between S3 and S4
-
Of the 26 differentially expressed metabolites between S3 and S4 (Fig. 7c), ten were up-regulated and 16 were decreased. Except for organic acids, amino acids, flavonoids and phenylpropanoids, the number of metabolites decreased more than increased. Thiamine, luteolin 3',7-di-O-glucoside, C-hexosyl-isorhamnetin O-hexoside, C-hexosyl-luteolin O-feruloylpentoside, cocamidopropyl betaine, pantothenol, 8-hydroxyguanosine, tangeretin, oxalic acid and docosanoic acid decreased significantly, while 4-O-caffeoyl quinic acid, chlorogenic acid methyl ester, 2-(formylamino) benzoic acid, 6-hydroxydaidzein, engeletin, myricitrin, kaempferin, tricin 7-O-hexosyl-O-hexoside, tricin 7-O-β-guaiacylglycerol, 5-methylcytosine, coumestrol, angelicin and γ-Glu-Cys increased obviously.
Changes in the metabolites between S4 and S5
-
Of the 95 differentially expressed metabolites between S4 and S5 (Fig. 7d), 58 were increased and 37 were decreased. During the drying process, the change in flavonoids was the most significant, with 22 increasing and eight decreasing. Among the phenylpropanoids, four increased and 11 decreased. Additionally, there were five increased and one decreased organic acid and their derivatives during this process. Heat treatments may induce the release of natural organic acids, resulting in increased acidity[34]. Therefore, during the drying process, the increase in the organic acids and derivatives may be due to the heat treatment. Additionally, five kinds of lipids showed either significant increases or no significant reductions during this process. Under heat–acid stress, chlorophyll is destroyed and lipid levels increase[32].
Changes in the metabolites between S1 and S5
-
In the comparison of each stage, the metabolites with significant changes between S1 and S5 were the most, regardless of whether they decreased or increased. The expression levels of 210 metabolites were significantly increased and 96 metabolites were clearly decreased. The significantly increased metabolites are mainly concentrated in amino acids and derivatives, flavonoids and lipids, and metabolites such as organic acids and derivatives, nucleotide and derivatives, anthocyanins and phenylpropanoids mainly decreased.
PCA of five different grades of stir-fried green tea
-
Our UPLC–QQQ-MS–based metabolomics analyses showed that the most striking changes in metabolites were observed at the spreading and fixation stages. A total of 898 compounds were extracted from five tea processing stages. During the spreading, fixation, rolling and drying processes, 127, 150, 26 and 95 kinds of metabolites, respectively, were significantly different. Among the 898 compounds detected in this study, notable variations were associated with changes in lipids, organic acids and their derivatives, flavonoids, nucleotides and their derivatives, amino acids and their derivatives, and phenylpropanoids, which potentially contribute to tea color and aroma quality. This study offers an overview of the variations in the tea metabolome during green tea processing. The results form the basis for future investigations that aim to enhance the sensory qualities, nutritional value and pharmaceutical properties of stir-fried green tea.
This research was supported by The National Natural Science Foundation of China (31870680), the China Agriculture Research System of MOF and MARA (CARS-19), the Key Research and Development Program of Jiangsu Province (BE2019379), Jiangsu Agriculture Science and Technology Innovation Fund (CX(20)2004), Innovation and Extension Projects of Forestry Science and Technology in Jiangsu Province (LYKJ-Changzhou[2020]03), Changzhou Science and Technology Support Program (Agriculture CE20202003), and Chuzhou Science and Technology Support Program (2020ZN009).
-
The authors declare that they have no conflict of interest.
- Supplemental Fig. 1 The integral correction results of quantitative analysis of metabolites randomly selected in different samples. (A) Integral correction diagram -N; (B) Integral correction diagram -P. The abscissa is the retention time (min) of metabolite detection, and the ordinate is the ion current intensity (CPS) of a metabolite ion detection, and the peak area represents the relative content of the substance in the sample.
- Supplemental Fig. 2 Detection of TiC overlapping map by QC sample mass spectrometry. (A) QC MS tic overlap -N; (B) QC MS tic overlap -P. QC sample mass spectrometry detection of the total ion flow diagram (TIC diagram) overlay map. The results showed that the peak intensity and retention time were consistent, which indicated that the signal stability was good when the same sample was detected at different time. The high stability of the instrument provides an important guarantee for the repeatability and reliability of the data.
- Supplemental Fig. 3 The model of OPLS-DA. (A) S1 vs S2; (B) S2 vs S3; (C) S3 vs S4; (D) S4 vs S5. In the abscissa, P1 is the predicted principal component, O1 is the orthogonal principal component, and the ordinate is the corresponding R2X, R2Y and Q2. According to the OPLS-DA model to analyze the metabolome data, draw the score map of each group, and further show the difference between each group. The prediction parameters of the evaluation model are R2X, R2Y and Q2, where R2X and R2Y represent the interpretation rate of the built model to the X and Y matrices, and Q2 represents the predictive ability of the model. The closer these three indicators are to 1, the more stable the model Reliable, when Q2 > 0.5 can be considered as an effective model, Q2 > 0.9 is an excellent model.
- Supplemental Table 1 The metabolites of all samples or different stages can be detected.
- Supplemental Table 2 Metabolites with obvious changes of each stage.
- Copyright: © 2023 by the author(s). Published by Maximum Academic Press, Fayetteville, GA. This article is an open access article distributed under Creative Commons Attribution License (CC BY 4.0), visit https://creativecommons.org/licenses/by/4.0/.
Zhang K, Ren T, Liao J, Wang S, Zou Z, et al. 2021. Targeted metabolomics reveals dynamic changes during the manufacturing process of Yuhua tea, a stir-fried green tea. Beverage Plant Research 1: 6 doi: 10.48130/BPR-2021-0006


|