


-
Soil acidity is among the greatest yield-limiting factors affecting crop production[1,2]. Liming is the most widely used strategy for soil acidity amelioration; its success is well documented[3−7]. Although tea is considered acid-tolerant, its growth and quality can be negatively affected by high soil acidity (pH < 4.5)[8]. Therefore, liming is widely practiced to ameliorate soil acidity in tea plantations[9,10].
Tea is a calciphobous plant. Several researchers have reported growth inhibition and a decline in the quality of tea production due to over-liming[11,12]. Ca levels exceeding 2,000 mg kg–1 generally cause Ca toxicity[13]. Previous studies have reported that high soil content of Ca hampers tea root growth and activity, and decreases nutrient and water uptake. Wang et al.[14] reported that excessive Ca fertilization damaged the photosystem membrane, inhibited electron photosynthesis, and decreased light use efficiency in tea leaves, ultimately depressing tea growth rates. Although Ca toxicity due to high Ca uptake in tea plants under controlled conditions has been well established in pot and nutrient solution experiments, data demonstrating these effects in tea plantations are limited.
Liming supplies Ca and Mg to plants and neutralizes phytotoxic levels of soil Al by decreasing the levels of available Al[3,4,15−17]. Nutrient antagonism between Ca and Al increases the rate of Ca uptake, thereby reducing Al uptake[8,18,19]. However, tea is an Al hyper-accumulator; a previous study reported that up to 3,000 mg kg–1 can be taken up by old leaves without toxicity symptoms[20]. In contrast to other plants, tea root growth is generally induced by Al addition, and rates of uptake among nutrients such as P and K are promoted[21,22]. The quality of tea can be improved by appropriate Al supply[23,24]. Nutrient antagonism between Ca and K has been reported in other plants[25,26]. Therefore, it is necessary to further understand the effects of liming on tea growth and the relationship with Al and K uptake in the field.
In this study, we selected a study site with similar agricultural managements such as fertilization, tillage, pruning, weeding and so on. The study site had experienced large variations in tea growth after liming, we therefore hypothesized the varied growth conditions of tea might be caused by the uneven application of lime. We thus divided the plots into two groups according to the growth conditions (Fig. 1). Tea growth, plant nutrient concentrations, soil pH, and levels of available nutrients were compared between the groups. We then analyzed the relationships between tea growth, nutrients, and soil nutrient availability.
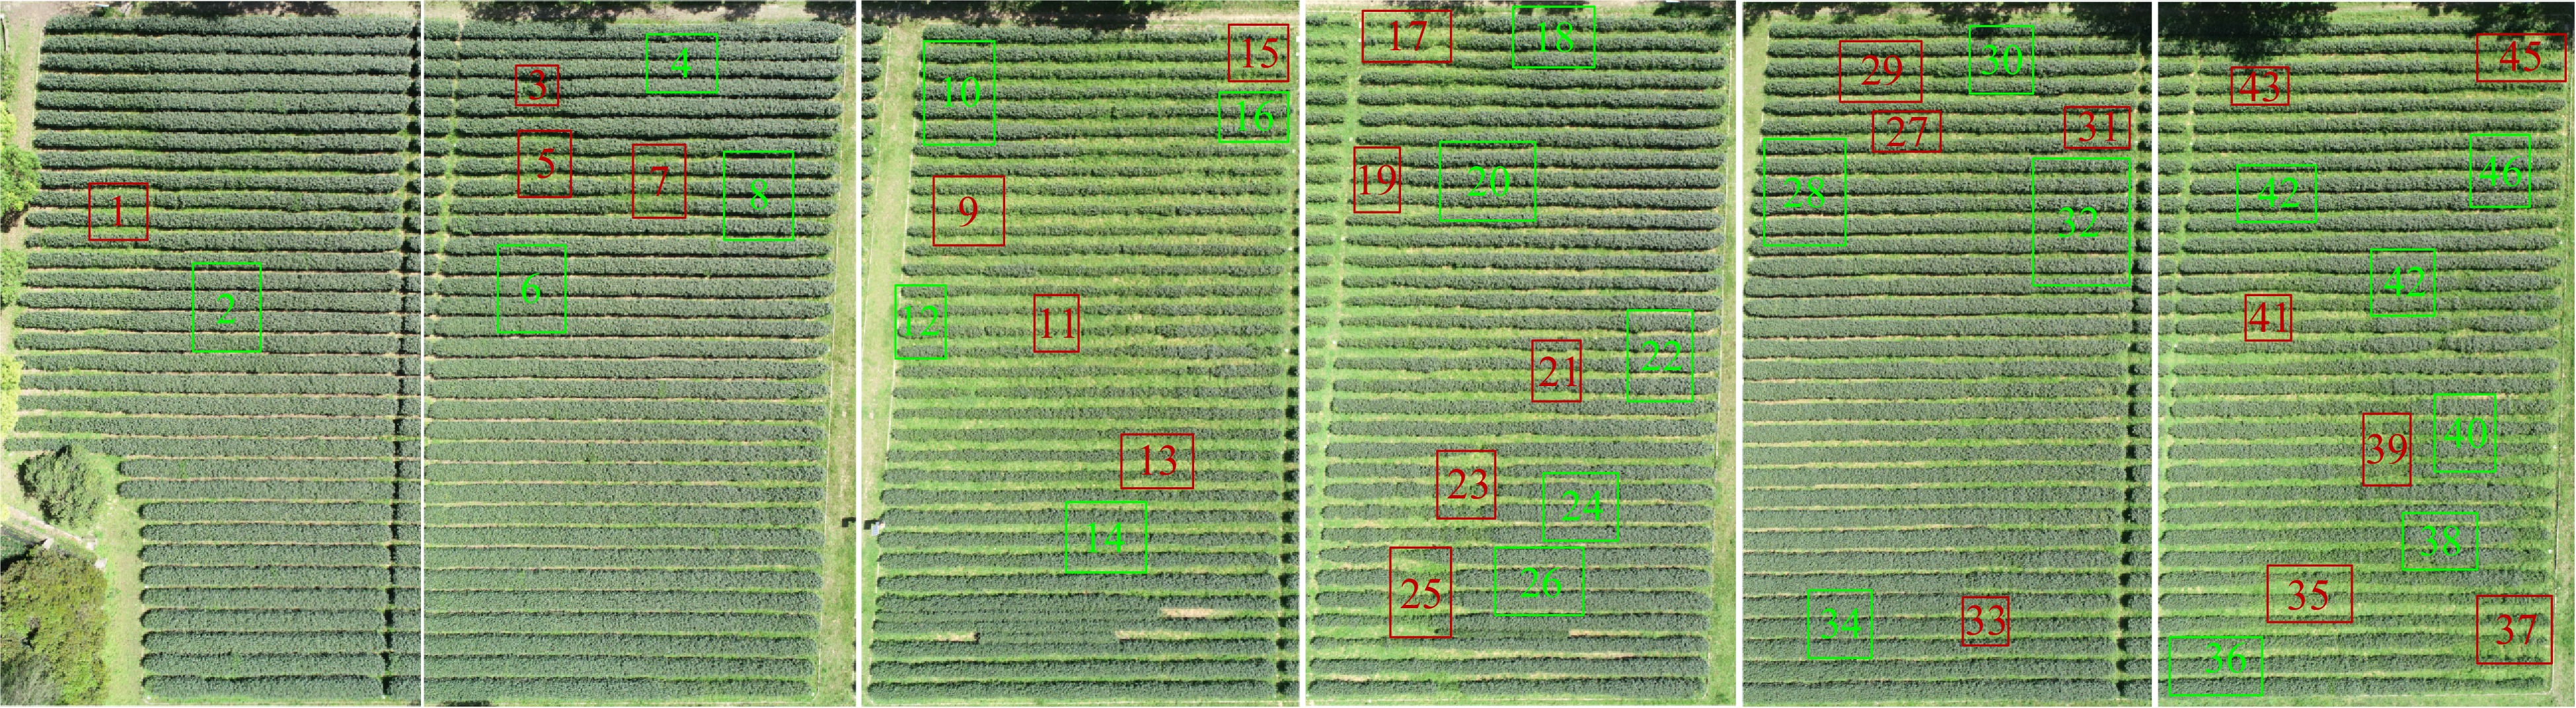
Figure 1. The study area and sampling sites of Plot 1 (red boxes) and 2 (green boxes).
-
The study area (30°10′52.13″ N, 120°05′22.82″ E) covers about 1.2 hm2 in Hangzhou, Zhejiang Province, China (Fig. 1). The site has a monsoon climate, with a mean annual temperature of 17.0 °C and mean annual precipitation of 1,553 mm. The soil is classified as ultisol or alisol, having developed from Quaternary aeolian red deposits.
From 1990 to 2010, the study site was planted with the 'Longjing 43' tea variety. In 2010, 9.6 t hm–2 dolomitic limestone was applied to improve soil pH, and the tea variety was changed to 'Zhongcha 108'. To sustain growth and achieve high tea quality and yield, 4.5 t hm–2 organic fertilizer (rape seed cake containing 45% organic C, 4.6% N, 0.9% P, and 1.2% K) was applied in late September or early October. An additional 250 kg hm–2 N was applied before and after the spring tea harvest, in mid-February and May, respectively. Other agronomic management techniques such as picking, pruning, tillage, weeding, pest and disease control for the study site were similar for all of the teas. The growth condition of the tea in this site however varied greatly between the different plots following the liming carried out in 2010 (Fig. 1).
Tea plantation plot classification
-
Plots with a tea canopy height and width below 1.0 m were designated as having weak growth (Plot 1); those with a canopy height and width exceeding 1.2 m were designated as having vigorous growth (Plot 2). Plant and soil samples were collected from 23 Plot 1 sites. We then selected 23 Plot 2 sites, one near each Plot 1 sampling site, and collected plant and soil samples in these sites (Fig. 1).
Determination of vegetation indices
-
The normalized difference vegetation index (NDVI) is commonly used and is correlated with canopy biophysical properties such as leaf area index, fractional vegetation cover, vegetation condition, and biomass[27]. Transformed vegetation index (TVI) is used to describe radiative energy absorbed by pigments as a function of the difference between red and near infrared (NIR) reflectance and the magnitude of green reflectance, where light absorption by chlorophyll is considered negligible[28]. We used a high-spectral resolution spectrometer (ASD FieldSpec Pro, Analytical Spectral Devices, Boulder, CO, USA) fitted with a 25° field of view fore optic to record canopy spectral reflectance in situ. All canopy spectral measurements were collected at a height of 0.6 m above the tea plant canopy. Spectra were acquired in the 350–2,500 nm spectral range at a spectral resolution of 3 nm between 350 and 1,050 nm and of 10 nm between 1,050 and 2,500 nm. A 40 cm × 40 cm BaSO4 calibration panel was used to calculate reflectance. All irradiance measurements were recorded as an average of 20 scans at an optimized integration time. Prior to subsequent preprocessing, all spectral curves were resampled at 1 nm intervals. All measurements were conducted under clear sky conditions between 10:00 and 14:00, Beijing local time. NDVI and TVI were calculated using canopy reflectance values as follows:
$ {\rm{NDVI = }}\;\left( {{{\rm{R}}_{{\rm{800}}}}\;{\rm{- }}\;{{\rm{R}}_{{\rm{670}}}}} \right){\rm{/ }}\left( {{{\rm{R}}_{{\rm{800}}}}\;{\rm{ + }}\;{{\rm{R}}_{{\rm{670}}}}} \right) \quad\quad\quad\quad\quad\quad\quad\quad\;$ (1) $ {\rm{TVI = 0}}{\rm{.5 \; \times\; }}\left[ {{\rm{120 \;\times\; }}\left( {{{\rm{R}}_{{\rm{750}}}}\;{\rm{ - }}\;{{\rm{R}}_{{\rm{550}}}}} \right)} \right]{\rm{\; -\; 200 \;\times \; }}\left( {{{\rm{R}}_{{\rm{670}}}}\;{\rm{ - }}\;{{\rm{R}}_{{\rm{550}}}}} \right) $ (2) Yield, growth conditions, and plant nutrition measurements
-
Samples from three parts of the tea plant were collected on March 29, 2017. One bud and two leaves were picked manually within a 0.1 m2 area (33 cm × 33 cm), and all buds were counted in each site within this area. We picked 50 mature leaves at the lignification point of each branch, and 50 old leaves at a plant height of around 30 cm. All plant samples were dried at 70 °C in a forced-draft oven to constant weight and the weight was recorded. Subsamples were passed through a 1 mm screen; one subsample was mineralized with H2SO4-H2O2, after which N levels were measured using the Kjeldahl method. The remaining subsample was mineralized using HNO3-H2O2 in a microwave accelerated reaction system (CEM, Matthews, USA). Then levels of P, K, Ca, and Al were determined using inductively coupled plasma atomic emission spectroscopy (ICP–AES, Perkin Elmer, USA).
Soil sampling, preparation, and analyses
-
During plant sampling, a minimum of five soil samples (20 cm increments from 0 to 40 cm) were simultaneously collected from each site. Samples from each site were homogenized to form a composite sample. Plant residues, roots, and stones were removed, and soil samples were passed through a 5 mm sieve. Samples were extracted with 0.1 mol L–1 KCl2, and continuous flow analyses (TRAACS 2000; Bran + Luebbe, Germany) were used to assess
${\text {NO}_3^{-}}\text {-N} $ and${\text {NH}_4^{+} {\text -}\text N} $ content. The remaining soil samples were air-dried and passed through a 1 mm sieve. Soil pH was measured using a pH meter (ORION 3 STAR, Thermo Ltd., USA) in a 1:1 (w:v) soil–deionized water mixture. Soil organic carbon (SOC) was measured using a C/N elemental analyzer (Vario Max, Elementar, Germany). Available P, K, and Al were extracted using the Mehlich 3 method, and levels were measured using ICP–AES.Data analyses
-
One-way analysis of variance (ANOVA) and Duncan’s test were used to compare tea growth parameters, plant nutrient content, and soil chemical properties between Plots 1 and 2, at a significance level of p < 0.05. General linear models were used to evaluate differences in the responses of tea growth to leaf and soil nutrient levels between groups.
-
In Plot 2, NDVI was 0.862, 4.1% higher than that of Plot 1 (Table 1). TVI was 23.58 in Plot 1, 24.8% higher than that in Plot 2. In Plot 1, yield, number of buds per m2, and 100-bud weight were 46.9 g m–2, 1,712, and 2.76 g, respectively; in Plot 2, these parameters were 45.2%, 23.7%, and 17.0% higher, respectively.
Table 1. The NDVI, TVI, yield, number of buds per m2 and weight of buds per hundred of Plots 1 and 2 (mean ± standard error).
NDVI TVI Yield(g m−2) Number of buds per m2 Weight of buds per hundred (g) Plot 1 0.828 ± 0.02 b 23.58 ± 2.69 a 46.9 ± 4.6 b 1,712 ± 197 b 2.76 ± 0.26 b Plot 2 0.862 ± 0.01 a 18.89 ± 1.54 b 68.1 ± 6.8 a 2,118 ± 184 a 3.23 ± 0.36 a Significance among treatments was tested using one-way ANOVA at p < 0.05. Different letters in a single row indicate a significant difference between treatments. NDVI, Normalized Difference Vegetation Index; TVI, Transformed Vegetation Index. Plant nutrition in Plots 1 and 2
-
No significant differences in nutrient levels between Plots 1 and 2 were observed in samples containing one bud and two leaves (Table 2). In new and old leaves, N, K, and Al levels were significantly lower in Plot 1 than in Plot 2, whereas leaf levels of Ca were 10.26 and 12.98 g kg–1 in Plot 1, respectively, representing increases of 27.9% and 27.4% compared to Plot 2. No significant differences in P levels were observed between Plots 1 and 2.
Table 2. The N, P, K, Ca and Al concentration of bud, new and old leaves of Plots 1 and 2 (mean ± standard error).
N (g kg−1) P (g kg−1) K (g kg−1) Ca (g kg−1) Al (g kg−1) Bud with two leaves Plot 1 38.0 ± 3.4 a 5.8 ± 0.6 a 17.2 ± 1.8 a 2.14 ± 0.35 a 0.17 ± 0.05 a Plot 2 40.7 ± 3.6 a 5.4 ± 0.3 a 18.0 ± 0.6 a 2.08 ± 0.31 a 0.16 ± 0.04 a New leaves Plot 1 20.0 ± 1.1 b 2.0 ± 0.2 a 8.5 ± 1.1 b 10.26 ± 1.97 a 1.84 ± 0.39 b Plot 2 22.5 ± 1.4 a 1.9 ± 0.1 a 10.3 ± 0.8 a 8.02 ± 1.53 b 2.50 ± 0.40 a Old leaves Plot 1 16.9 ± 1.3 b 2.0 ± 0.3 a 7.0 ± 0.8 b 12.98 ± 1.94 a 3.76 ± 0.85 b Plot 2 19.6 ± 1.5 a 2.3 ± 0.5 a 9.3 ± 1.2 a 10.19 ± 1.38 b 4.82 ± 0.40 a Significance among treatments was tested using one-way ANOVA at p < 0.05. Different letters in a single row indicate a significant difference between treatments. The relationships between nutrient content (N, P, K, Ca, and Al) in mature and old leaves and NDVI, TVI, and yield are shown in Fig. 2. NDVI and yield were significantly positively correlated with leaf levels of N, K, and Al, and negatively correlated with leaf levels of Ca. TVI was significantly negatively correlated with leaf levels of N, K, and Al, and a negative relationship was detected between TVI and leaf levels of Ca. No relationship was detected between leaf levels of P and NDVI, TVI, or yield.

Figure 2. The changes in and relationships of NDVI (a–e), TVI (f–j) and yield (k–o) with new and old leaf nutrient (N, P, K, Ca, Al) concentrations. Different lowercase letters ns, *, ** and *** indicate no significant difference, significant differences at the p < 0.05, 0.01 and 0.001 level, respectively.
Soil chemical properties in Plots 1 and 2
-
In Plot 1, average soil pH values at soil depths of 0–20 and 20–40 cm were 6.30 and 5.84, respectively, 26.3% and 22.9% higher than in Plot 2 (Table 3). No significant differences in soil SOC,
${\text {NO}}_3^{-} $ ,$ {\text {NH}}_4^{+} $ , P, or K levels were observed between Plots 1 and 2 in either soil depth category. In Plot 1, Ca levels were 1,444 and 2,039 mg kg–1 at these soil depths, 66.2% and 90.6% higher than those in Plot 2. Al levels in Plot 1 were 8.8% and 11.4% lower than those in Plot 2 (911 and 862 mg kg–1).Table 3. Soil chemical properties of Plots 1 and 2 in the 0−20 and 20−40 cm soil depth (mean ± standard error).
pH SOC
(%)${{\text{NO}}_3^- \text {-N}}$
(mg kg−1)${{\text{NH}}_4^+ \text {-N}}$
(mg kg−1)AP
(mg kg−1)AK
(mg kg−1)Ca
(mg kg−1)Al
(mg kg−1)0−20 cm Plot 1 6.30 ± 0.50 a 1.82 ± 0.35 a 16.0 ± 11.6 a 2.53 ± 1.96 a 106 ± 41 a 198 ± 45 a 1444 ± 293 a 831 ± 53 b Plot 2 4.99 ± 0.52 b 1.96 ± 0.28 a 15.2 ± 7.3 a 3.43 ± 2.18 a 103 ± 70 a 202 ± 37 a 869 ± 270 b 911 ± 67 a 20−40 cm Plot 1 5.84 ± 0.47 a 1.17 ± 0.34 a 11.7 ± 6.0 a 1.44 ± 0.77 a 215 ± 174 a 168 ± 40 a 2039 ± 709 a 766 ± 52 b Plot 2 4.75 ± 0.35 b 1.33 ± 0.21 a 11.8 ± 6.1 a 1.98 ± 1.31 a 135 ± 111 a 163 ± 48 a 1070 ± 532 b 862 ± 97 a Significance among treatments was tested using one-way ANOVA at p < 0.05. Different letters in a single row indicate a significant difference between treatments. SOC, soil organic carbon; ${{\text{NO}}_3^- \text {-N}}$ , nitrate;${{\text{NH}}_4^+ \text {-N}}$ , ammonium; AP, available Phosphorus; AK, available potassium.The relationships between parameters are shown in Fig. 3. NDVI and yield were significantly negatively correlated with soil pH and Ca levels, and positively correlated with soil Al in both soil depth categories. TVI was significantly positively correlated with soil pH and Ca levels, and positively correlated with soil Al at both depths.

Figure 3. The changes in and relationship of NDVI (a−c), TVI (d−f) and yield (g−i) with soil pH, Ca and Al concentration in the 0−20 and 20−40 cm soil depths. Different lowercase letters ** and *** indicate significant differences at the p < 0.01 and 0.001 level, respectively.
-
Liming has traditionally been the most common strategy applied to address the impact of soil acidification[29]. However, an integrated approach considering appropriate liming rates, cultural practices, and plant tolerance is necessary[22,30]. In this study, tea plant growth was inhibited by over-liming in some sites within a single tea plantation (Fig. 1). The effects of over-liming were mainly demonstrated by higher TVI and lower NDVI, yield, bud numbers, and 100-bud weight (Table 1). Normally, plant growth is determined by the interception of photosynthetically active radiation (PAR), which is used for carbon fixation. In this study, lower NDVI and higher TVI in Plot 1 indicated the reduced ability of tea plants to capture and use PAR. NDVI and TVI were significantly correlated with levels of N, K, Ca, and Al in tea leaves (Fig. 2).
The acquisition of adequate amounts of essential minerals is essential for maximum photosynthetic activity and plant growth[19,31]. Although Ca is required for tea growth, high levels can cause toxicity[32]. Ca levels normally differ between parts of the tea plant, with those in buds and old leaves being about 2.0 and 8.0 g kg–1, respectively[33]. In this study, the average Ca level in buds was about 2.0 g kg–1 for both Plots 1 and 2, whereas mature and old leaves had levels of 10.26 and 12.98 g kg–1 in Plot 1 (Table 1). Excessive leaf levels of Ca can destroy the membrane structure of the photosynthetic system, resulting in obstruction of the electron transport chain and reducing the light energy utilization efficiency of tea leaves, thereby affecting tea growth[14].
In this study, K uptake in tea plants was strongly inhibited at higher soil levels of Ca. We also observed a significant negative relationship between K levels in leaves, and leaf and soil levels of Ca (Fig. 4). This is consistent with previous reports of reduced K content due to liming in barley, wheat, and soybean[34−36]. Hamilton et al.[37] reported that liming improved herbage mineral composition (i.e., increased Ca and Mg and decreased K). Liming can increase K adsorption in soil[3]. Bailey and Laidlaw[38] reported a significant interaction between lime and K, such that high-level lime treatment reduces plant growth due to K deficiency. K availability is associated with pH and K release from clay interlayer spaces[38,39]. However, in our study, soil levels of available K did not decrease following liming (Table 3). Some studies have indicated that Ca toxicity reduces root growth and nutrient uptake[13]. Under high Ca conditions, antagonism between Ca and K has been shown to reduce K uptake [26,40]. Therefore, lower leaf levels of K may be related to reduced K uptake ability in roots.

Figure 4. The changes in and relationships of leaf K concentration with leaf Ca (a) and Al concentration (d), and soil Ca (b, c) and Al (e, f) availability in the 0−20 and 20−40 cm soil depths. Different lowercase letters ** and *** indicate significant differences at the p < 0.01 and 0.001 level, respectively.
In this study, Al levels in both mature and old leaves were significantly higher in Plot 2 than in Plot 1 (Table 2). Although Al is not a necessary nutrient for most plants, tea is known as an Al hyper-accumulator; it can accumulate as much as 3,000 mg kg–1 in old leaves without exhibiting toxic symptoms[20]. Indeed, tea plant growth is promoted by adequate Al supply[22]. For example, tea plant root elongation is promoted by Al addition[41], and K uptake is improved by Al application[22]; our finding that leaf levels of K were significantly positively correlated with leaf and soil levels of Al are consistent with these reports (Fig. 4).
We observed lower leaf levels of Al in Plot 1 than in Plot 2 (Table 2), and the levels were significantly negatively correlated with soil pH and Ca content (Fig. 5). These findings are consistent with a previous study that found that wheat shoot levels of Al were decreased by liming[42]. Liming improves soil pH, which enhances the adsorption of several heavy metals including Al, Mn, and Pb, ultimately reducing Al availability[3]. Furthermore, antagonism between Ca and Al, and the high rate of Ca uptake, inhibit Al uptake[19,31].
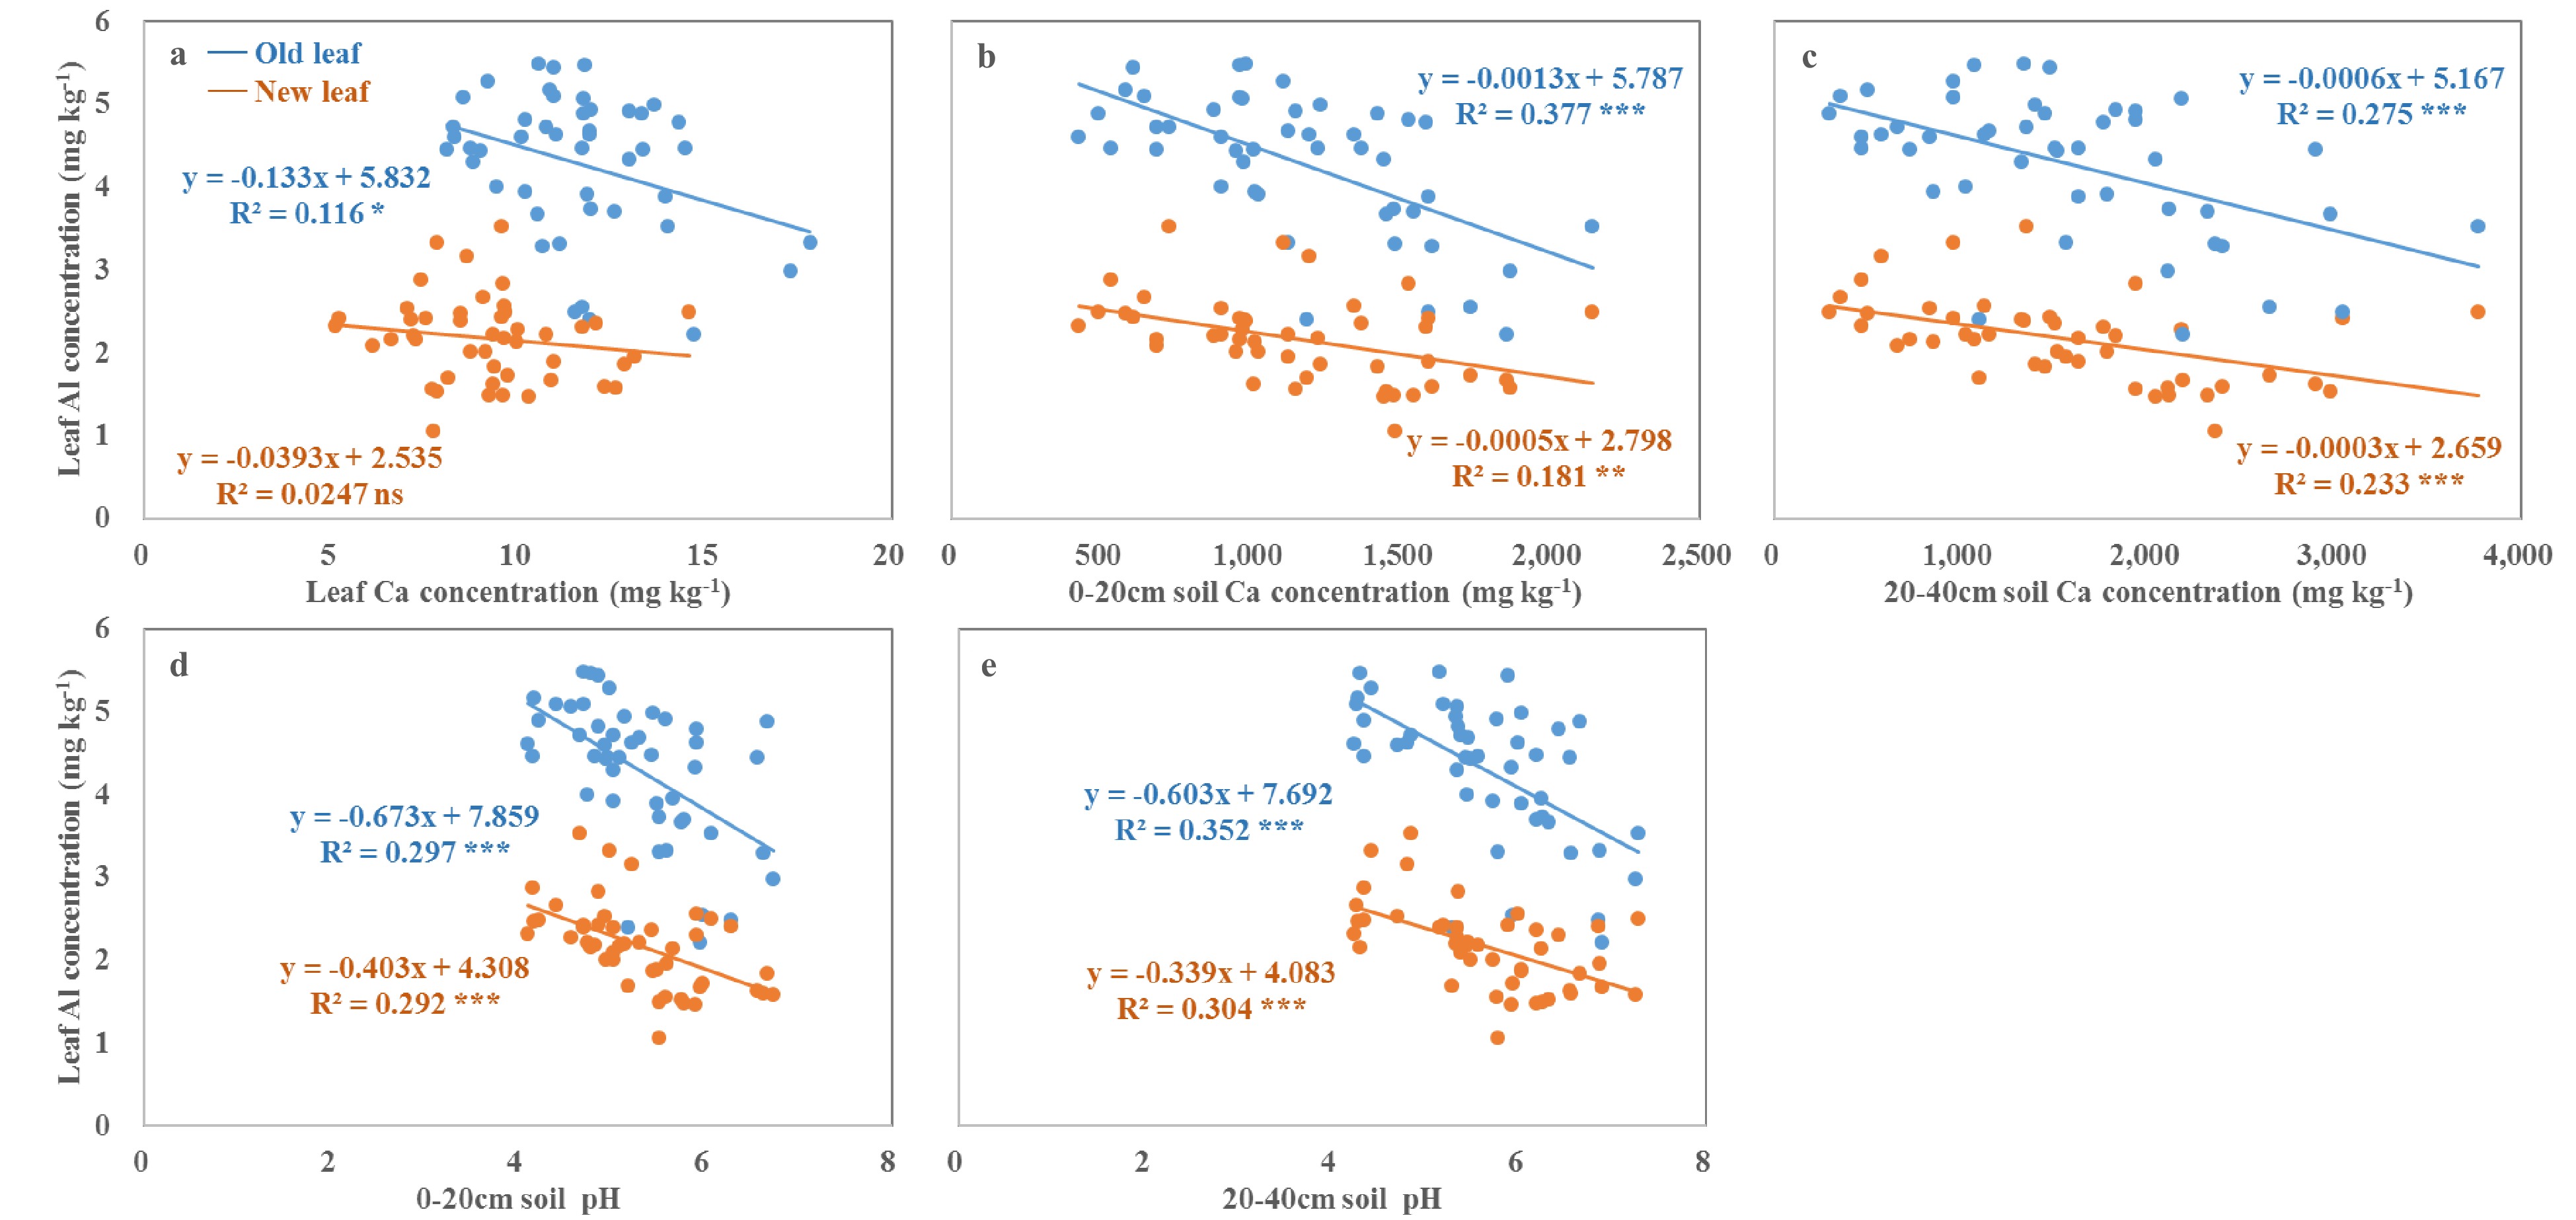
Figure 5. The changes in and relationships of leaf Al concentration with leaf Ca (a) concentration, and soil Ca availability (b, c) and pH (d, e) in the 0−20 and 20−40 cm soil depths. Different lowercase letters ns, *, ** and *** indicate no significant difference, significant differences at the p < 0.05, 0.01 and 0.001 level, respectively.
-
Liming is the most widely used long-term strategy for soil acidity amelioration in tea plantations. However, tea is a calciphobous plant; over-liming can inhibit tea growth due to Ca toxicity. In this study, we observed severe growth inhibition due to over-liming in a tea plantation. Our results indicate that over-liming dramatically increases soil pH and Ca levels, and decreases soil levels of Al. High soil and leaf levels of Ca then inhibit K and Al uptake, negatively affecting the growth of tea plants. Therefore, soil pH and Ca content could be used as the main indicators to determine whether or not soil is suitable for tea planting. For soil with high pH and Ca content, further research is needed to explore whether the growth of tea plants could be improved by improving the K and Al nutritional status.
- This work was financially supported by the National Key R and D Program of China (2020YFD1000701), the Science and Technology Innovation Project of the Chinese Academy of Agricultural Sciences (CAAS-ASTIP-2014-TRICAAS), the Funds for Science and Technology Innovation Project from the Chinese Academy of Agricultural Sciences (CAAS-XTCX2016015).
- The authors declare that they have no conflict of interest.
- Copyright: © 2021 by the author(s). Exclusive Licensee Maximum Academic Press, Fayetteville, GA. This article is an open access article distributed under Creative Commons Attribution License (CC BY 4.0), visit https://creativecommons.org/licenses/by/4.0/.
-
About this article
Cite this article
Yan P, Zou Z, Zhang J, Yuan L, Shen C, et al. 2021. Crop growth inhibited by over-liming in tea plantations. Beverage Plant Research 1: 9 doi: 10.48130/BPR-2021-0009

Crop growth inhibited by over-liming in tea plantations
- Received Date: 15 July 2021
- Accepted Date: 27 August 2021
- Published Online: 15 September 2021
Abstract: Liming is a common strategy applied to attain optimal pH for tea growth in severely acidic soils. Tea however is a calciphobous plant, and the effects of liming on its growth and nutrient uptake remain poorly understand. Therefore, it is necessary to better understand the effects of liming on soil chemical properties and tea nutrient content. In this study, a tea plantation that had exhibited large variation in growth after liming was selected as a study site. We categorized plots into two growth condition groups: Plot 1 (poor growth) and Plot 2 (excellent growth). Tea nutrient levels, and soil chemical properties were then compared between the two groups. Normalized difference vegetation index (NDVI) and transformed vegetation index (TVI) values were significantly higher and lower, respectively, in Plot 2 than in Plot 1. Yield, number of buds per m2, and 100-bud weight were significantly higher in Plot 2. These results were attributed to higher N, K, and Al concentrations and lower Ca concentrations in leaves, and lower pH and available Ca and higher available Al in soil. Leaf concentrations of K and Al were significantly negatively correlated with leaf concentrations of Ca and soil pH. A positive relationship was observed between leaf concentrations of K and Al, indicating inhibited K and Al uptake due to over-liming, restricting tea growth. In conclusion, our results show that tea growth will be restricted by over-liming, as a result of the high soil pH and Ca concentration inhibiting the K and Al uptake.
-
Key words:
- liming /
- plant nutrients /
- soil pH /
- soil nutrient availability /
- tea