


-
Microorganisms are important components of biogeochemical cycling and ecosystem functioning[1,2]. Understanding and predicting the spatial distribution patterns of microbial communities are crucial for anticipating ecosystem responses to global climate changes[3]. Microorganisms are not uniformly distributed in the environment. Rather, their abundances, activities, and trophic compositions vary along environmental gradients[4,5], driven by the interactions of both biotic (e.g., soil organisms, plant, etc.) and abiotic (e.g., rainfall, temperature, evaporation, etc.) factors[6].
In the past, studies on soil microbial diversity focused on a single microbial domain. However, fundamental differences in bacterial and fungal physiology and ecology suggest that the pattern of each group is controlled by separate edaphic factors[7]. Moreover, bacteria have fast growth rates, large surface area/volume ratios, and short life spans that potentially assist them to compete with fungi in absorbing free carbon and nutrient substrates from the environment. Consequently, abiotic factors significantly affect bacterial diversity by controlling substrate availability. Different from bacteria, fungi mainly acquire substrates by forming symbiotic associations with plants or decomposing litters through extracellular enzyme secretion[8]. In addition, a few saprophytic fungi may endure substrate heterogeneity by transporting extracted substrates in long distances using long mycelium[9]. Therefore, fungi may be sensitive to biotic factor changes, especially in plants acting as their host and substrate resources. Bacteria and fungi have distinct functional roles in soil, and a more robust understanding of the special effects of the edaphic factors on these two microbial groups is necessary.
Early studies have investigated the distribution patterns of bacterial and fungal communities with different spatial scales and correlated these variations to abiotic and biotic factors[5]. For biotic factors, the above-ground plants have significant and long-lasting effects on soil microorganisms that largely arise from changes in root exudates, biomass accumulation and harvest, litter inputs, and physical cover protection[10,11]. Therefore, soil microorganisms may respond to changes in plant species composition and diversity across vegetation gradients[12]. In addition, numerous studies have suggested variations of soil microorganisms along vertical spatial gradients in soils[13−15]. The abiotic factors affecting such vertical patterns include soil pH, particle size, soil organic matter, nutrient availability, water content, and oxygen concentration[16]. However, these studies did not differentiate the relative roles of abiotic and biotic factors on bacteria and fungi.
A dry–hot valley environment provides the unique opportunity to assess factors underlying microbial spatial patterns because strong environmental gradients occur across the landscape parallel to those in the soil column[17]. In this area, most of the surface area is relatively well vegetated, which is characterized as savanna-like vegetation presented as a transition from grassland to shrubland within a small region[18]. In addition, environmental conditions are generally unfavorable in this area, with frequent cold–hot and wet–dry cycles, low and transient precipitation, reduced humidity, and rapid drainage[19]. The soil vertical spatial heterogeneity is remarkably significant in this area because of low water transportation[20]. Under such conditions, the effects of biotic (vegetation) and abiotic (soil characteristics) factors can be potentially separated by investigating the microbial communities across vegetation gradients between soil horizons.
In the current study, we investigated the bacterial and fungal communities in vegetated soils from the Yuanjiang dry–hot valley area in South Yunnan, China. We used a sequence-based approach to quantify the phylogenetic differences in the structures and diversities of bacterial and fungal communities under two distinct dominant vegetation types (grassland and shrubland) in this area. In addition, DNA fingerprint profiles were used to investigate the differences of the bacterial and fungal distribution patterns across a vegetation gradient (including shrubland, grassland, and an ecotone zone between these two patterns). Both bacterial and fungal communities in soil humus and mineral horizons were examined. We formulated a question: Do fungi and bacteria respond differently to changes in vegetation types versus soil horizons? We predicted that (1) changes in vegetation lead to larger variations in the fungal community than in bacterial community; and furthermore, (2) soil horizon changes lead to larger variations in the bacterial community than in fungal community.
-
This study was conducted in a valley (23° 410' N, 101° 590' E, 770 m asl) of the Yuanjiang River, 10 km north of Yuanjiang City, Yunnan, Southwestern China. The soil is a ferric Cambisol with the following surface (0–20 cm) soil chemical properties: pH, 6.1; organic matter, 1.06%; total nitrogen (N), 0.10%; total phosphorus (P), 0.04%; and total potassium of 2.56%. Soils in all sites are highly weathered with low available nutrients. The Yuanjiang site is extremely hot and dry. The mean annual temperature is 23.8 °C and the mean annual rainfall is 802 mm, wherein 79% falls between May and October. Rainfall in the driest month reaches 23 mm[21].
The shrubland is dominated by secondary deciduous woody species including Buchanania latifolia Roxb., Lannea coromandelica (Houtt.) Merr., Symplocos racemosa Roxb., Phyllanthus emblica L., Polyalthia cerasoides (Roxb.) Benth. et Hook. f. ex Bedd., Terminthia paniculata (Wall. ex G. Don) C. Y. Wu et T. L. Ming, Wendlandia tinctoria subsp. Intermedia (F. C. How) W. C. Chen, and Woodfordia fruticosa (L.) Kurz. The grass communities are dominated by Bothriochloa pertusa (L.) A. Camus and Heteropogon contortus (L.) P. Beauv. ex Roem. Et Schult. The shrub–grass ecotone between the shrubland and grassland is a mixture of both shrub and grass species[21].
Yi et al.[22] previously described the soil sampling protocol, outlined briefly as follows: in March 2008, three 2 × 2 m plots (A, B, and C), approximately 5 m apart, were established at each of the following sites: shrubland (S), grassland (G), and ecotone between the two vegetation types (E). In each plot, we collected samples from (i) humus horizon using a wooden frame (20 × 20 cm) (H) and (ii) mineral horizon soil (M) using a core sampler (diameter: 5 cm, depth: 10 cm). Three cores were pooled into one sample within each plot. Soil samples were sieved on site through 4-mm mesh, transported to the laboratory on ice, and stored in a freezer at −80 °C before nucleic acid analysis. DNA extractions were performed on 0.5 g soil samples using the Ultra Clean™ Soil DNA kit (Mo Bio Labs, Solana Beach, CA, USA), following the protocol of the manufacturer. Purified DNA was detected via agarose gel electrophoresis. The purity and usefulness of the DNA samples were ultimately determined by polymerase chain reaction (PCR) amplifications.
Amplification, cloning, and sequencing of partial 16S rRNA genes
-
DNA extracted from humus and mineral soils of the grassland and shrubland were used to construct bacterial clone libraries to assess the compositions of the bacterial communities under distinct vegetation types. Bacterial 16S rRNA genes were amplified using universal primers: 8F (5'-AGAGTTTGATCCTGGCTCAG-3') and 1492R (5'-GGWTACCTTGTTACGACTT-3')[23]. The PCR reaction mixture (50 μL) contained 5 ng template DNA, 5 μL of 10 × PCR buffer (100 mol Tris-HCl, 500 mol KCl, and 15 mol MgCl2), 5 μL of deoxyribonucleotide triphosphate mixture (2.5 mol of each dNTP), 1 μM of each primer, and 1 U of TaKaRa ExTaq (Takara Bio, Otsu, Japan). After 5 min of denaturation at 94 °C, 30 thermal cycles of 30 s were performed at 94 °C, 45 s at 55 °C, and 2 min at 72 °C, followed by an extension step at 72 °C for 10 min. The products were analyzed on a 1% agarose gel and purified using a DNA agarose gel extraction kit after PCR (Sangon, Shanghai, China). The purified bacterial were cloned using the pMD19-T Vector Kit for Sequencing (Takara Bio, Otsu, Japan). Clones were screened with the blunt-white plate and amplified with PCR using vector primers M13 (Sangon, Shanghai, China). Sequencing was performed on an ABI 3130xl in Shanghai Sangon Biological Engineering Technology and Services Co., Ltd., where cultures were regrown, plasmids were isolated, and the 16S rRNA genes were partially sequenced using the 907r primers. Sequence chromatogram files were viewed for quality using Sequence Scanner v1 (Applied Biosystems, Inc.) and manually edited. Among them, 170 sequenced clones were used for further analysis. The sizes of the clone libraries for the 16S rRNA genes were as follows: shrubland humus (SH) = 43 clones, shrubland minerals (SM) = 45 clones, grassland humus (GH) = 41 clones, and grassland minerals (GM) = 41 clones.
All bacterial sequences were checked for artificial chimeras using Greengenes[24]. Sequences with poor quality or suspected to be chimeras were eliminated from the analysis (less than 9% of the sequences). Sequences with < 90% similarity to the in-house database or presumed as chimeras were discarded. Sequence alignments were carried out using the cluster W program developed in the European Molecular Biology Laboratory. The edited sequences were submitted to the GenBank with access numbers HM559720 to HM559845.
Sequences were trimmed to a common 450-bp fragment and aligned using CLUSTALX. Each sequence was then assigned a putative taxonomy based on its most closely related sequence. Confidence levels of the bacterial phylum identities were estimated using a classification at Ribosomal Data Project (RDP, http://rdp.cme.msu.edu). This program calculated the percentage similarity of the query sequence with its closest type-species sequence in the RDP database. Taxonomic assignments were then made based on this percentage similarity. The similarity cutoff values were 75%, 85%, 91%, 92%, 95%, and 100% for phylum, class, order, family, genus, and species designations, respectively. Close relatives and phylogenetic affiliations of the sequences were checked using the BLAST search program at the GenBank database of the National Center for Biotechnology Information. The sequences assigned to Acidobacteria were further clustered into groups according to the classification by Hugenholtz and Huber[25]. Sequence alignments were used to calculate distance matrices using the Jukes–Cantor algorithm in the program DNADIST from the Phylip package. The number of operational taxonomic units (OTUs) was determined at an evolutionary distance of 0.03, using the average neighbor algorithm in DOTUR.
Partial 16S rRNA gene DGGE analysis
-
Humus and mineral samples from the shrubland, grassland, and shrub–grass ecotone were used for the DGGE analysis to assess the effects of vegetation types and soil horizons.
Bacterial partial 16S rRNA genes were amplified using the primers of 341f-GC (5'-GGGCCTACGGGAGGCAGCAGCGCCCGGGCGCGCCCCGGGCGGGGCGGG-3') and 907R (5'- CCGTCAATTCMTTTGAGTTT-3')[26]. The reaction mixture (50 μL) consisted of 5 ng template DNA, 5 μL of 10 × PCR buffer (100 mol Tris-HCl, 500 mol KCl, and 15 mol MgCl2), 5 μL of deoxyribonucleotide triphosphate mixture (2.5 mol of each dNTP), 1 μM of each primer, and 1 U of TaKaRa ExTaq (Takara Bio, Otsu, Japan). After 5 min of denaturation at 94 °C, 30 thermal cycles of 30 s were performed at 94 °C, 45 s at 55 °C, and 1 min at 72 °C, followed by an extension step at 72 °C for 10 min. The products of both PCR rounds were checked and quantified by agarose gel electrophoresis.
The 16S rRNA DGGE analysis was performed using a universal mutation detection system (Dcode Bio-Rad, Richmond, CA, USA), with a 6% acrylamide gel containing a gradient of 40%−70% denaturant (100% denaturant contains 7 mol urea and 40% formamide). We applied 100 ng of PCR samples to the DGGE gel, and then DGGE was performed in 1 × TAE Buffer (40 mol Tris/acetate, pH 8; 1 mol ethylene diamine tetra-acetic acid) at 60 °C at a constant voltage of 150 V for 8 h. The DGGE gels were recorded as digital images after SYBR Green 1 staining, and the DNA band numbers were then analyzed using image-processing software after subtracting the background noise. The DGGE gels were recorded as digital images after staining with SYBR Green 1. The Rolling disk method with Quantity One (Bio-Rad laboratories Inc.), which normalizes the band patterns of electrophoresis, was used for the identification of each band. The bands were then converted into binary data based on the presence or absence of each band.
Statistical analysis
-
A fungal data set previously generated from the same soil samples[22]. Fungal 18S rRNA genes were amplified with NS1 (5'- GTAGTCATATGCTTGTCTC-3') and FR1 (5'- CTCTCAATCTGTCAATCCTTATT-3')[27]. The sizes of the clone libraries for the 18S rRNA genes were as follows: SH = 33 clones, SM = 30 clones, GH = 33 clones, and GM = 33 clones. For DGGE, fungal 18S rRNA genes were amplified with FR1-GC (5'-CCGAICCATTCAATCGGTAITCGCCCGGGGCGCGCCCCGGGCGGGGCGGG-3') and FF390 (5'-CGATAACGAACGAGACCT-3')[28]. These datasets were used here to compare community structure between these two groups of soil microbes.
For clone analysis, diversity measurements were used to compare the fungal and bacterial clone libraries, independent of their phylogenetic composition. The Shannon diversity index (H) and Simpson index (D) were used as measures of general diversity, including richness and evenness. Chao1 index estimator was calculated as an alternative to H. Moreover, H, D, Chao1 and rarefaction curve were calculated by DOTUR. UniFrac[29] was used to test the statistical differences between soil horizons and vegetation types. Phylogenetic trees were constructed for both the 16S and 18S rRNA gene sequences using the neighbor-joining method implemented in Mega 5.0. Difference between the soil horizon and vegetation type was determined using the UniFrac statistics, and principal component analysis was then conducted.
For DGGE analysis, a dendrogram was constructed based on these binary data with the unweighted pair group method with mathematical averages (UPGMA) and similarity coefficient of Pearson using the Multi Variate Statistical Package version 3.2 (Kovach Computing Services). DGGE fingerprints were further interpreted in terms of phylotype richness (number of the predominant DGGE bands/population), and then analyzed by ANOVA (Least significant difference; p < 0.05) and t-test for differences among the sampling sites. The effects of the experimental factors, i.e., vegetation and soil horizon, on the variation of soil bacterial and fungal community structures were determined by applying the redundancy analysis (RDA) with a constrained direct linear model using the functions 'RDA' and 'ANOVA' of the 'vegan' package implemented in the software R. Permutation tests were performed on all canonical axes with 1000 permutations[30].
-
Bacterial diversity was similar between shrubland and grassland soils but varied between humus and mineral horizons (Table 1). Humus horizons have higher 16S rRNA gene diversity, which was also reflected in the steeper rarefaction curves for the humus soil (Supplemental Fig. S1a). The rarefaction curves of fungi was more gradual than that of the bacteria (Supplemental Fig. S1b), suggesting lower fungal diversity than those of bacteria. Similarly, fungal diversity was similar between the soils of shrubland and grassland, but different between humus and mineral horizons. By contrast, fungal diversity was greater in mineral than humus soils.
Table 1. Diversity indices for the bacterial and fungal communities as represented in the 16S and 18S rRNA gene librariesa.
Shrub Grass SH SM GH GM Bacteria Sb 37.00 35.00 39.00 29.00 Nc 43.00 45.00 41.00 41.00 Evennessd 2.28 2.25 2.29 2.23 Shannon indexe 3.57 3.47 3.65 3.26 Chao1 103.43 78.88 261.00 52.75 Chao1 (95%H)f 210.42 152.27 678.14 99.61 Chao1 (95%L)g 62.45 51.42 116.11 36.99 Fungi Sb 17.00 19.00 15.00 19.00 Nc 33.00 30.00 33.00 33.00 Evennessd 2.10 2.17 1.90 2.18 Shannon indexe 2.59 2.77 2.23 2.79 Chao1 28.25 38.50 42.50 30.00 Chao1 (95%H)f 64.72 91.91 128.50 63.10 Chao1 (95%L)g 19.65 24.22 21.66 21.74 a Calculations were based on OTUs formed at an evolutionary distance of r = 0.03.
b S defined as the number of OTUs.
c N defined as the number of sequences.
d Evenness defined as the Shannon index or H/log S.
e Index of Shannon, Chao 1 were accounted in DOTUR.
f 95% H: 95% higher confidence interval for Chao1.
g 95% L: 95% lower confidence interval for Chao1.
SM: Shrub mineral samples, GH: Grass humus samples, GM: Grass mineral samples.Detailed phylogenetic analysis grouped the bacterial sequences into 10 phyla that are often encountered in soils worldwide (Proteobacteria, Acidobacteria, Actinobacteria, Bacteroidetes, Planctomycetes, Verrucomicrobia, Chloroflexi, and Cyanobacteria) (Fig. 1). Acidobacteria was the most abundant phylum in all the analyzed samples (32%), followed by Proteobacteria (23%) and Actinobacteria (11%). These three taxa accounted for more than half of all sequences. Fifty-five clones were affiliated with the phylum Acidobacteria and further clustered into four subdivisions of G 3, 4, 5, and 6. The majority of the sequences were affiliated to G 4 and G 6, both mainly found in the mineral soil. Vertical spatial variations of bacterial community composition strikingly presented in the results, especially in phylum distributions of predominant groups, were significantly different between the humus and mineral soils. Acidobacteria phyla were relatively more abundant in the mineral soil than in the humus soil (23% vs. 8%), whereas Proteobacteria and Actinobacteria sequences were more abundant in the humus soil than in the mineral soil (14% vs. 9% and 8% vs. 2%, respectively). In addition, the effects of vegetation type were presented when combined with soil horizons and in dominant groups. For example, Bacteriodetes and Planctomycetes dominated in the shrub humus horizon, whereas Verrucomicrobia dominated in the grass mineral soil.
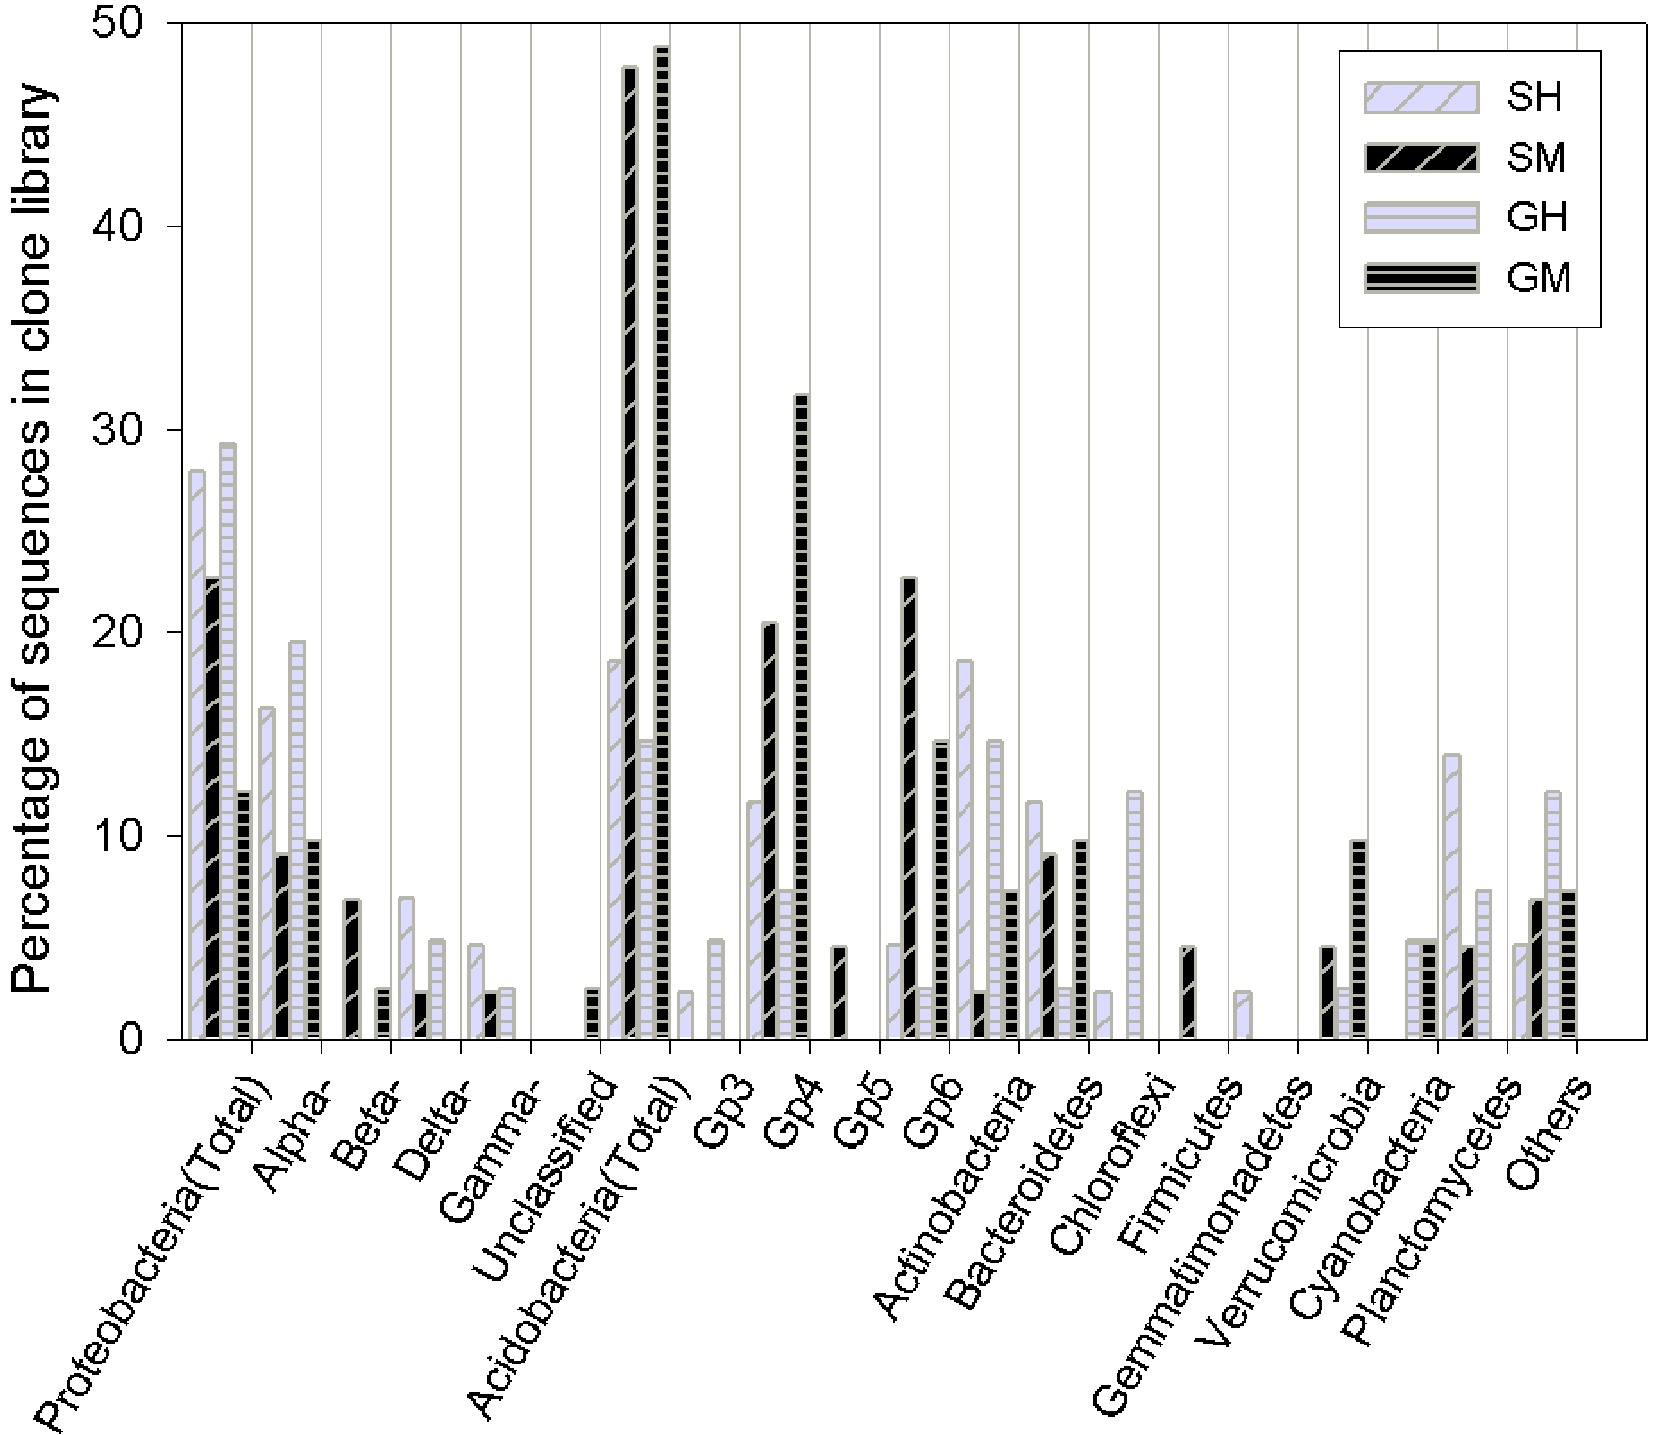
Figure 1. Bar charts of the bacterial clone library composition at the phylum level (as well as the subdivision level for Proteobacteria and Acidobacteria) for the vegetated soil in Yuanjiang Hot Valley. SH: Shrub humus samples, SM: Shrub mineral samples, GH: Grass humus samples, GM: Grass mineral samples. The 'others' category includes: fusobacteria and the candidate phyla, OP10 and TM7.
The significant effects of the soil horizon and vegetation on bacteria and fungi were supported using UniFrac distance matrix analysis (p < 0.01) (Table 2).
Table 2. P values of sequence library comparisons for 16S (A) and 18S (B) rRNA gene P values are for contrasts between each pair of clone libraries using UniFrac.
Soil Sample Shrub Humus (SH) Shrub mineral (SM) Grass Humus (GH) Grass Mineral (GM) Vegetation (S/G) Soil horizon (H/M) (A) Shrub humus (SH) Shrub mineral (SM) 0.96 Grass humus (GH) 1.00 0.06 Grass mineral (GM) 0.06 0.18 0.06 Vegetation (S/G) <0.01 Soil horizon (H/M) <0.01 (B) Shrub humus (SH) Shrub mineral (SM) 0.06 Grass humus (GH) 0.72 0.06 Grass mineral (GM) 1.00 0.24 0.06 Vegetation (S/G) <0.01 Soil horizon (H/M) <0.01 SM: Shrub mineral samples, GH: Grass humus samples, GM: Grass mineral samples H: Pooled humus samples, M: Pooled mineral samples, S: Pooled shrub samples, G: Pooled grass samples. Bacterial DGGE diversity profiles across vegetations and horizons
-
The UPGMA clustering based on the band-based Dice similarity matrix showed the formation of two distinct clusters of 16S rRNA DGGE profiles from soils (G, E, S) for humus (GH, EH, SH) and mineral horizons (GM, EM, SM) (Fig. 2a). Shrubland samples were separated from the grassland and shrub–grass ecotone sample clusters with similarity values of 80% in the humus soil and of 75% in the mineral soil. In both horizons, shrub–grass ecotone samples were clustered with grassland samples and shared more than 80% similar bands. Minor changes were found within the sample sites, reflecting high similarity values (> 90%). RDA analysis showed that bacterial DGGE profiles were significantly affected by the horizons (p < 0.01). The effects of the interaction between vegetation and soil horizon (p < 0.01) accounted for 23% of the variations in the bacterial community. The effect of vegetations was slightly significant (p < 0.05) and accounted for 17% of the variations in the bacterial communities (Table 3). Bacterial species richness was similar among vegetations on the humus horizons, but different on the mineral horizons (Fig. 2a). Veridical variations were more significant in samples from ecotone and especially from grassland, where species richness was much higher in the mineral horizon than that in the humus horizon (p < 0.01).
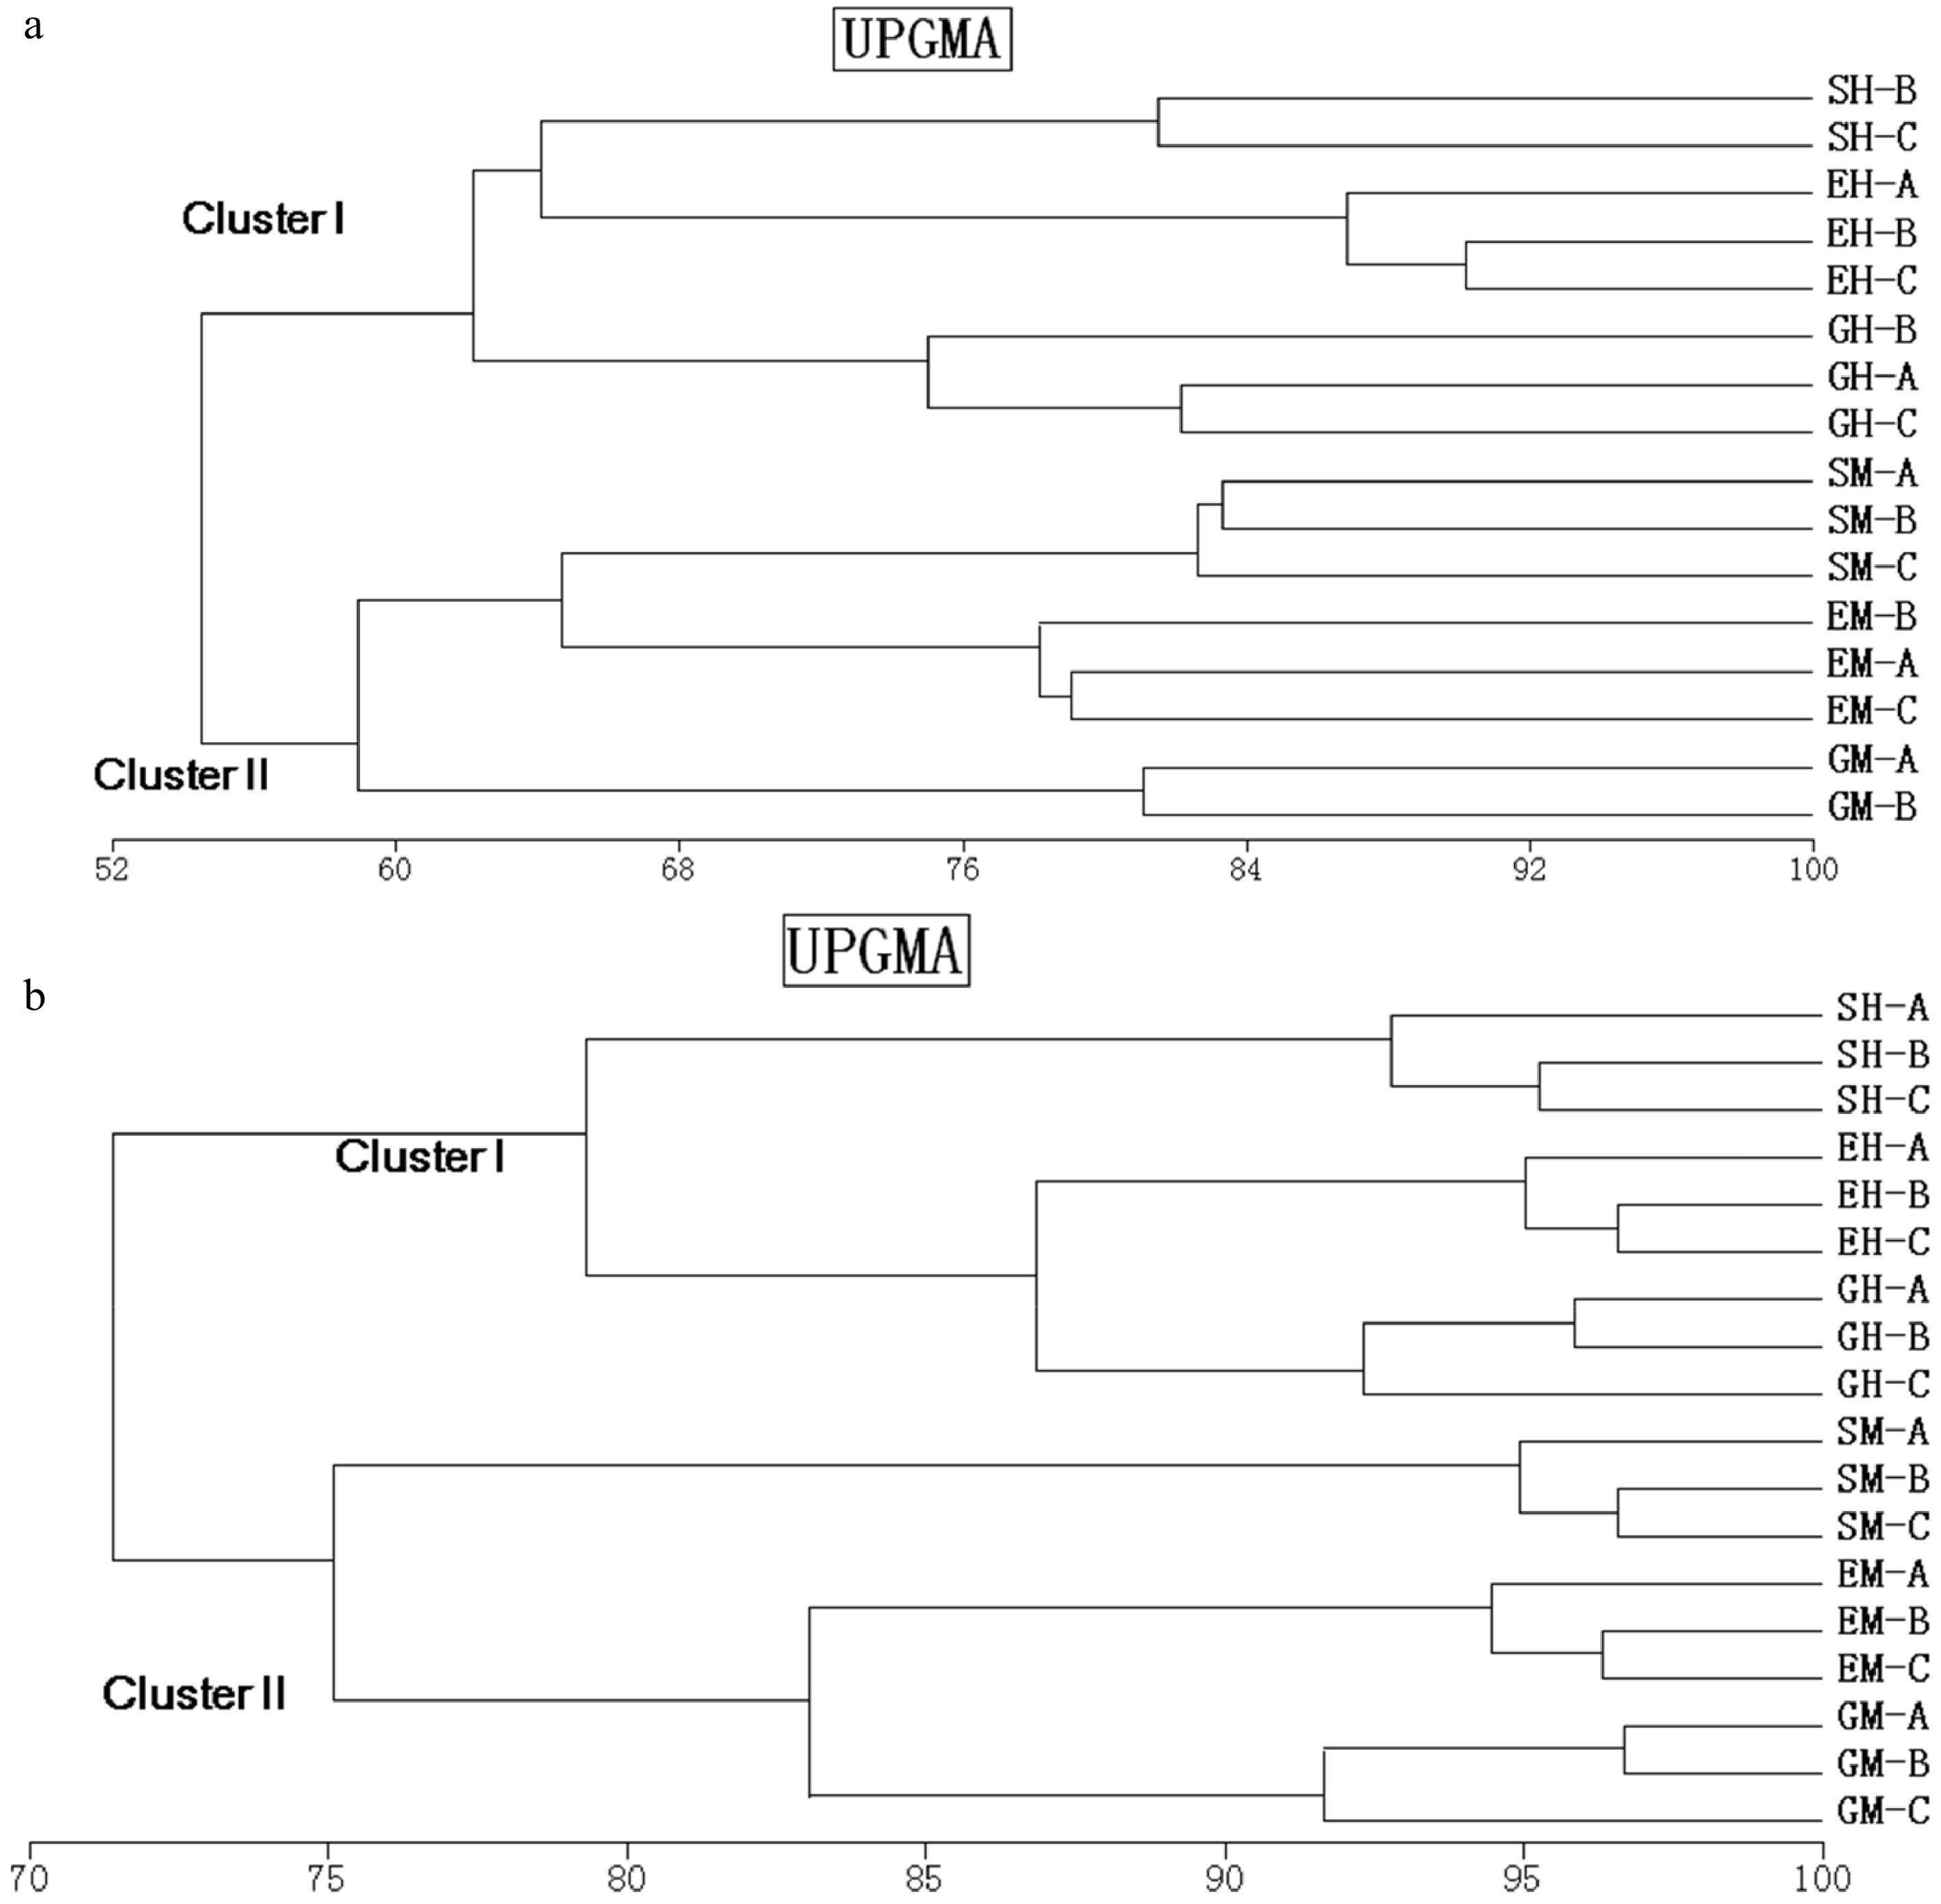
Figure 2. Dendrogram obtained after the cluster analysis with UPGMA, and the similarity coefficient of Pearson, comparing one set of replicates of bacterial 16S rRNA (a) and 18S rRNA (b) gene fragments amplified from shrubland, grassland, and ecotone DNA templates obtained from different soil horizons. SM: Shrub mineral samples, GH: Grass humus samples, GM: Grass mineral samples, EH: Ecotone humus samples; EM: Ecotone mineral samples.
Table 3. P values of sample comparisons for bacteria and fungi genes using the DGGE analysis.
Bacteria Fungi λ F P λ F P Vegetation 0.168 3.242 0.016 0.217 3.872 0.002 Soil horizon 0.318 7.640 0.002 0.160 2.647 0.004 Vegetation vs. soil horizon 0.228 7.418 0.002 0.128 2.060 0.034 Furthermore, 18S rRNA DGGE profiles formed two clusters related to soil horizon. However, the similar value was low between vegetations (Fig. 3b). Grassland samples were separated from the shrubland and shrub–grass ecotone samples clustered with similarity values of 62% and 60% in the humus and mineral soils, respectively. The similarity values of the shrub–grass ecotone and shrubland were 64% and 65% in the humus and mineral samples, respectively. Approximately 20% of the DGGE bands varied among replicates, indicating a higher heterogeneity in fungal distribution pattern than in bacteria. The RDA analysis showed that the fungal DGGE profiles were significantly affected by vegetation (p < 0.01). Vegetation accounted for 22% of the total variation, followed by the soil horizon (p < 0.01), which accounted for 17% of the variations in the bacterial community. The effects of the interaction between vegetations and soil horizon were slightly significant (p < 0.05) and accounted for 13% of the variations of the bacterial community (Table 3). Fungal species richness was calculated using the number of DGGE bands (Fig. 3b). Fungal species richness was significantly different among vegetations, especially in the mineral horizon. Similar to bacteria, veridical variations were more significant in the samples from ecotone and especially in grassland, where species richness was much higher in the humus than in the mineral horizon (p < 0.01).
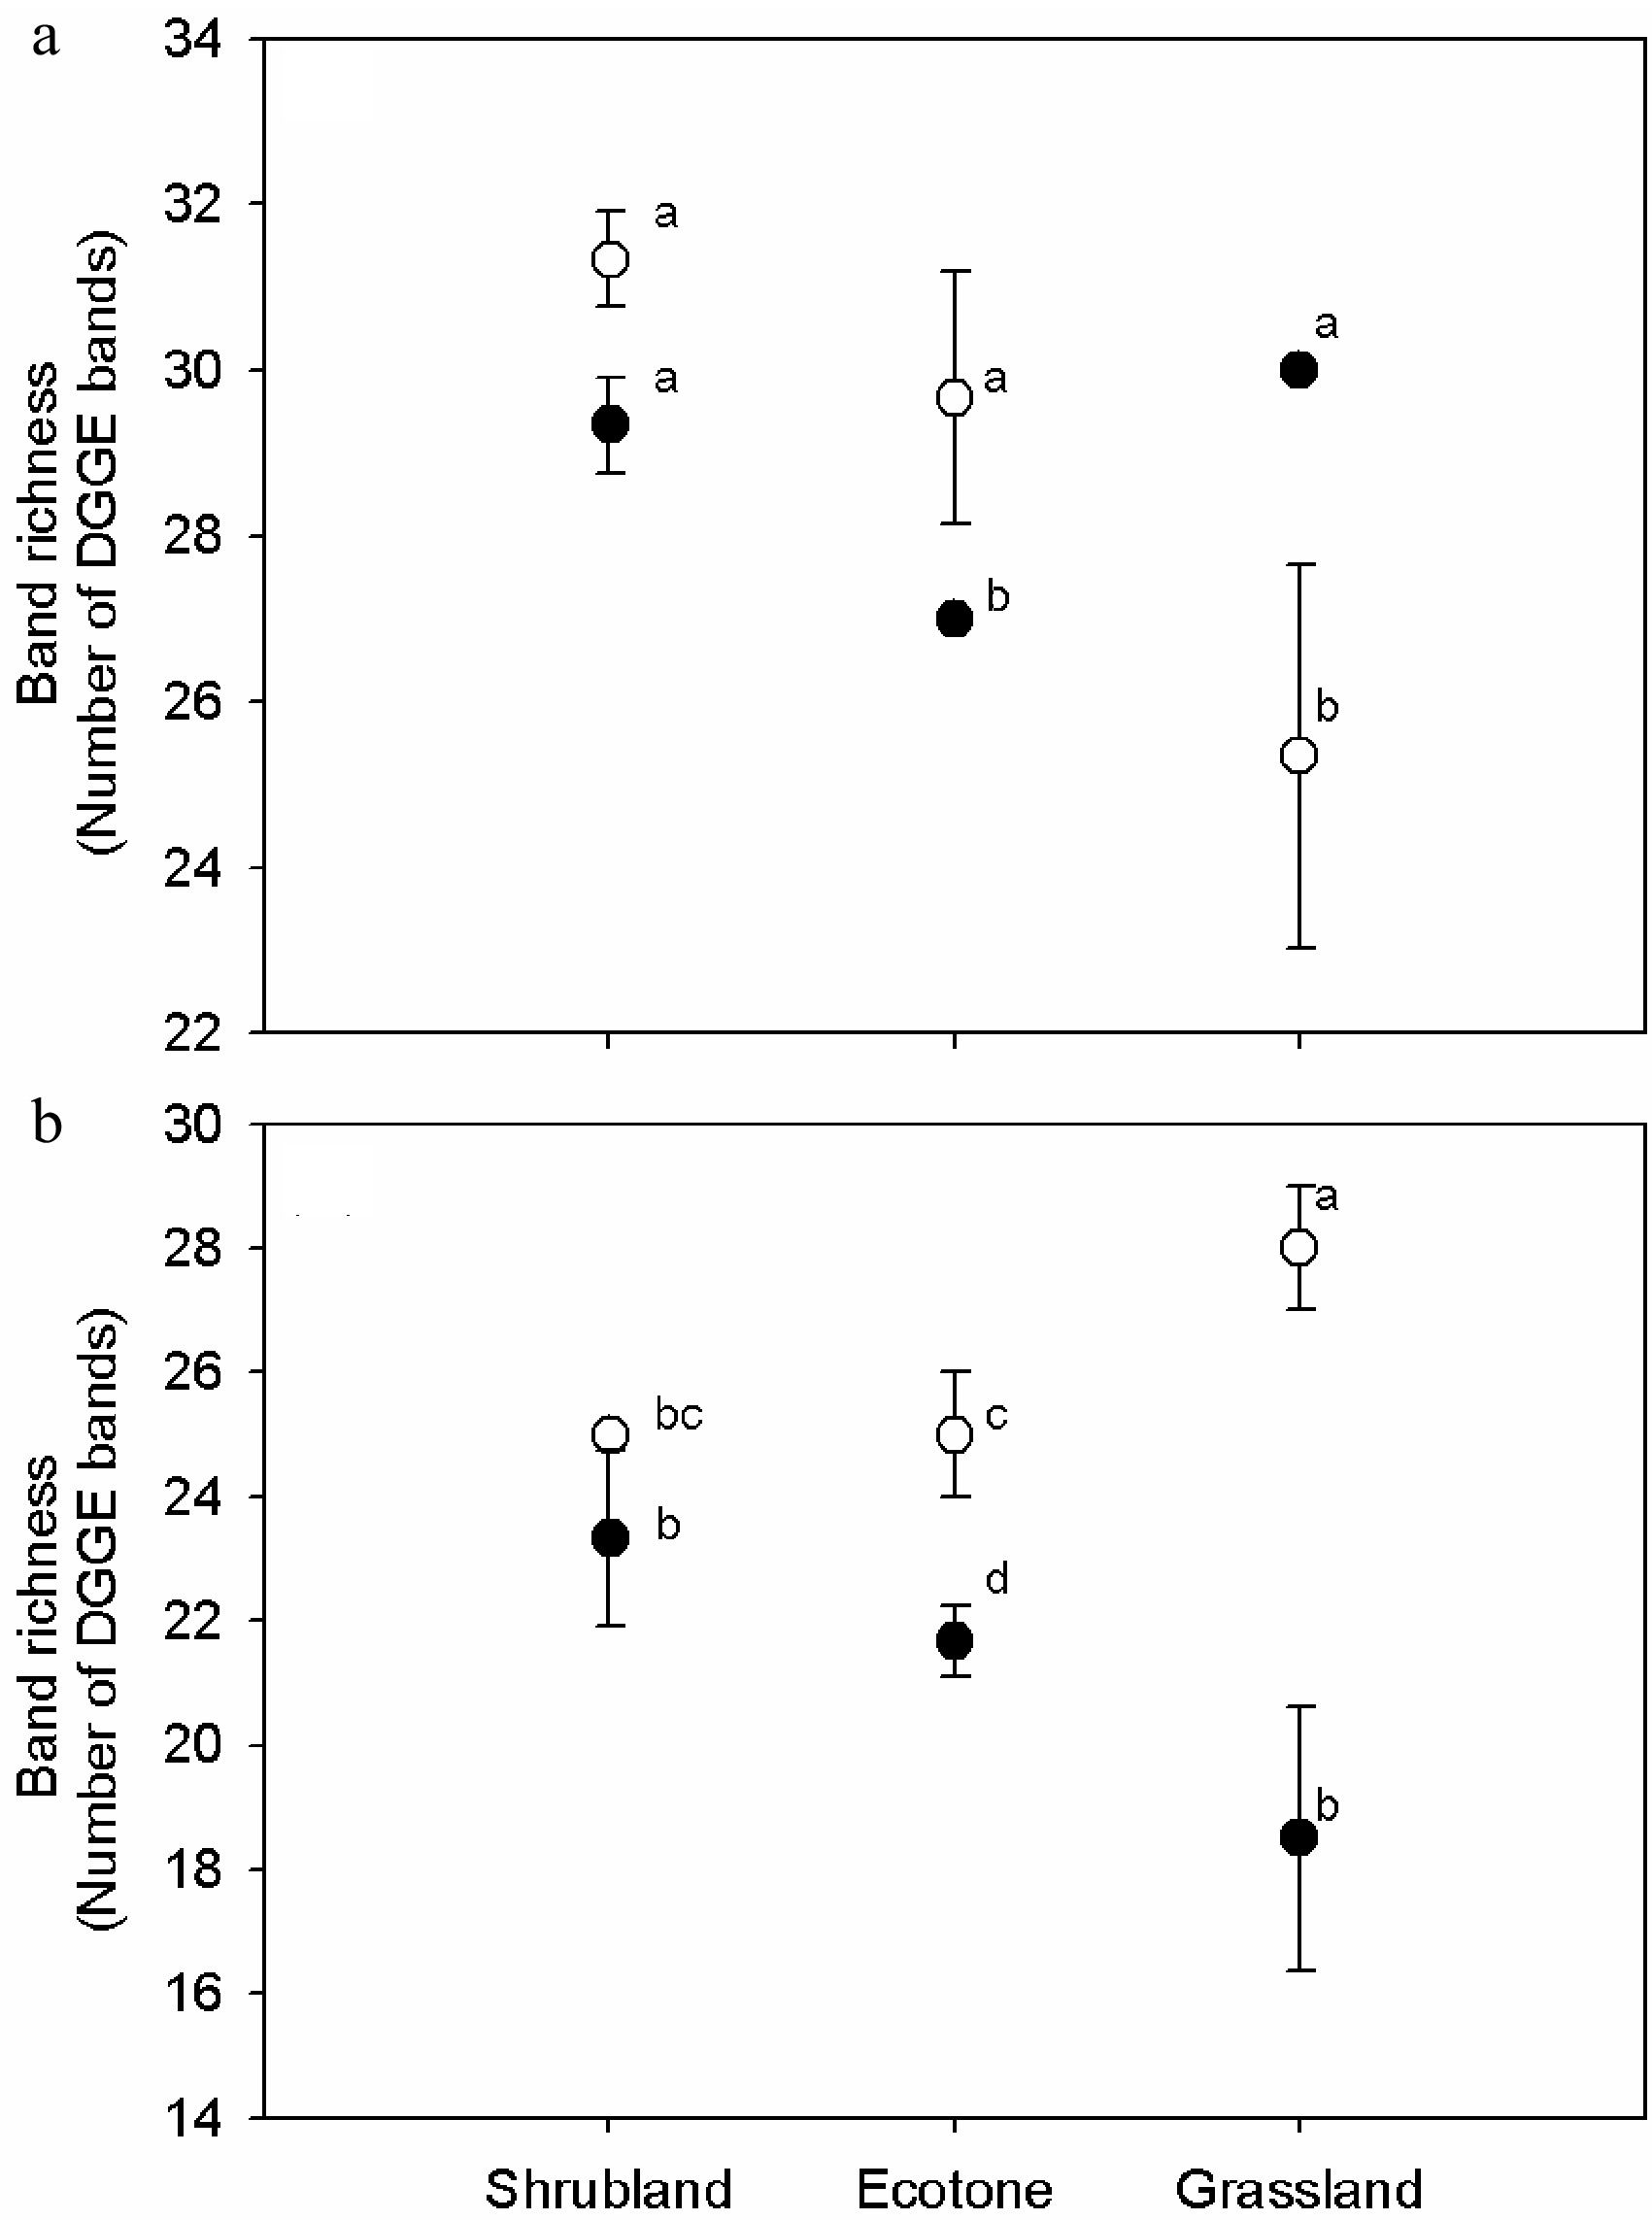
Figure 3. Variations of (a) 16S and (b) 18S rRNA gene DGGE band richness in the humus soil and mineral horizon of the shrub mix and grass. One-way ANOVA was used for statistical testing between samples. Values with the same letter are not significantly different (p > 0.01). Open and closed circles stand for humus and mineral soil samples, respectively.
-
In the present study, changes in bacterial and fungal community structures were shown across the vegetation gradient. Several studies explicitly employed gradient analyses to investigate microbial responses in the soil to the vegetation change above ground, but yielded different results[31]. For example, Wallenstein et al.[32] evaluated the fungal and bacterial community structures in tussock, inter-tussock, and shrub soils at Toolik Lake. They found significantly different communities across vegetation types that were correlated to the availability of carbon resources. In another study, authors explored soil-borne microorganisms (bacteria, fungi, and nematodes) at five locations along a southern latitudinal gradient[33]. The effects between vegetation cover and location had strong interactions, reflecting as the effects of vegetation cover being only pronounced in more extreme sites. Therefore, a complex intricacy was noted between vegetation, climate, and soil factors in determining the microbial communities. The technique used in the study may also play a role.
Changes in fungal communities in relation to vegetation were significantly more pronounced than in bacteria. Microbial biogeography studies showed different distribution patterns between bacteria and fungi due to their different nutrient and carbon resources or physical adaptation abilities[34]. Previous studies suggested that bacteria were more affected by soil pH and geographic distance, whereas fungi were more affected by soil carbon and nutrient conditions. Zinger et al.[7] evaluated the effects of geographic distance, environmental characteristics, and plant compositions on soil microbial communities. They presented contrasting distribution patterns between fungi and bacteria. They also suggested that the plant–soil feedback strongly act on the fungal community assemblages, mainly through variations in mutualistic associations with plants on bacteria, mainly through plant-mediated modification of soil properties. Their expectations may explain our observations to some extent.
Previous studies have pointed out that variations in fungal communities between vegetation types are related to differences in the relative abundances of major phyla. In contrast, for bacterial communities, differences between vegetation types were related to differences in relative abundances of some minor phyla such as Bacteriodetes and Planctomycetes. The variations may be related to the soil texture and moisture differences between the shrubland and grassland[35].
Bacterial and fungal communities in relation to soil horizons
-
The main finding of this study was that the soil horizon had more impact on community variations than vegetation. Vertical spatial variations in soil microbial communities have been reported in several studies. For example, Fierer et al.[36] observed distinctly different bacterial communities between soil horizons in grassland. They also predicted the correlation of these differences with the soil carbon and nutrient distribution patterns. Similarly, fungi presented different vertical compositions along the soil depth in forest soil, but such differences were related to changes associated with mycorrhizal fungi[37]. However, a study on the soil bacterial communities from shrub and pasture in a high-plateau area found no significant differences between the soil horizons[38]. Therefore, some special soil characteristics in the soil horizon likely led to differences in microbial communities.
Unlike under vegetation, the effects of soil horizon are pronounced on both bacterial and fungal communities. Vertical differences in the fungal community structures were observed in the Ascomycota/Basidiomycota ratio. Similarly, the vertical variation of bacterial the community was correlated to the change in the Proteobacteria/Acidobacteria ratio, which was higher in the humus horizon than in the mineral horizon. The Proteobacteria/Acidobacteria ratio is a marker of soil carbon availability with high value, indicating high labile carbon content. The high vertical spatial heterogeneity in relation to soil carbon availability in a hot valley has been studied before. Most of the labile carbon and nutrient resources were concentrated on the surface soil and decreased sharply with soil depth due to lack of water transport[39]. The vertical heterogenic patterns of carbon and nutrient were consistent with the Proteobacteria and Acidobacteria patterns observed.
Relative interaction effects between vegetation vs. horizon
-
Interactions between the types and soil horizons strongly affect the microbial community, particularly the bacterial community. Differences in microbial communities between soil horizons were more pronounced under the grass cover than others. An explanation of this phenomenon may be related to the different carbon accumulation methods used by the grass and shrubs. In a dry-hot valley, the fine roots of the grass are mainly distributed on the soil surface (0–10 cm). By contrast, a shrub has most of its roots deep in the soil to reach the water horizon (> 20 cm), which may extend beyond our sampling region. Consequently, the significant vertical variation of root exudates and litter substrate may be larger in soils under grass than shrub cover. In addition, the microorganisms associated with grass root are another significant factor, especially for fungi.
To our knowledge, this was the first in-depth study describing both bacterial and fungal communities in this dry–hot valley. Compared with other ecosystems, some bacterial groups are specific tothe dry–hot valley. For example, the G4 and G6 subgroups were dominant in the Acidobacteria communities of the valley ecosystem. Meanwhile, a study in Zhongdian (located in SW China) observed that Acidobacteria subgroups G1 and G2 were the dominant groups under shrubland and grassland ecosystems, while G4 and G6 were rarely found[38]. The different distribution patterns of Acidobacteria subdivisions may be related to the variation in soil pH according to their global biogeographical studies, revealing increased relative abundances of G4 and G6 with increasing pH[40]. In addition, most bacterial species belonging to Alphaproteobacteria harbored photosynthesis or N fixation abilities. Rhizobiales, an important root-related bacterial group, contains several nodule-forming bacterial species, such as Rhizobium sp. and Bradyrhizobium sp. that are commonly found in our clones[41], mostly located in the humus horizon. Primary nutrient producers, specifically N-fixer dominant in this ecosystem may explain the low input of fresh litter and frequent fire disturbances in this area.
-
In this study, we investigated the community structure of soil fungi and bacteria under dominant vegetation types in a valley savanna ecosystem using the PCR clone library method. The impact of vegetation on the microbial communities in the humus and mineral soil horizons was examined by PCR-DGGE. The following results were obtained: (1) Consistent with our expectations, the effects of vegetation are more significant on fungal communities than on bacterial communities; (2) in contrast to our second expectation, vertical spatial variation was significant in both bacterial and fungal communities in this dry–hot valley; (3) the interaction effect between the vegetation and soil horizon was more remarkable on bacteria than on fungi; and (4) distinct vegetation did not necessarily harbor distinctly different bacterial or fungal communities. However, significant differences in bacterial and fungal communities between humus and mineral horizons were noted due to the changes in the Proteobacteria/Acidobateria and Ascomycota/Basidiomycota ratios. The results suggested that the active 'microbial hot spots' of the dry–hot valley were mainly concentrated on the top surface layer. These microbial hot spots are important to plants by mediating carbon and nutrients in soil and are also sensitive to human activity. Therefore, further study on the preservation of these 'hot spots' is important.
- This study was funded by a grant (No. 90302013) of National Natural Science Foundation of China. We would like to thank Dr. Onchim Chan and Dr. Xiaoming Zou for experiment and manuscript advices, Dr. Diqiu Yu, Dr. Qingjun Li, and Dr. Kunfang Cao for sharing their laboratory and field facility.
- The authors declare that they have no conflict of interest.
- Supplemental Fig. S1 Rarefaction curves of the partial sequences of (A) bacterial 16S and (B) fungal 18S rRNA genes from the vegetated soil in Yuanjiang Hot Valley calculated by DOTUR, with 3% distance cutoff. The gray and black lines indicate the samples from humus and mineral horizons, respectively.
- Copyright: © 2021 by the author(s). Exclusive Licensee Maximum Academic Press, Fayetteville, GA. This article is an open access article distributed under Creative Commons Attribution License (CC BY 4.0), visit https://creativecommons.org/licenses/by/4.0/.
-
About this article
Cite this article
Shi L, Xu J, Gui H. 2021. Effects of vegetation type and soil horizon on soil bacterial and fungal communities in a dry–hot valley. Circular Agricultural Systems 1: 10 doi: 10.48130/CAS-2021-0010

Effects of vegetation type and soil horizon on soil bacterial and fungal communities in a dry–hot valley
- Received Date: 18 July 2021
- Accepted Date: 30 August 2021
- Published Online: 16 September 2021
Abstract: Soil horizon and vegetation cover significantly impact the spatial patterns of soil fungal and bacterial communities. However, such impacts and their interactions are poorly characterized in dry–hot environments. Soil samples were collected from two soil horizons (humus and mineral) along a vegetation gradient (shrubland, grassland, and shrub–grass ecotone) in a dry-hot valley of Southwestern China to assess the effects of vegetation versus soil horizons on shaping soil microbial communities. We used denaturing gradient gel electrophoresis to estimate the microbial spatial pattern change across the vegetation gradients and clone libraries targeting small subunit rRNA genes to characterize the microbial community structures between distinct vegetation types and soil horizons. Bacterial DNA profile patterns were not significantly different across vegetation types but strongly correlated with soil horizons, with significant interaction effects. By contrast, fungi were remarkably different across vegetation types and soil horizons, without significant interactions effect. Distinct vegetation types did not necessarily harbor distinct bacterial or fungal community compositions. Rather, both community compositions were most strongly affected by the soil horizons. Together with these results, the soil vertical heterogeneity rather than vegetation changes is suggested to best predict shifts in soil microbial communities in this dry-hot valley area.
-
Key words:
- Soil microbial community /
- DGGE /
- Clone library /
- Shrubland /
- Grassland /
- dry–hot valley