-
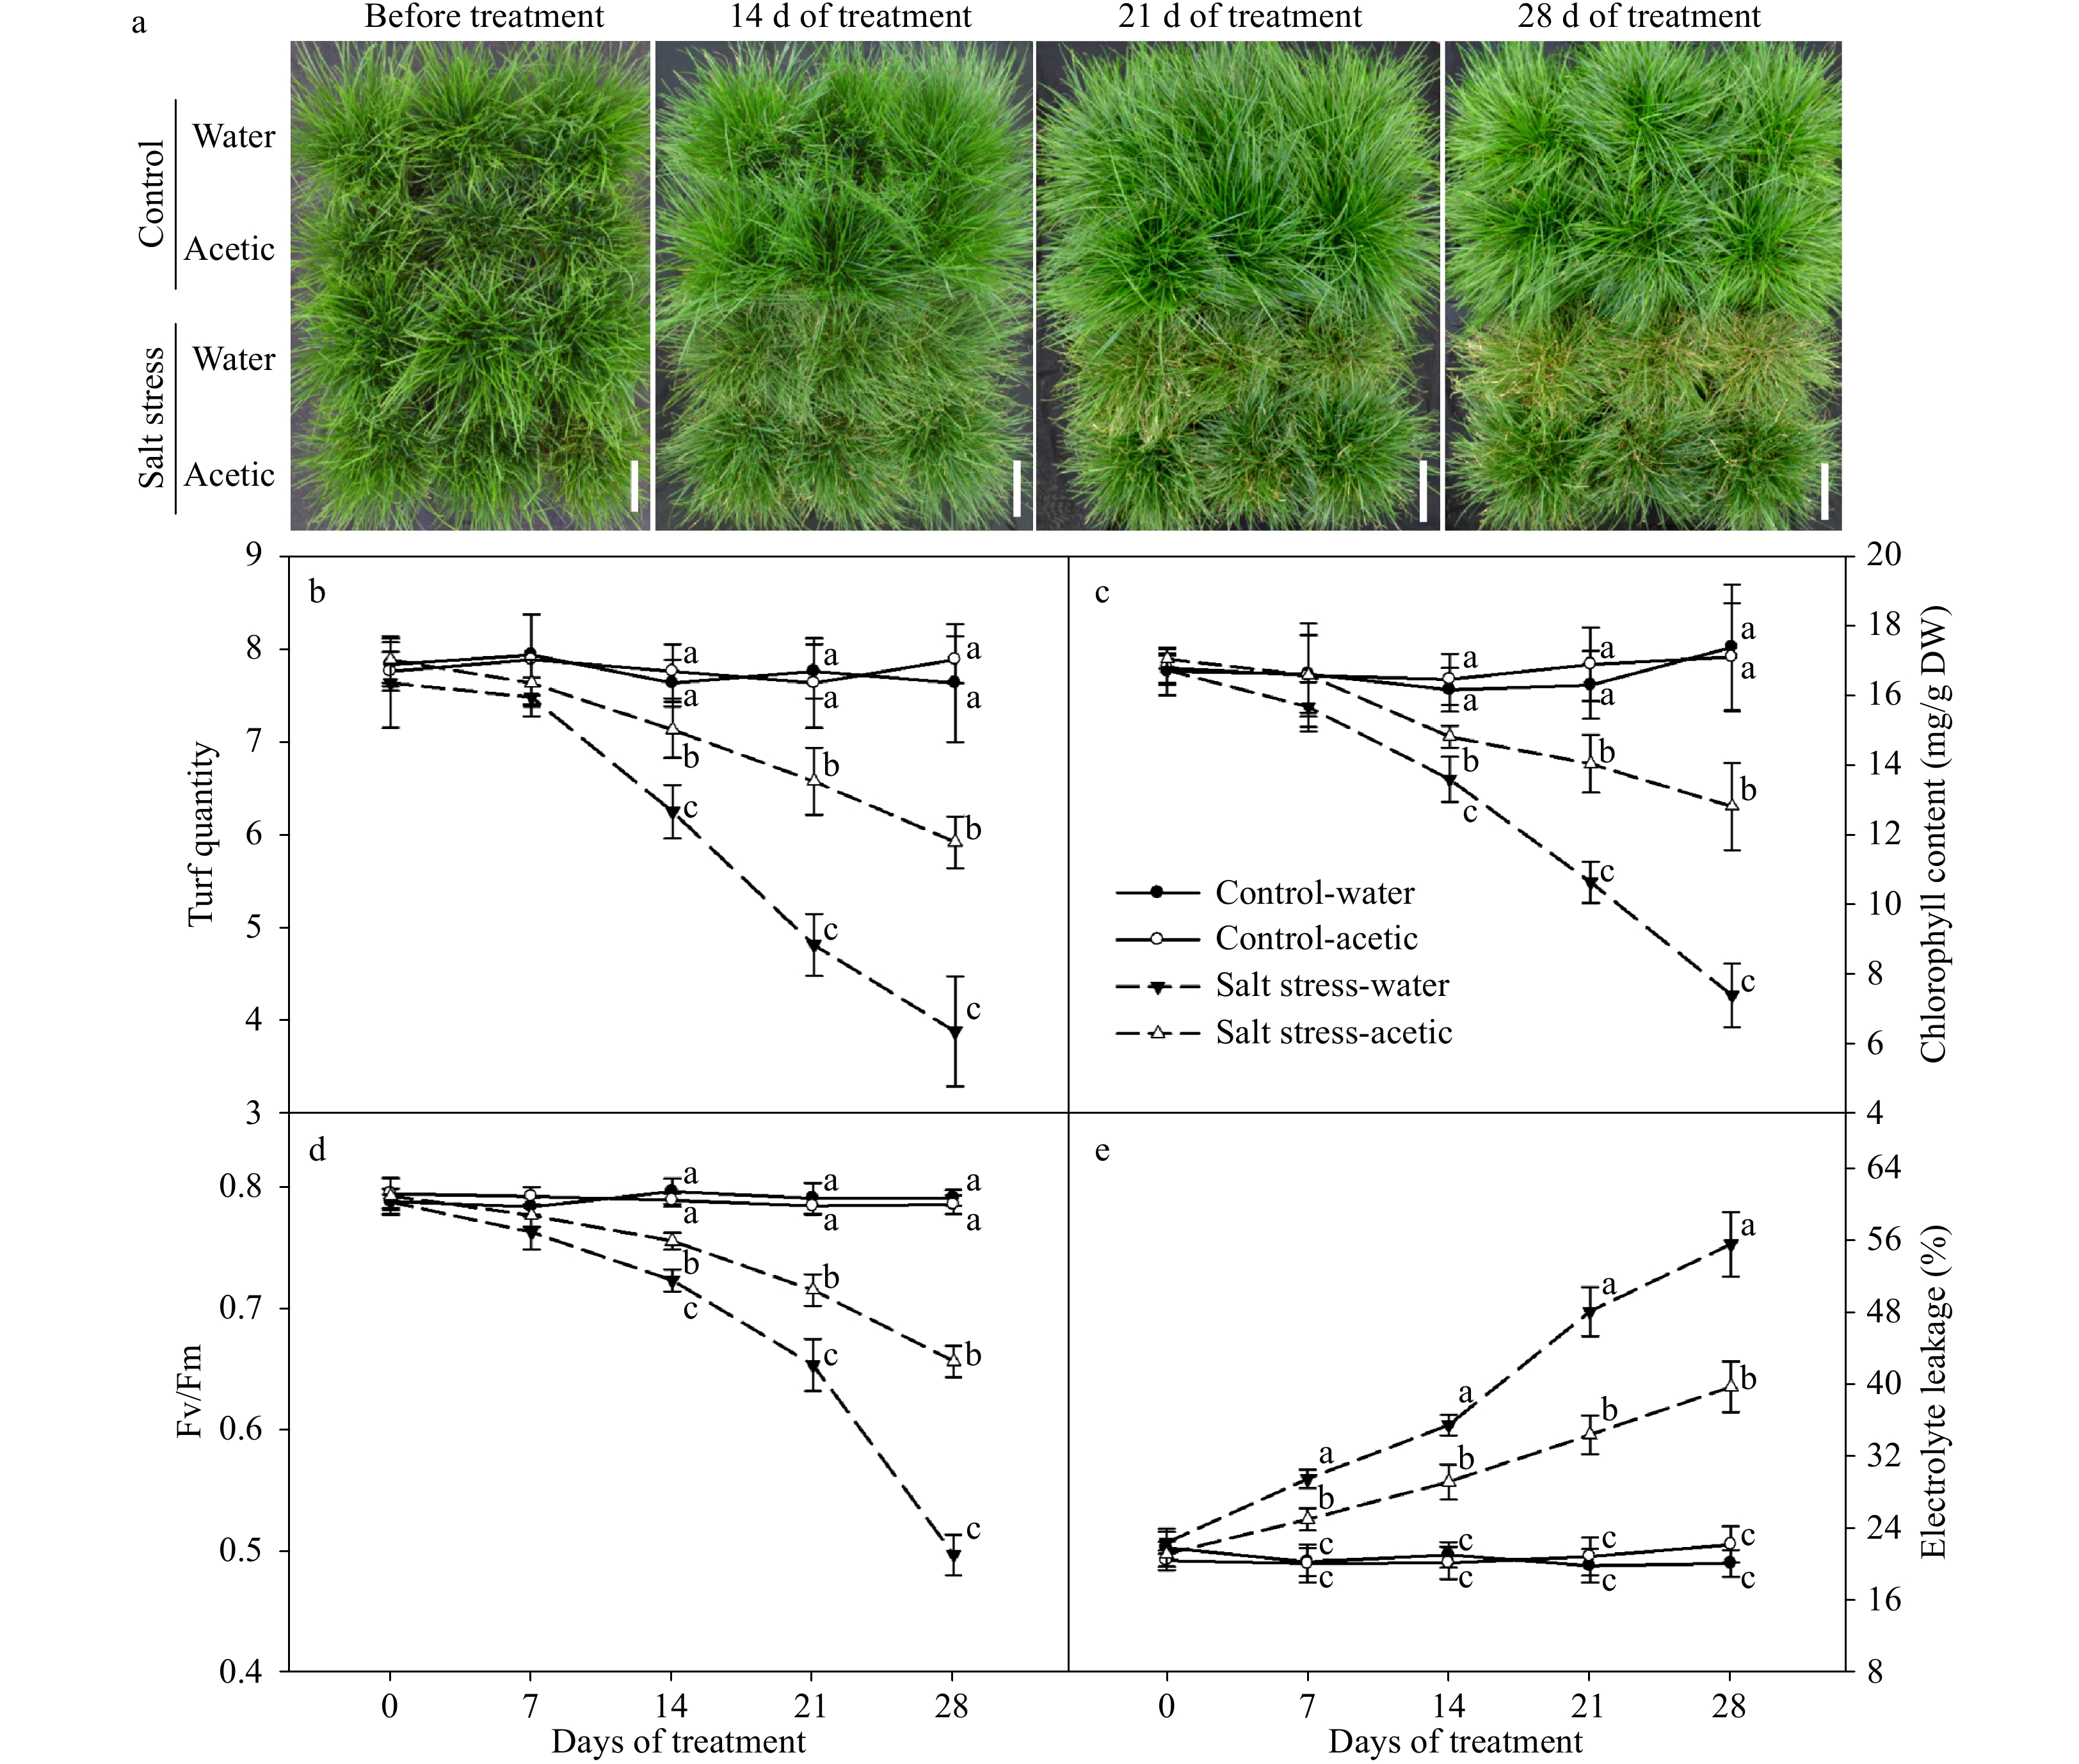
Figure 1. Effects of acetic acid on turf quality and leaf senescence of perennial ryegrass under control or salt stress conditions. (a) Phenotype; (b) turf quality; (c) Chl content; (d) photochemical efficiency; (e) electrolyte leakage. Data labeled with different letters indicate significant differences among the treatments at a given day based on Fisher’s protected LSD test at P ≤ 0.05 probability level (n = 4 in b, c, d, & e).
-
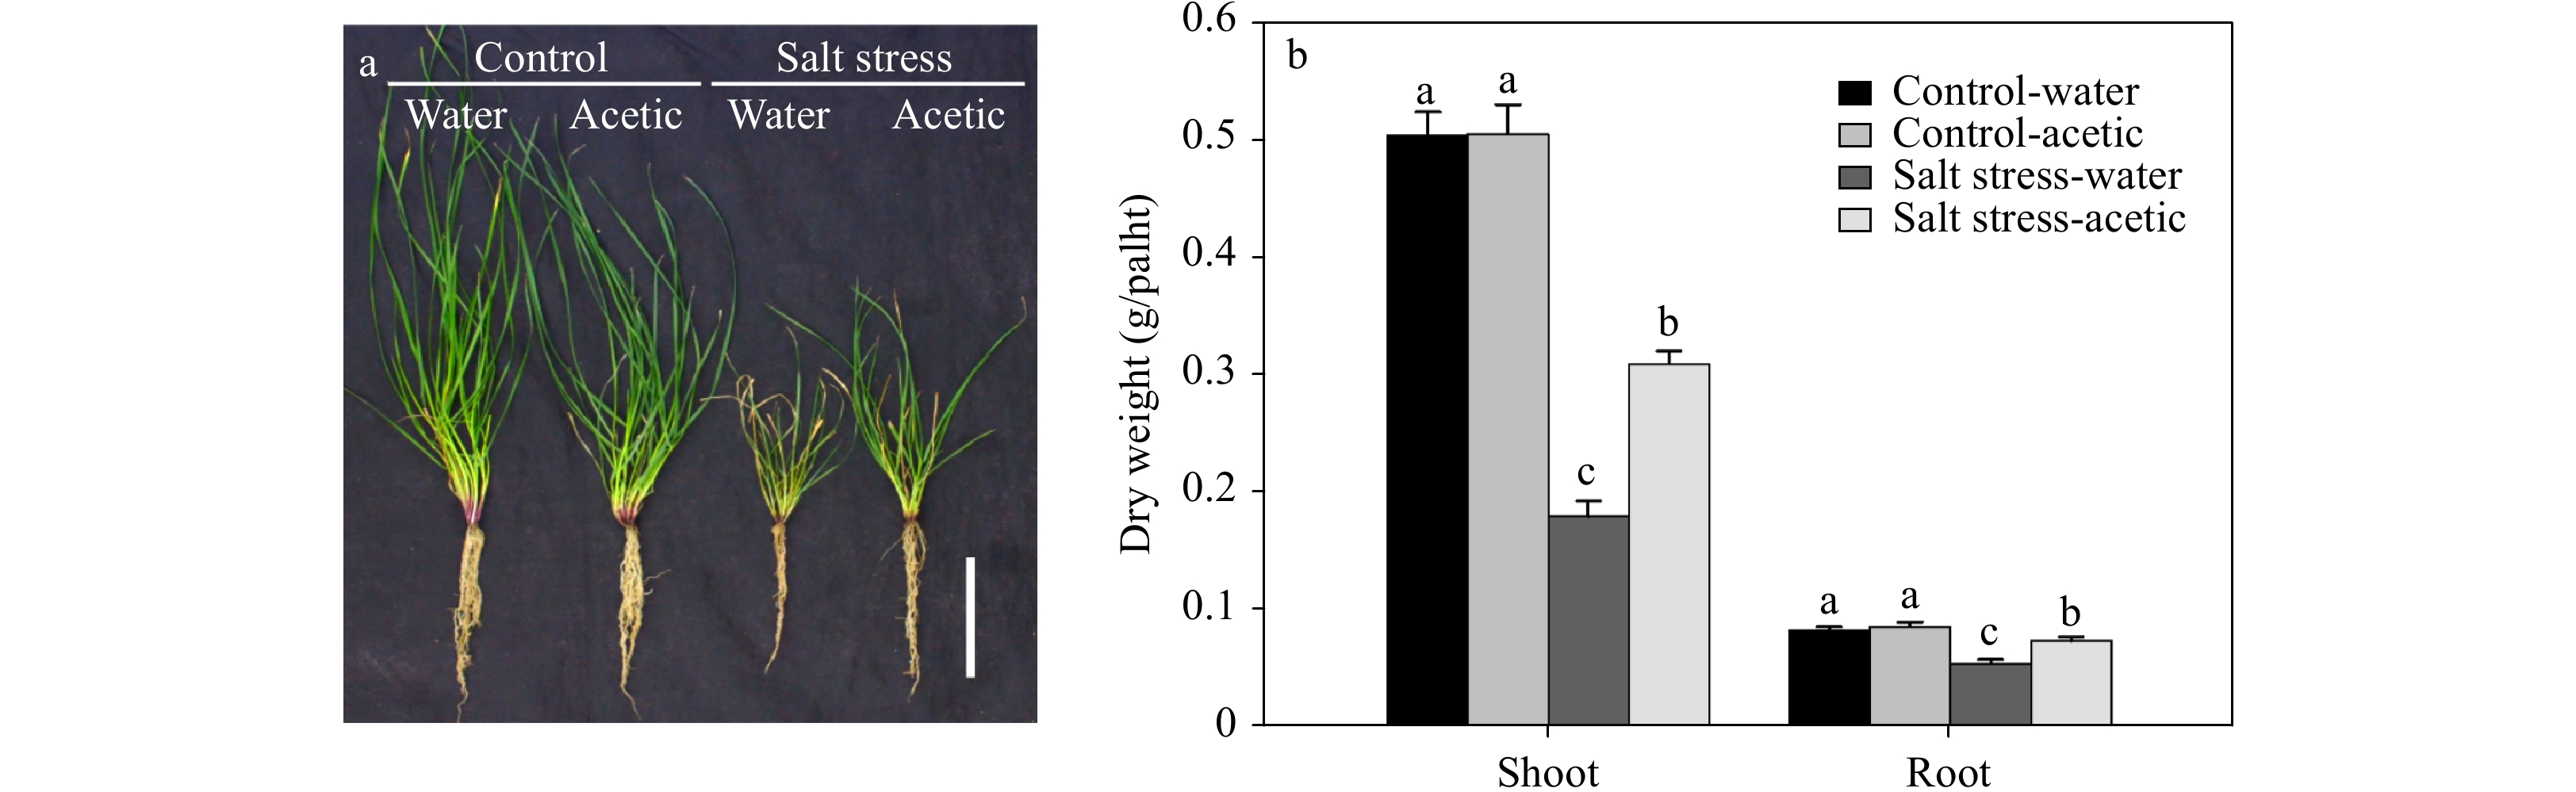
Figure 2. Effect of acetic acid on above-ground and root biomass of perennial ryegrass under control and salt stress conditions. (a) Phenotype of individual plants; (b) dry weight per plant. Photo and data were collected at 28 d of salt stress. Bars labeled with different letters indicate significant differences among the treatments at a given day based on Fisher’s protected LSD test at P ≤ 0.05 probability level (n = 4 in b).
-
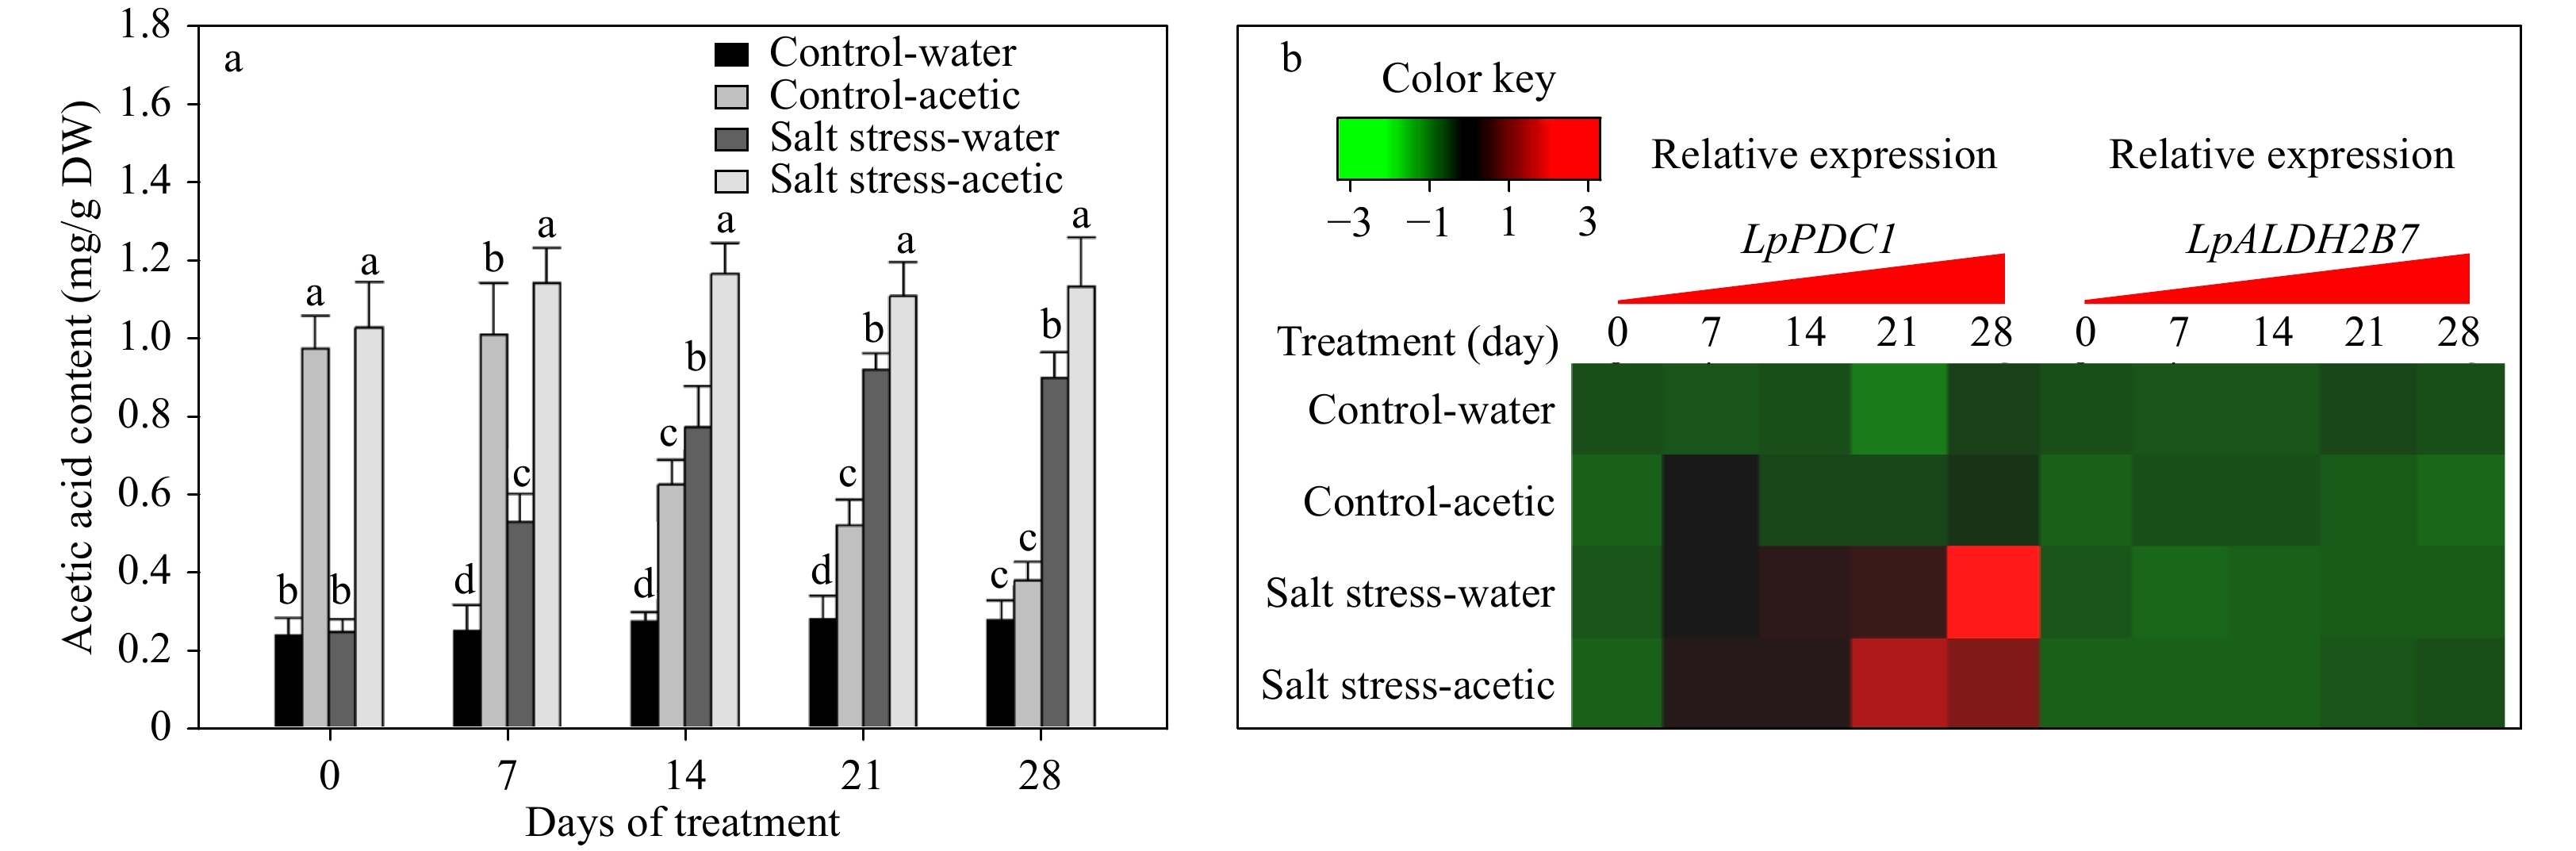
Figure 3. Effect of exogenous application of acetic acid on endogenous acetic acid levels, and the transcription of two acetic acid biosynthesis genes, LpPDC1 and LpALDH2B7, in perennial ryegrass leaves under control and salt stress conditions. Bars labeled with different letters indicate significant differences among the treatments at a given day based on Fisher’s protected LSD test at P ≤ 0.05 level (n = 4 in a & b).
-
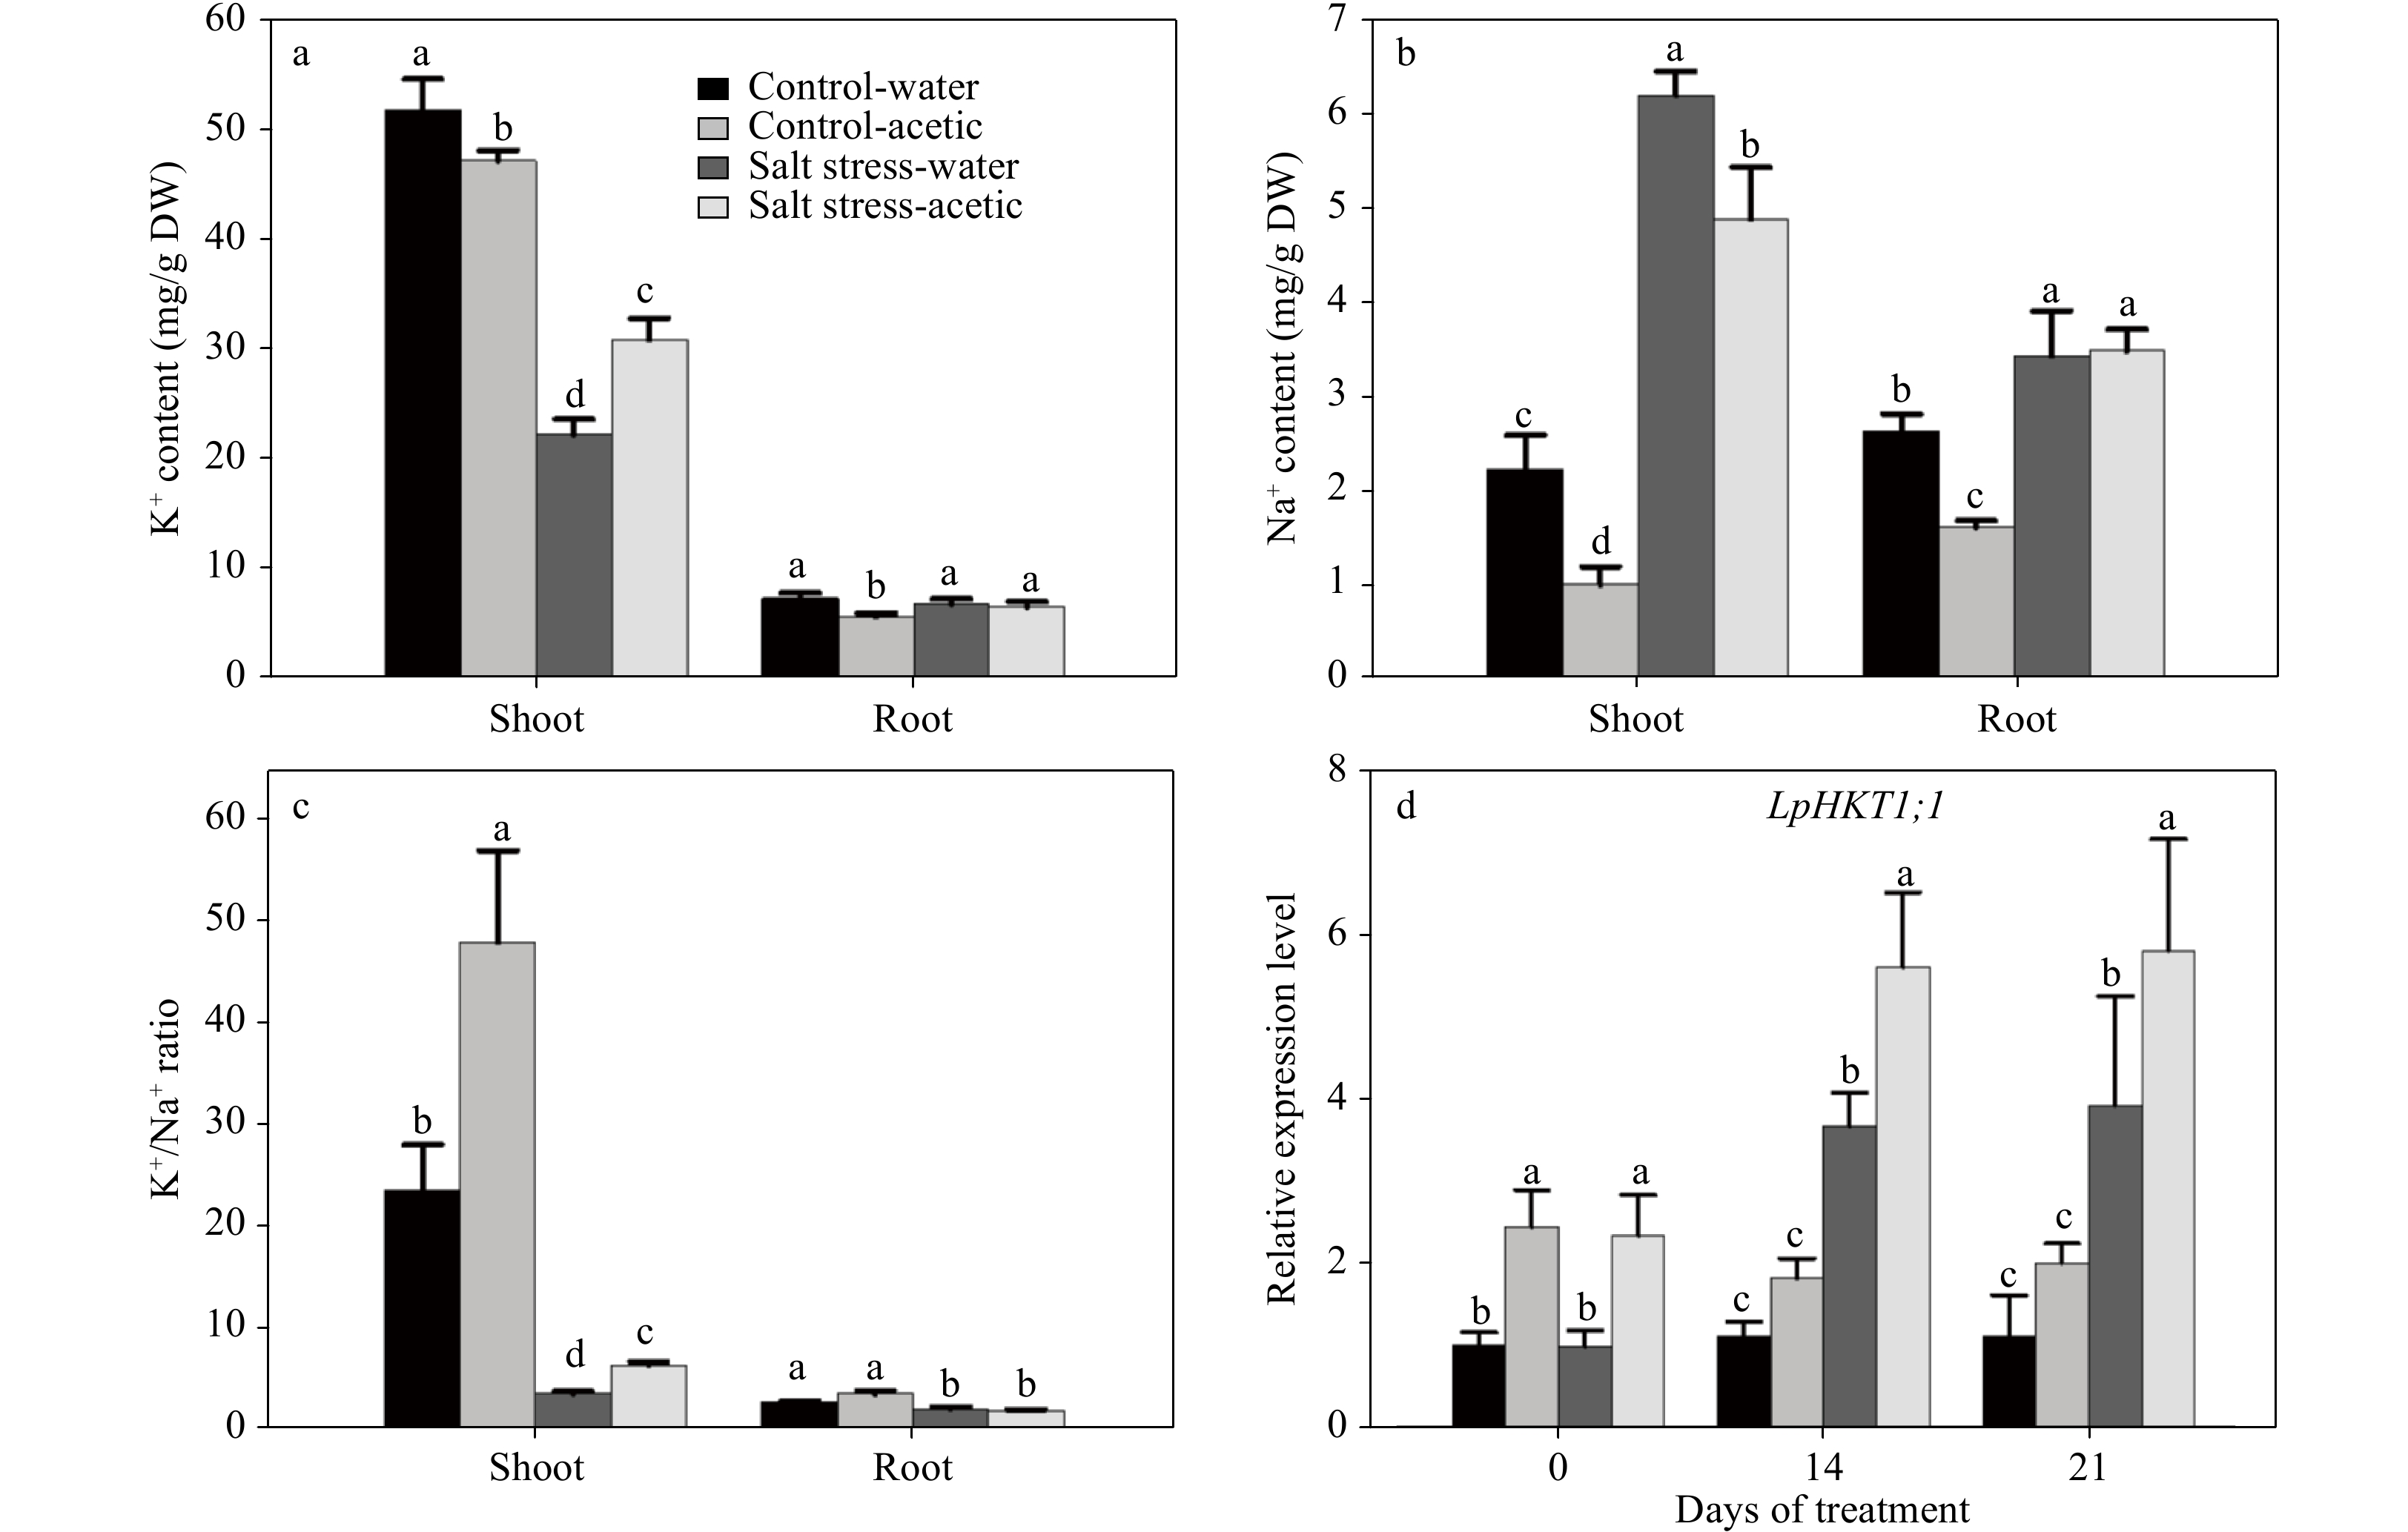
Figure 4. Effect of exogenous application of acetic acid on K+ and Na+ content, K+/Na+ ratio, and expression of LpHKT1;1 in perennial ryegrass under control and salt stress conditions. Data in (a), (b), and (c) were collected at 21 d of treatment. (d) the expression of LpHKT1;1 in leaves were analyzed at 0, 14, and 21 d. Bars labeled with different letters indicate significant differences among the treatments at a given day based on Fisher’s protected LSD test at P ≤ 0.05 level (n = 4 in a, b, & c).
-
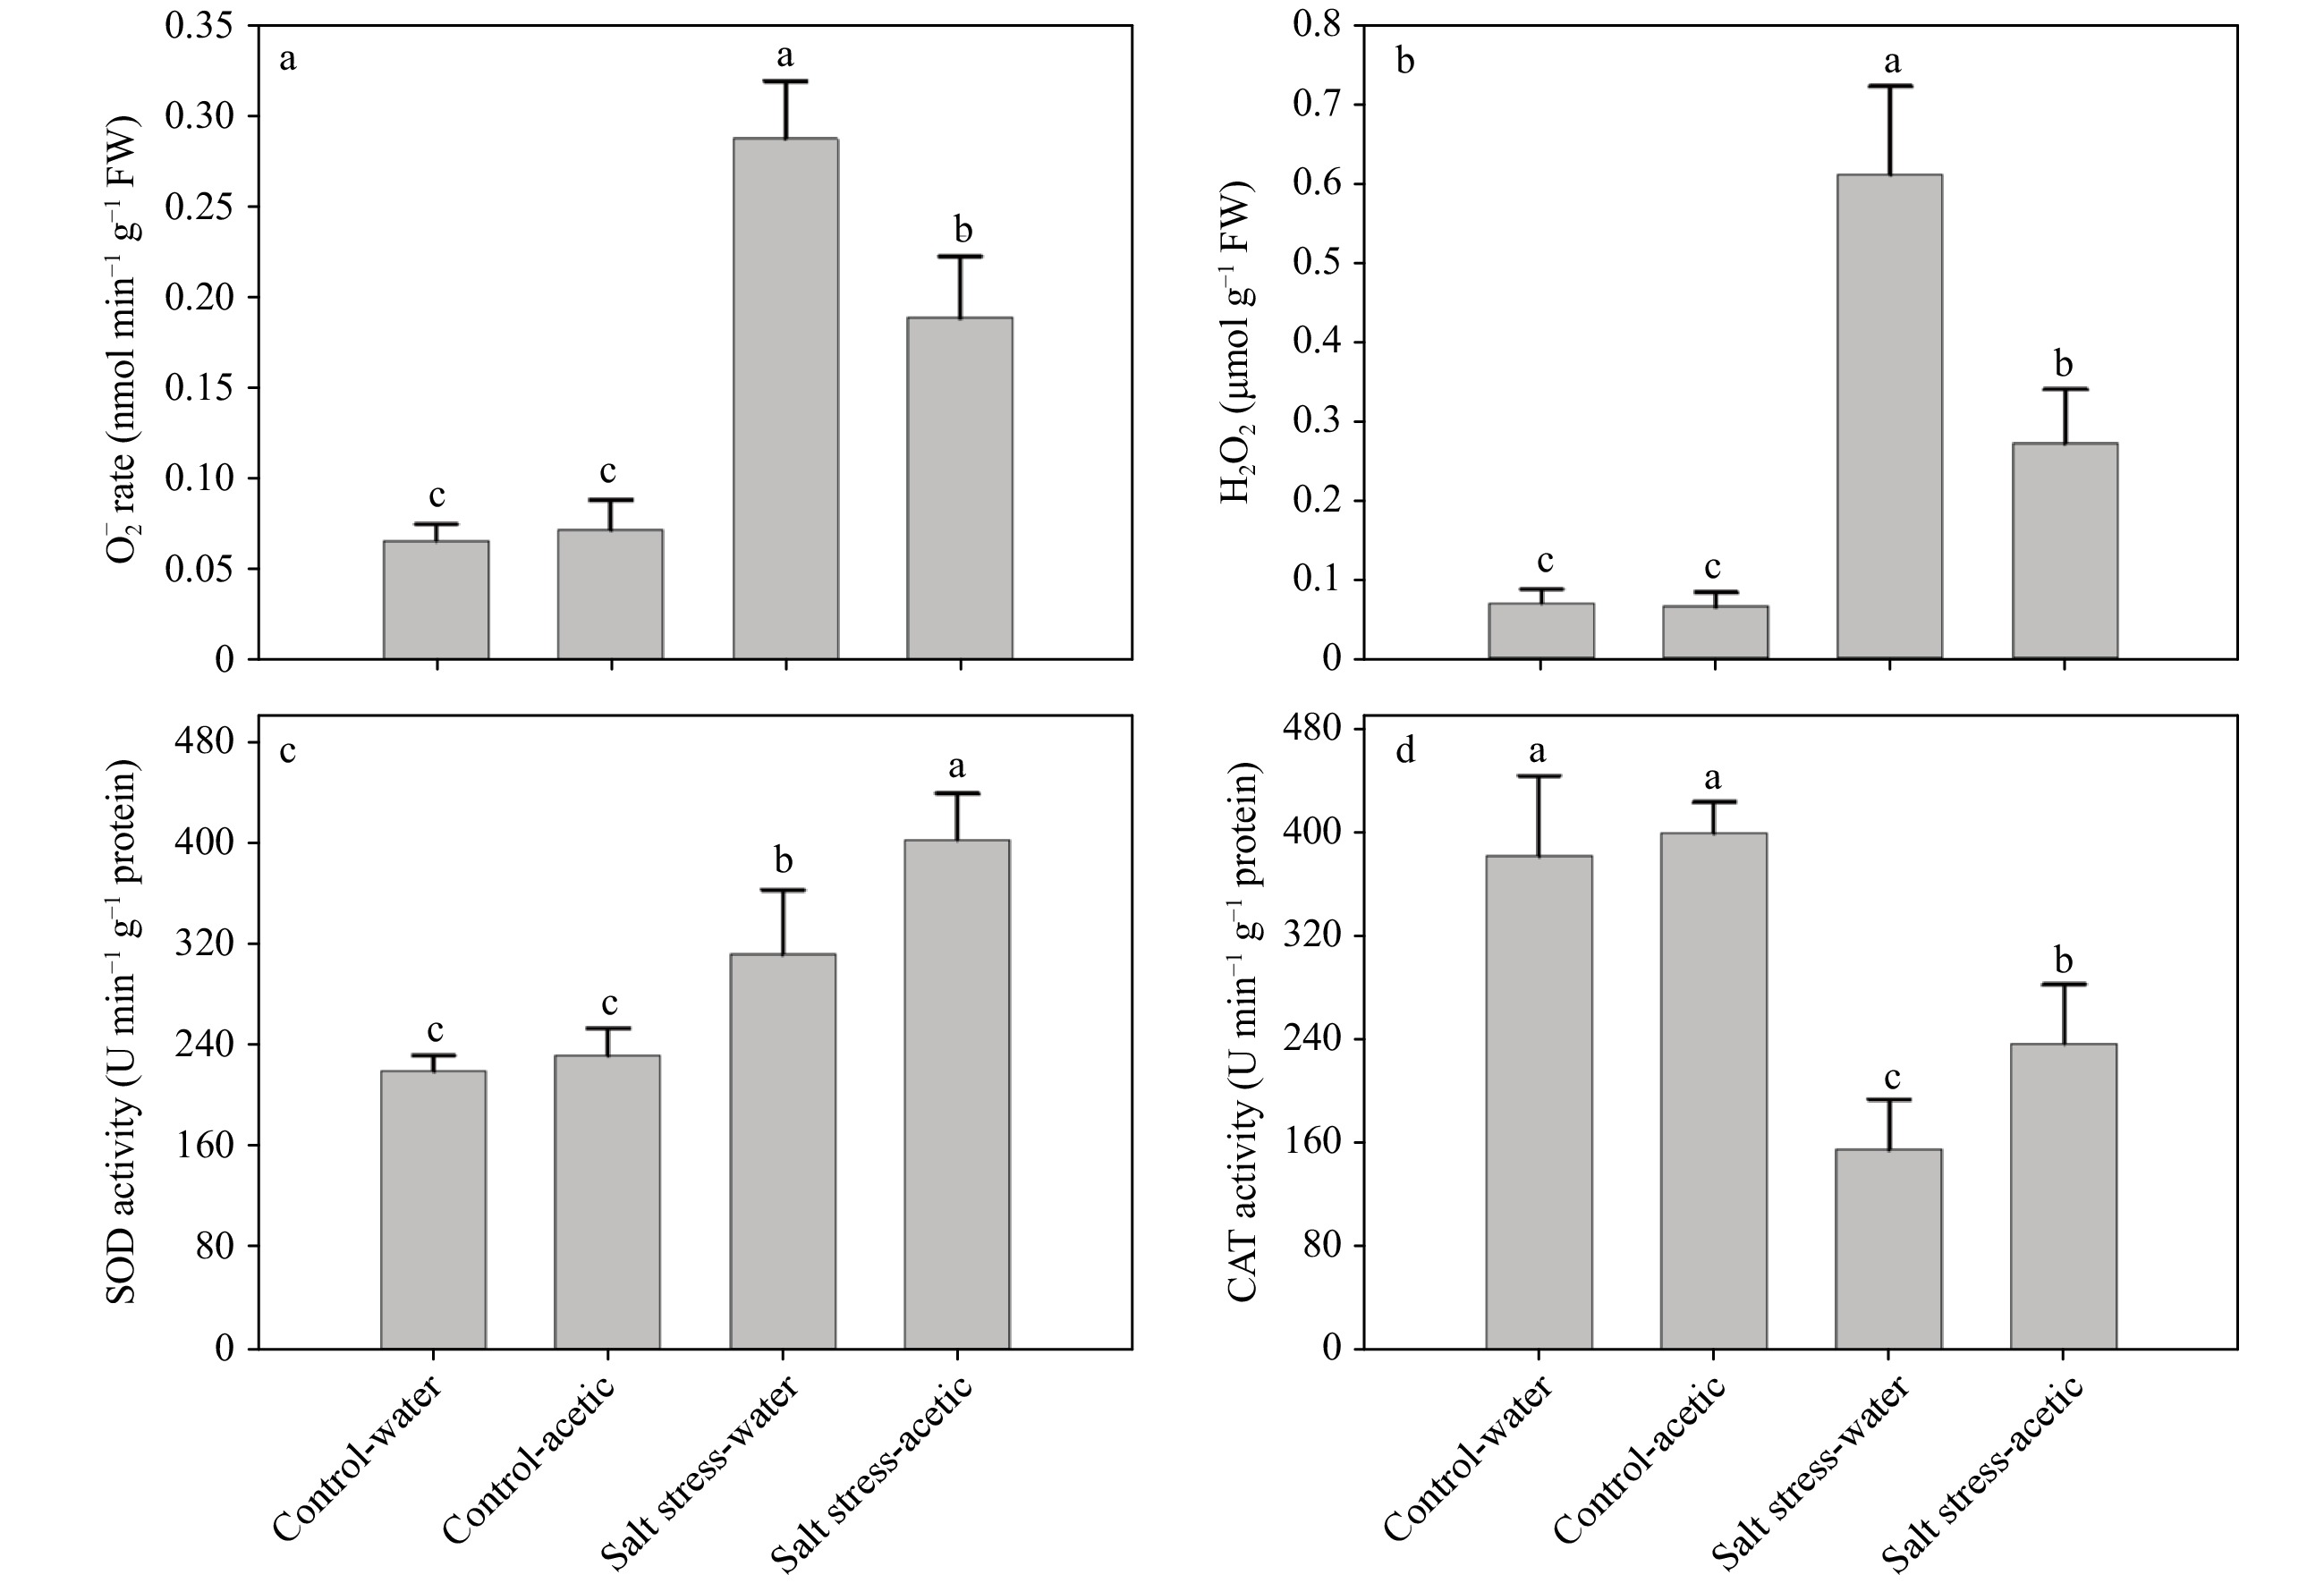
Figure 5. Effect of exogenous application of acetic acid on
${\rm O}_2^- $ production rate, and H2O2 content, and enzymatic antioxidant activity of SOD and CAT in leaves under control and salt stress conditions. Data were collected at 21 d of treatment. Bars labeled with different letters indicate significant differences among the treatments at a given day based on Fisher’s protected LSD test at P ≤ 0.05 level (n = 4). -
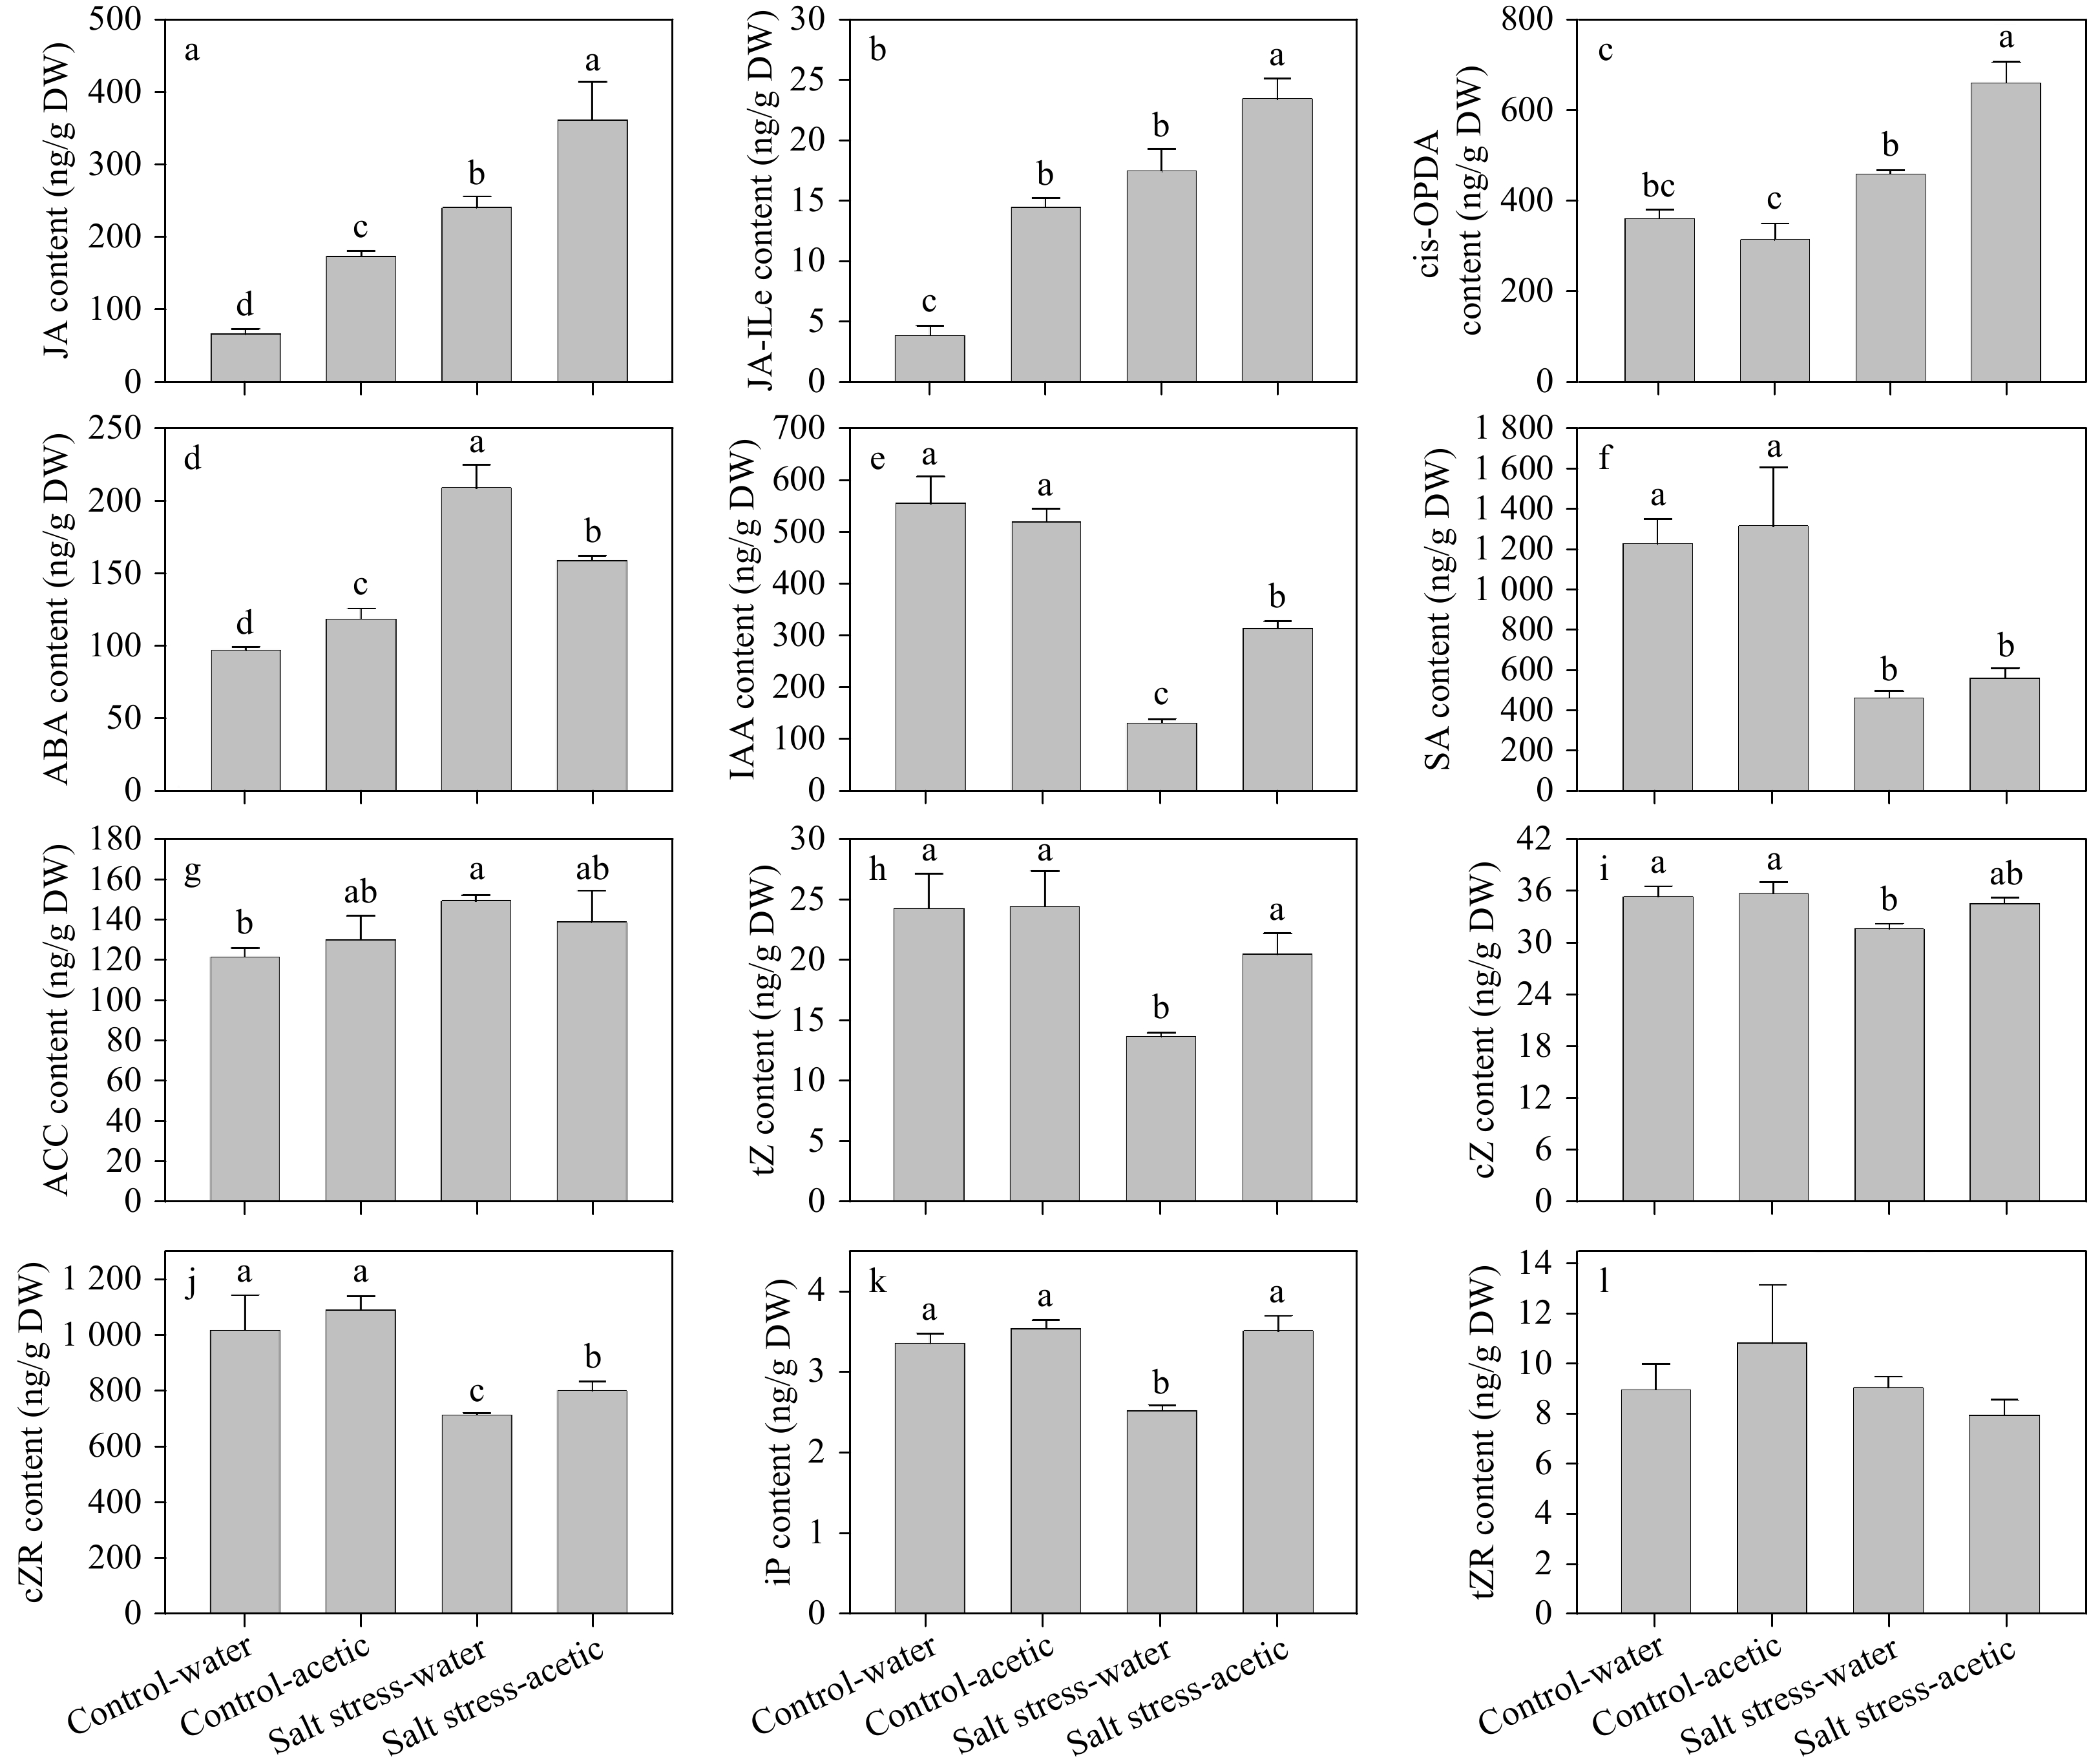
Figure 6. Effect of exogenous application of acetic acid on endogenous phytohormones, including three forms of jasmonate (JA, JA-ILe, and cis-OPDA), ABA, IAA, SA, ACC (an ethylene precursor), and five forms of cytokinins (tZ, cZ, tZR, cZR, and iP) in perennial ryegrass leaves under control and salt stress conditions. Bars labeled with different letters indicate significant differences among the treatments based on Fisher’s protected LSD test at P ≤ 0.05 level (n = 4).
-
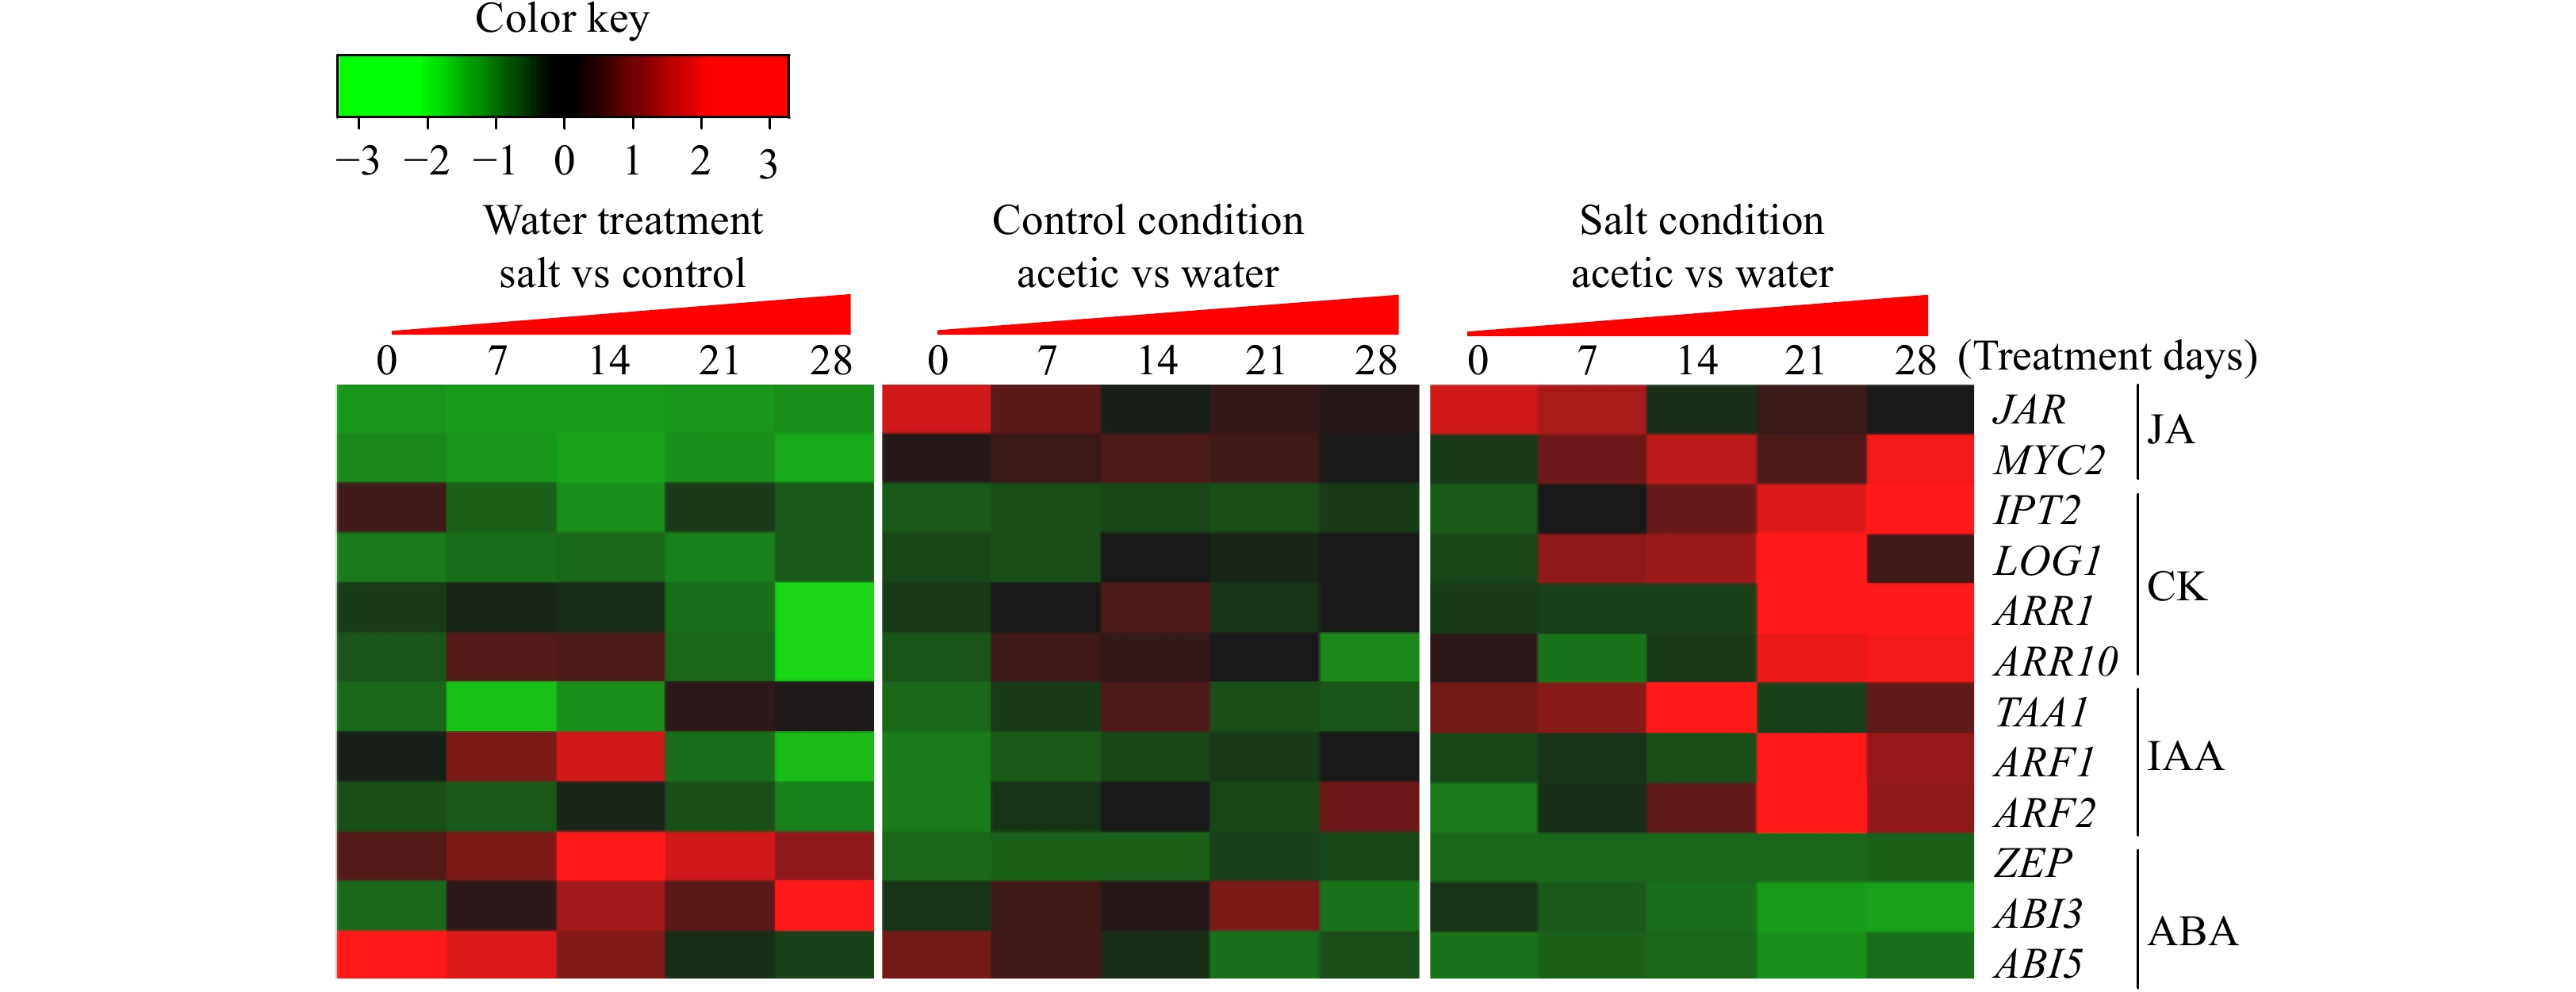
Figure 7. Heatmap of the transcription of metabolic and signaling genes involved in JA, CK, IAA, and ABA in perennial ryegrass under control and salt stress conditions.
-
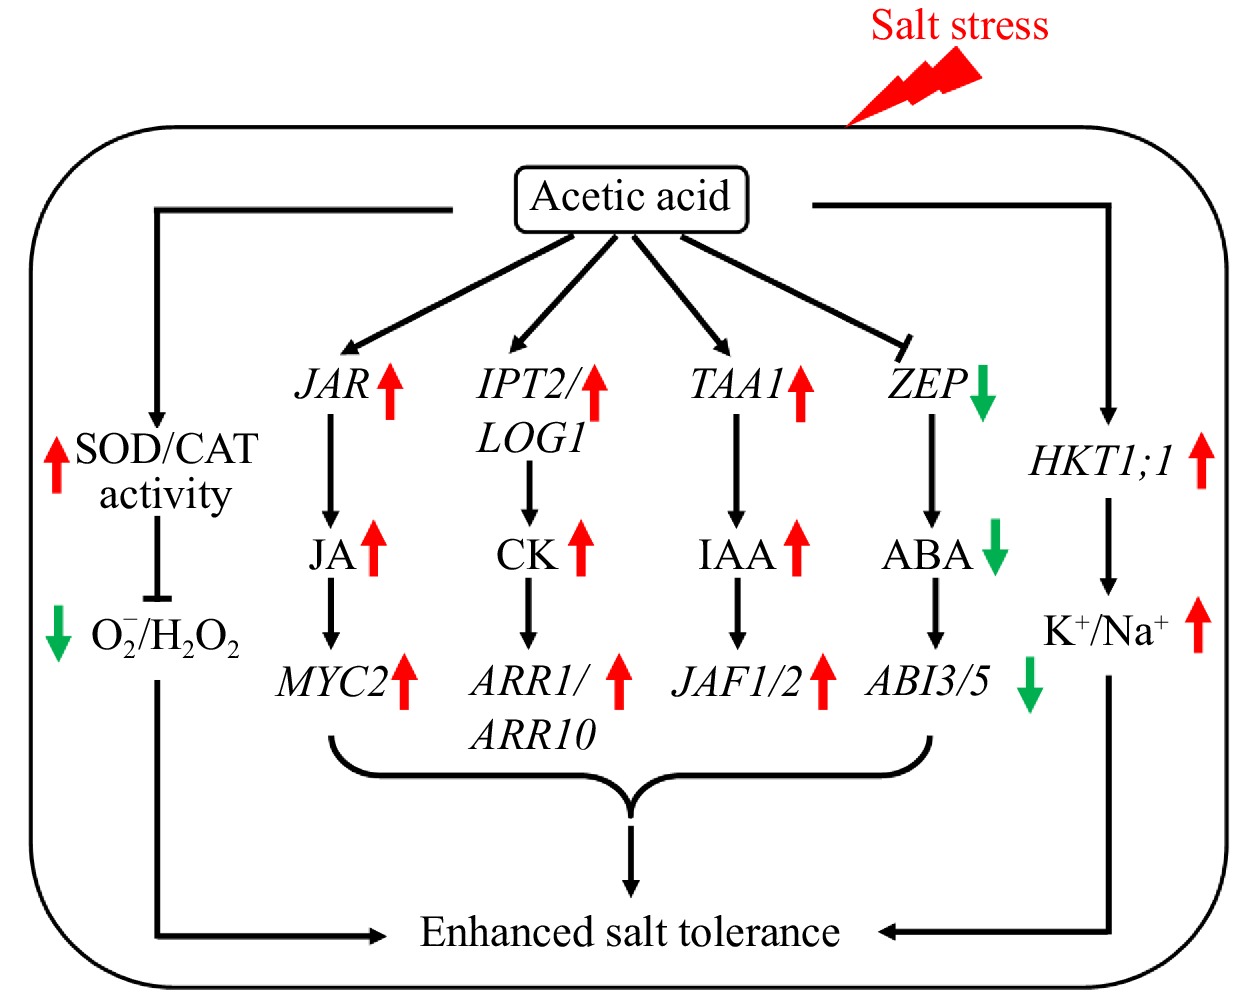
Figure 8. Proposed model for the regulation of salt tolerance by acetic acid in perennial ryegrass. Acetic acid affected multifaceted pathways to improve plant salt tolerance involving ionic transportation, ROS balance, and JA, CK, IAA, and ABA biosynthesis and signal transduction.
Figures
(8)
Tables
(0)