-
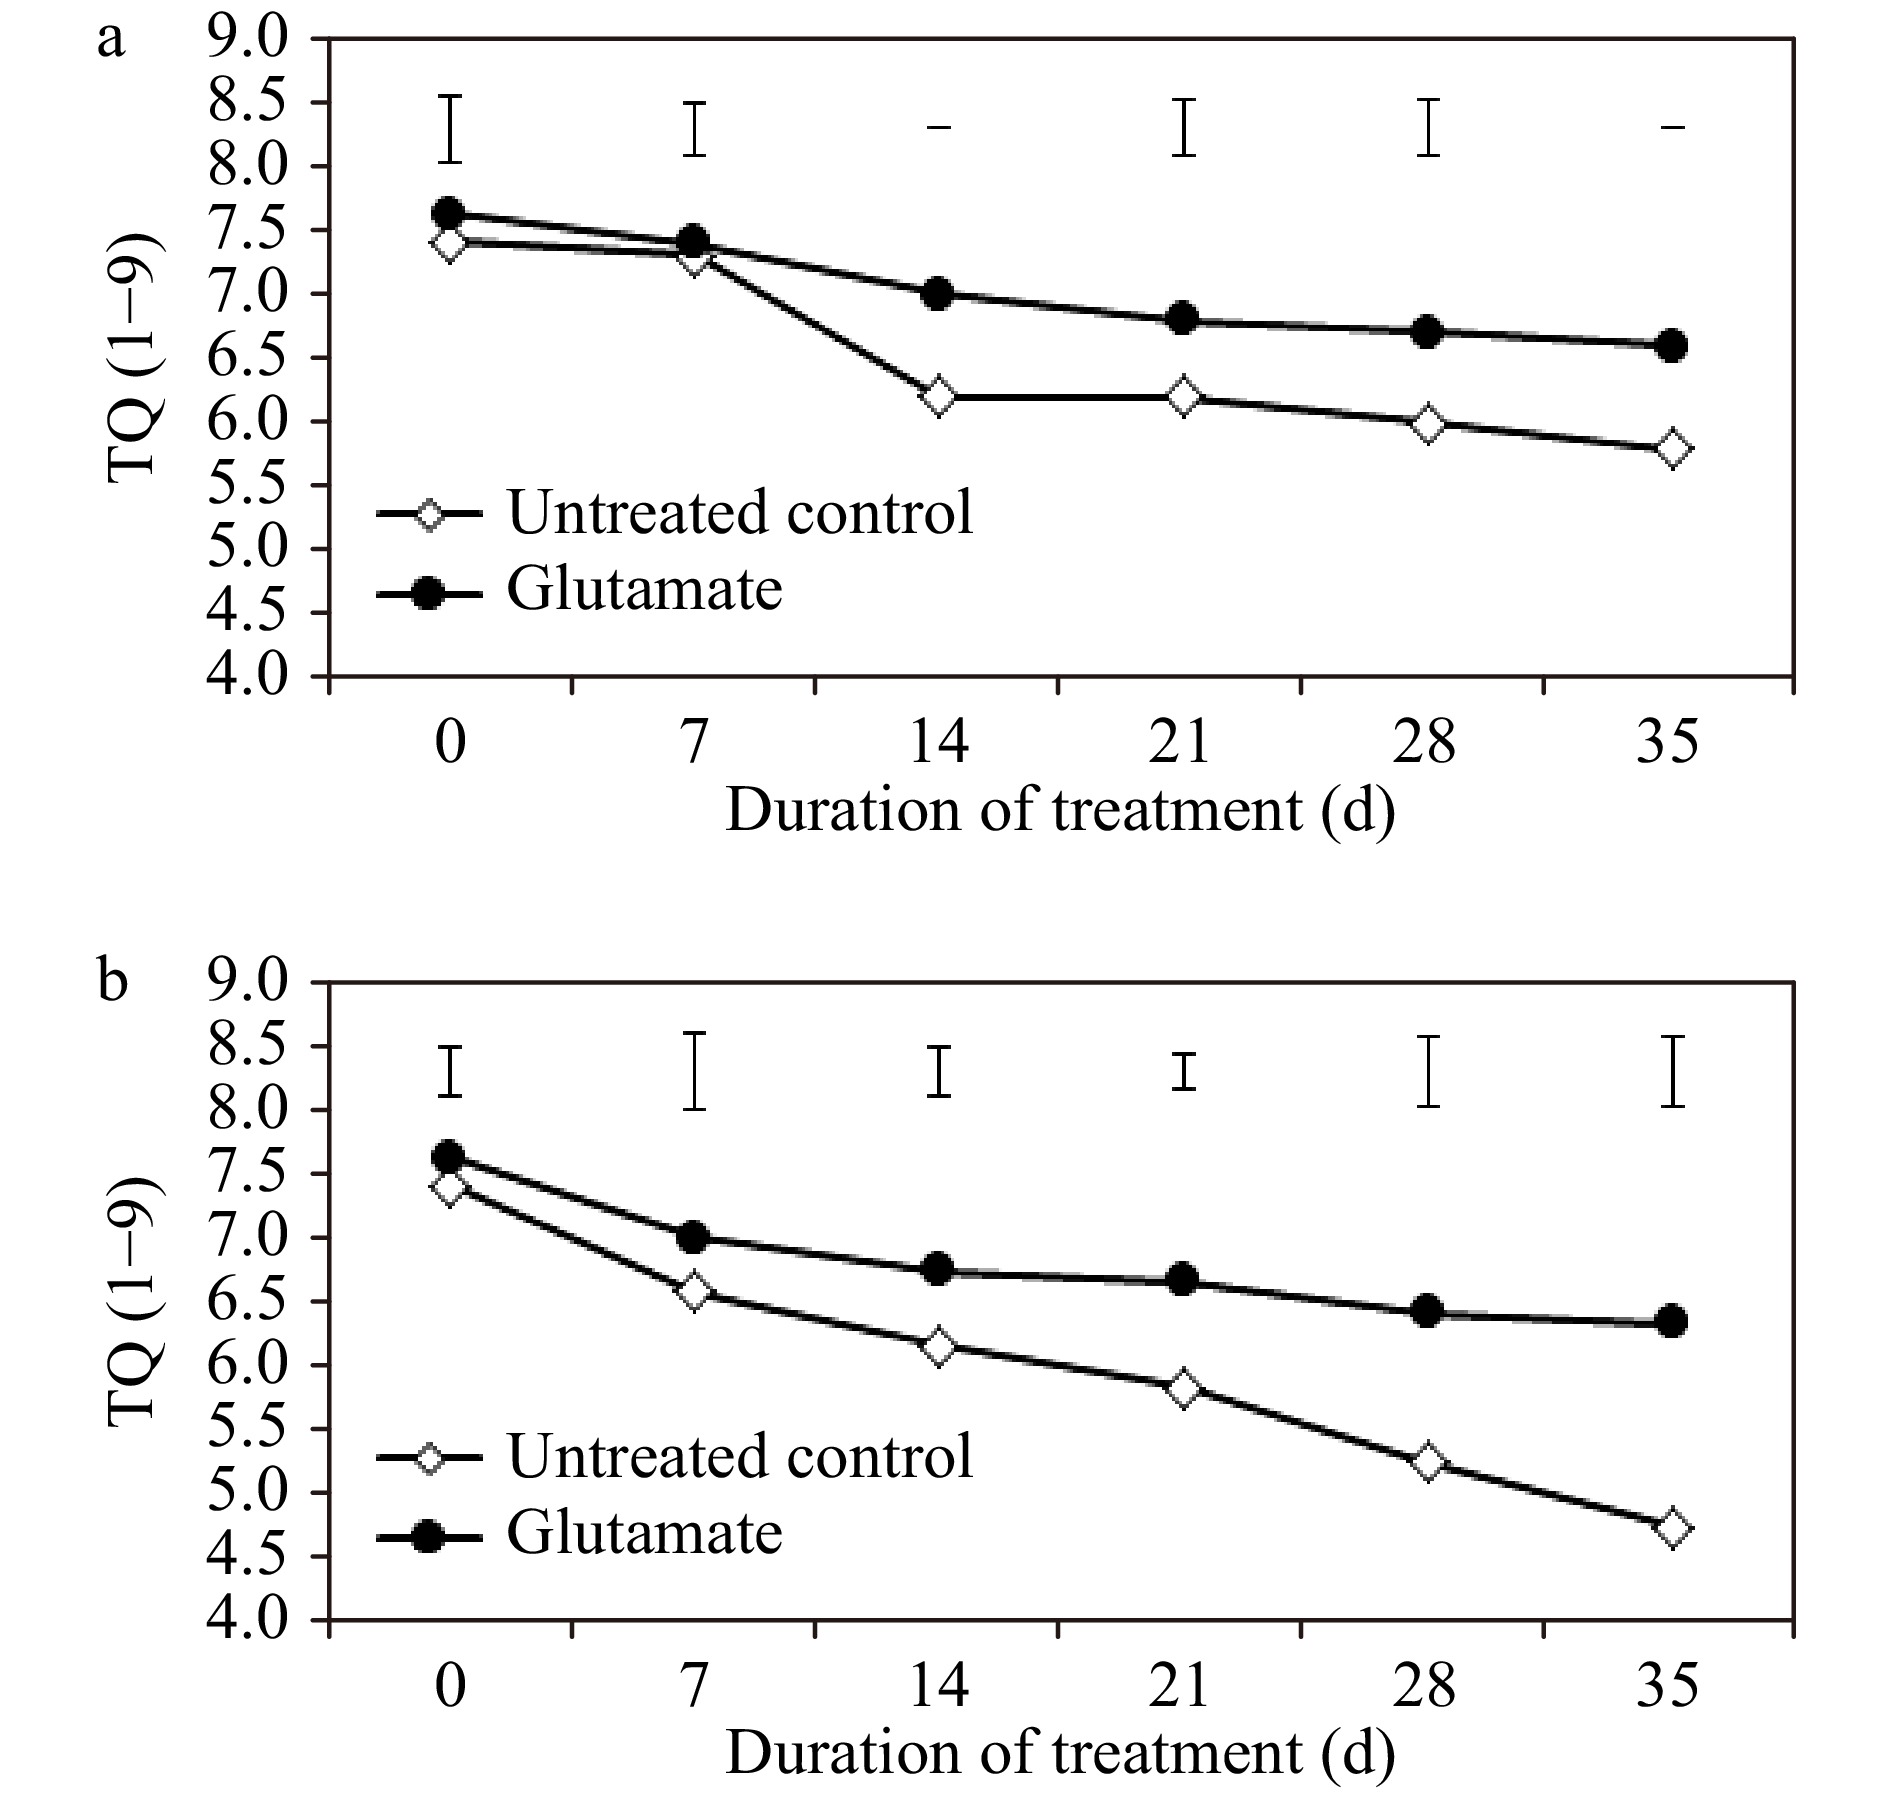
Figure 1. Numerical turf quality evaluations ranging from 1 through 9 for experimental plants treated with glutamate or untreated controls under non-stress temperature conditions (a) or heat stress (b). Error bars over each data point were used to separate means between non-stress and heat stress temperature conditions for each given date and are delineated by Fisher’s protected least significant difference (LSD) test applied at p < 0.05.
-
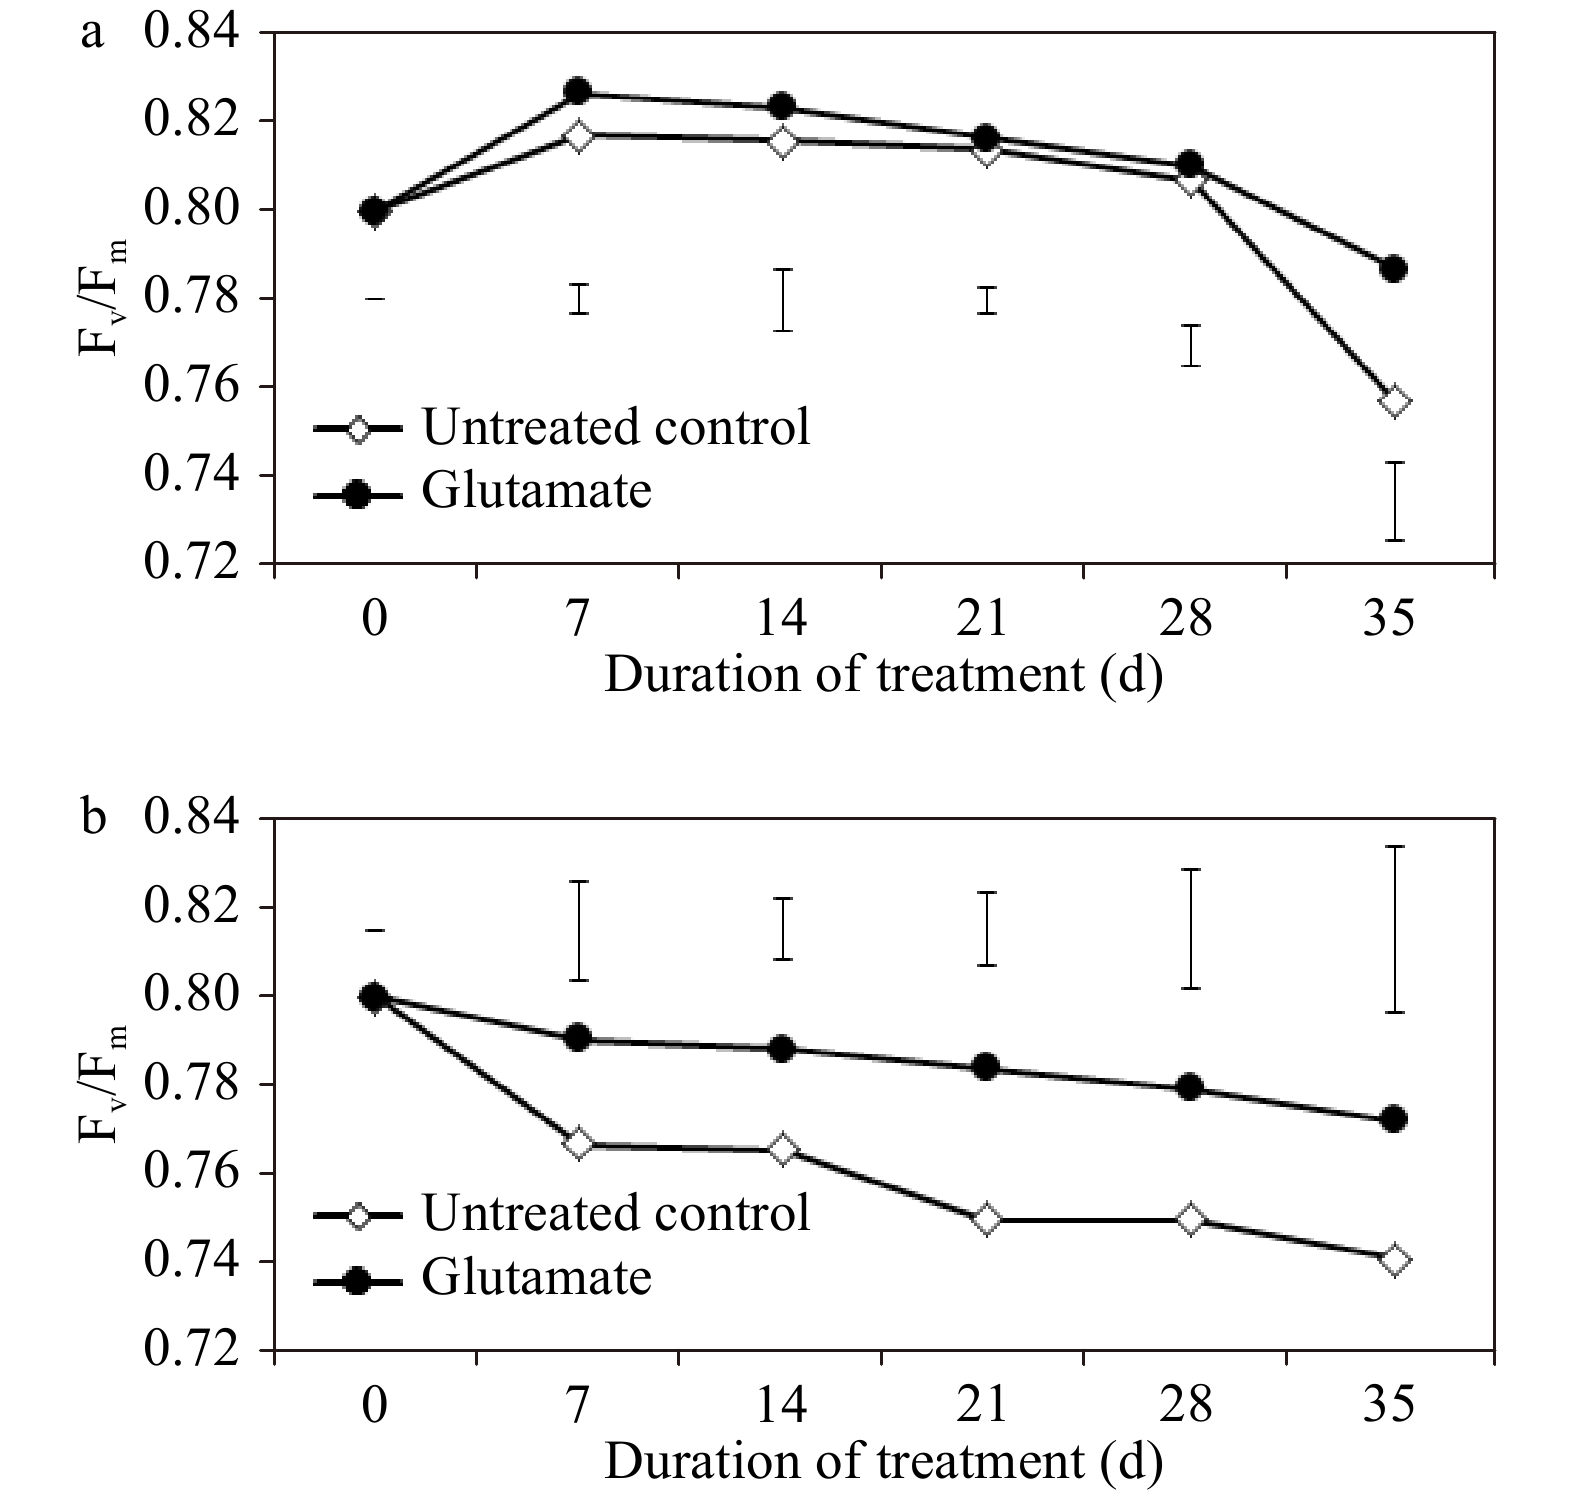
Figure 2. Photochemical efficiency for experimental plants treated with glutamate or untreated controls under non-stress temperature conditions (a) or heat stress (b). Error bars over each data point were used to separate means between non-stress and heat stress temperature conditions for each given date and are delineated by Fisher’s protected least significant difference (LSD) test applied at p < 0.05.
-
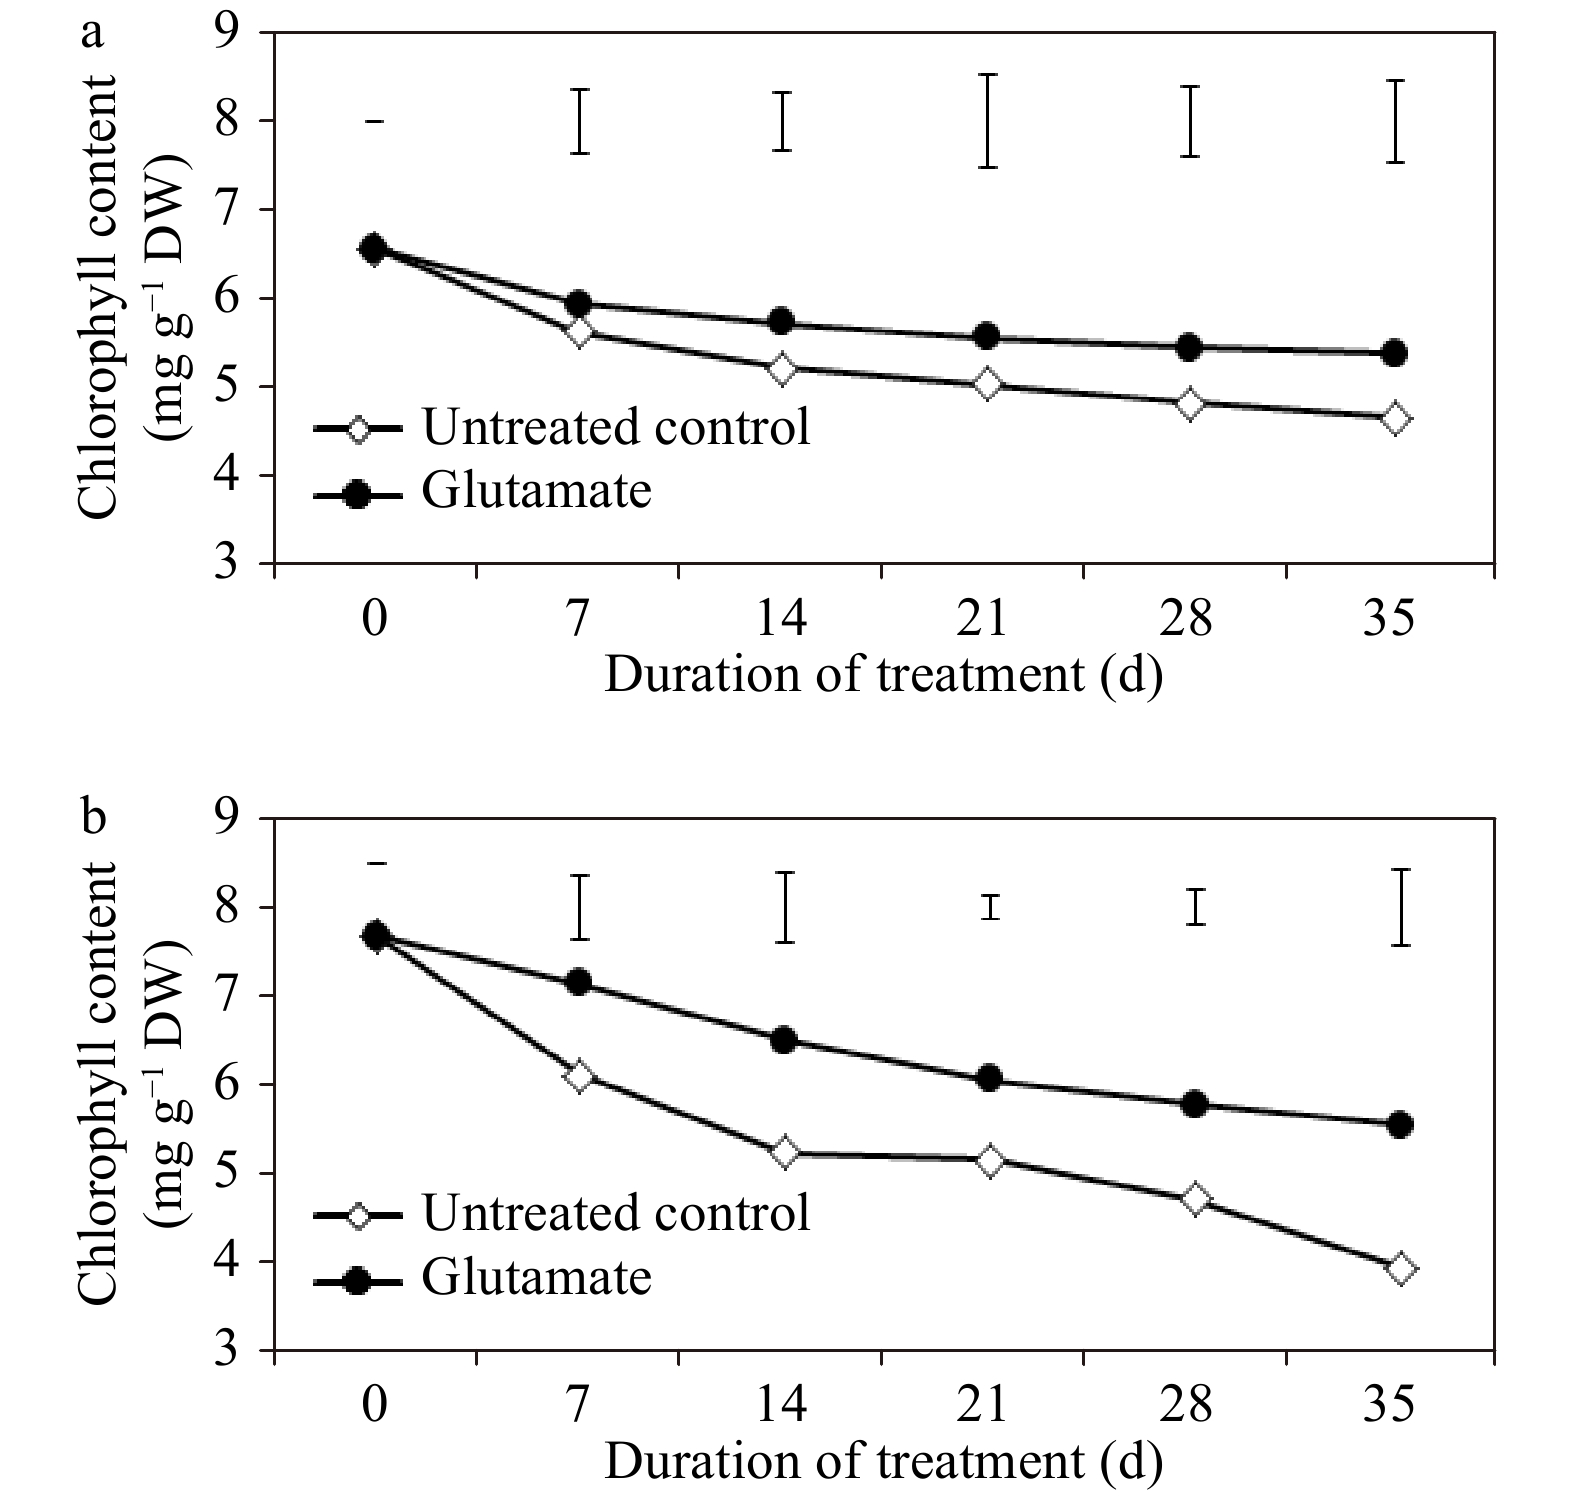
Figure 3. Chlorophyll content for experimental plants treated with glutamate or untreated controls under non-stress temperature conditions (a), or heat stress (b). Error bars over each data point were used to separate means between non-stress and heat stress temperature conditions for each given date and are delineated by Fisher’s protected least significant difference (LSD) test applied at p < 0.05.
-
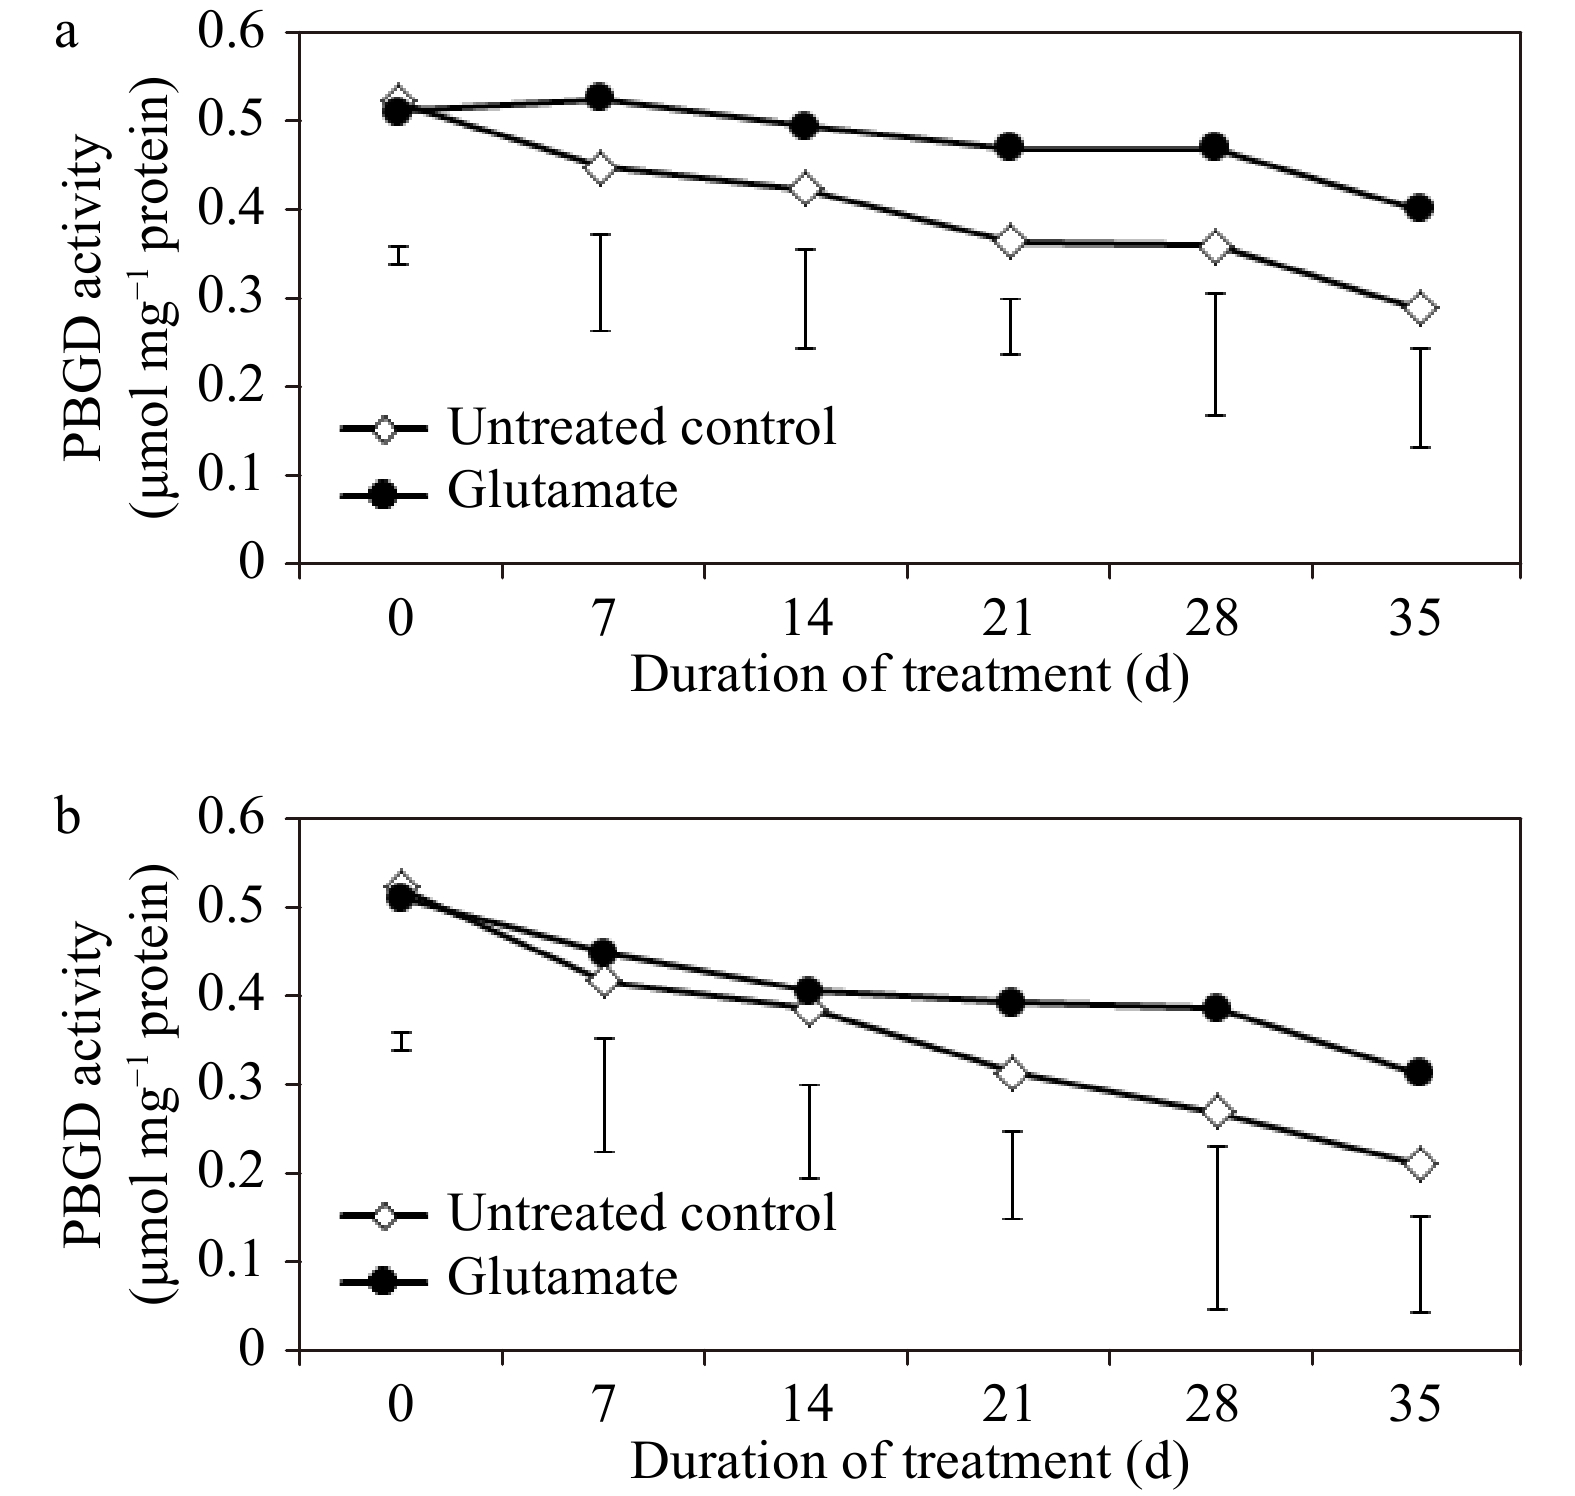
Figure 4. Porphobilinogen deaminase (PBGD) enzyme activity for experimental plants treated with glutamate or untreated controls under non-stress temperature conditions (a) or heat stress (b). Error bars over each data point were used to separate means between non-stress and heat stress temperature conditions for each given date and are delineated by Fisher’s protected least significant difference (LSD) test applied at p < 0.05.
-
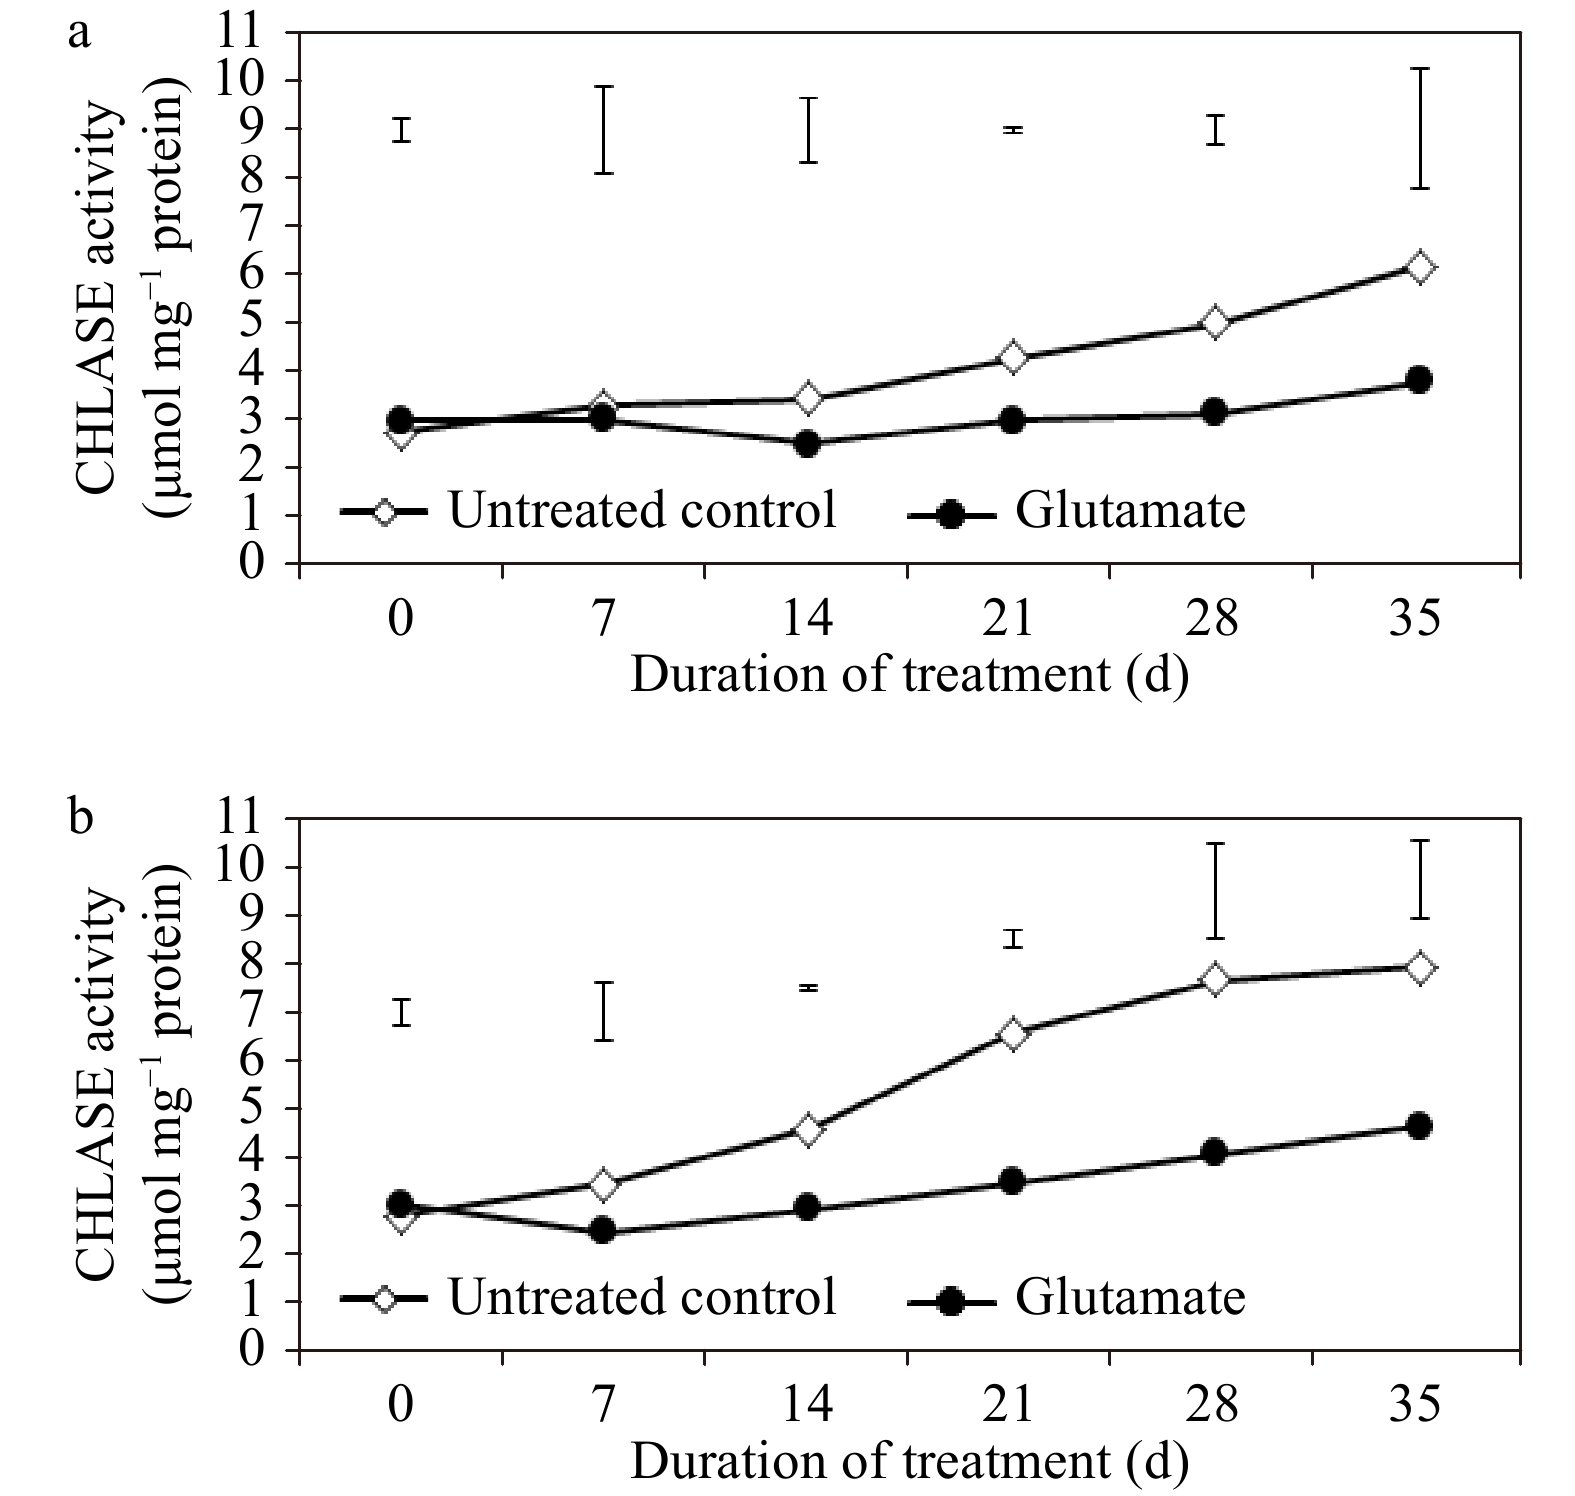
Figure 5. Chlorophyllase (CHLASE) enzyme activity for experimental plants treated with glutamate or untreated controls under non-stress temperature conditions (a) or heat stress (b). Error bars over each data point were used to separate means between non-stress and heat stress temperature conditions for each given date and are delineated by Fisher’s protected least significant difference (LSD) test applied at p < 0.05.
-
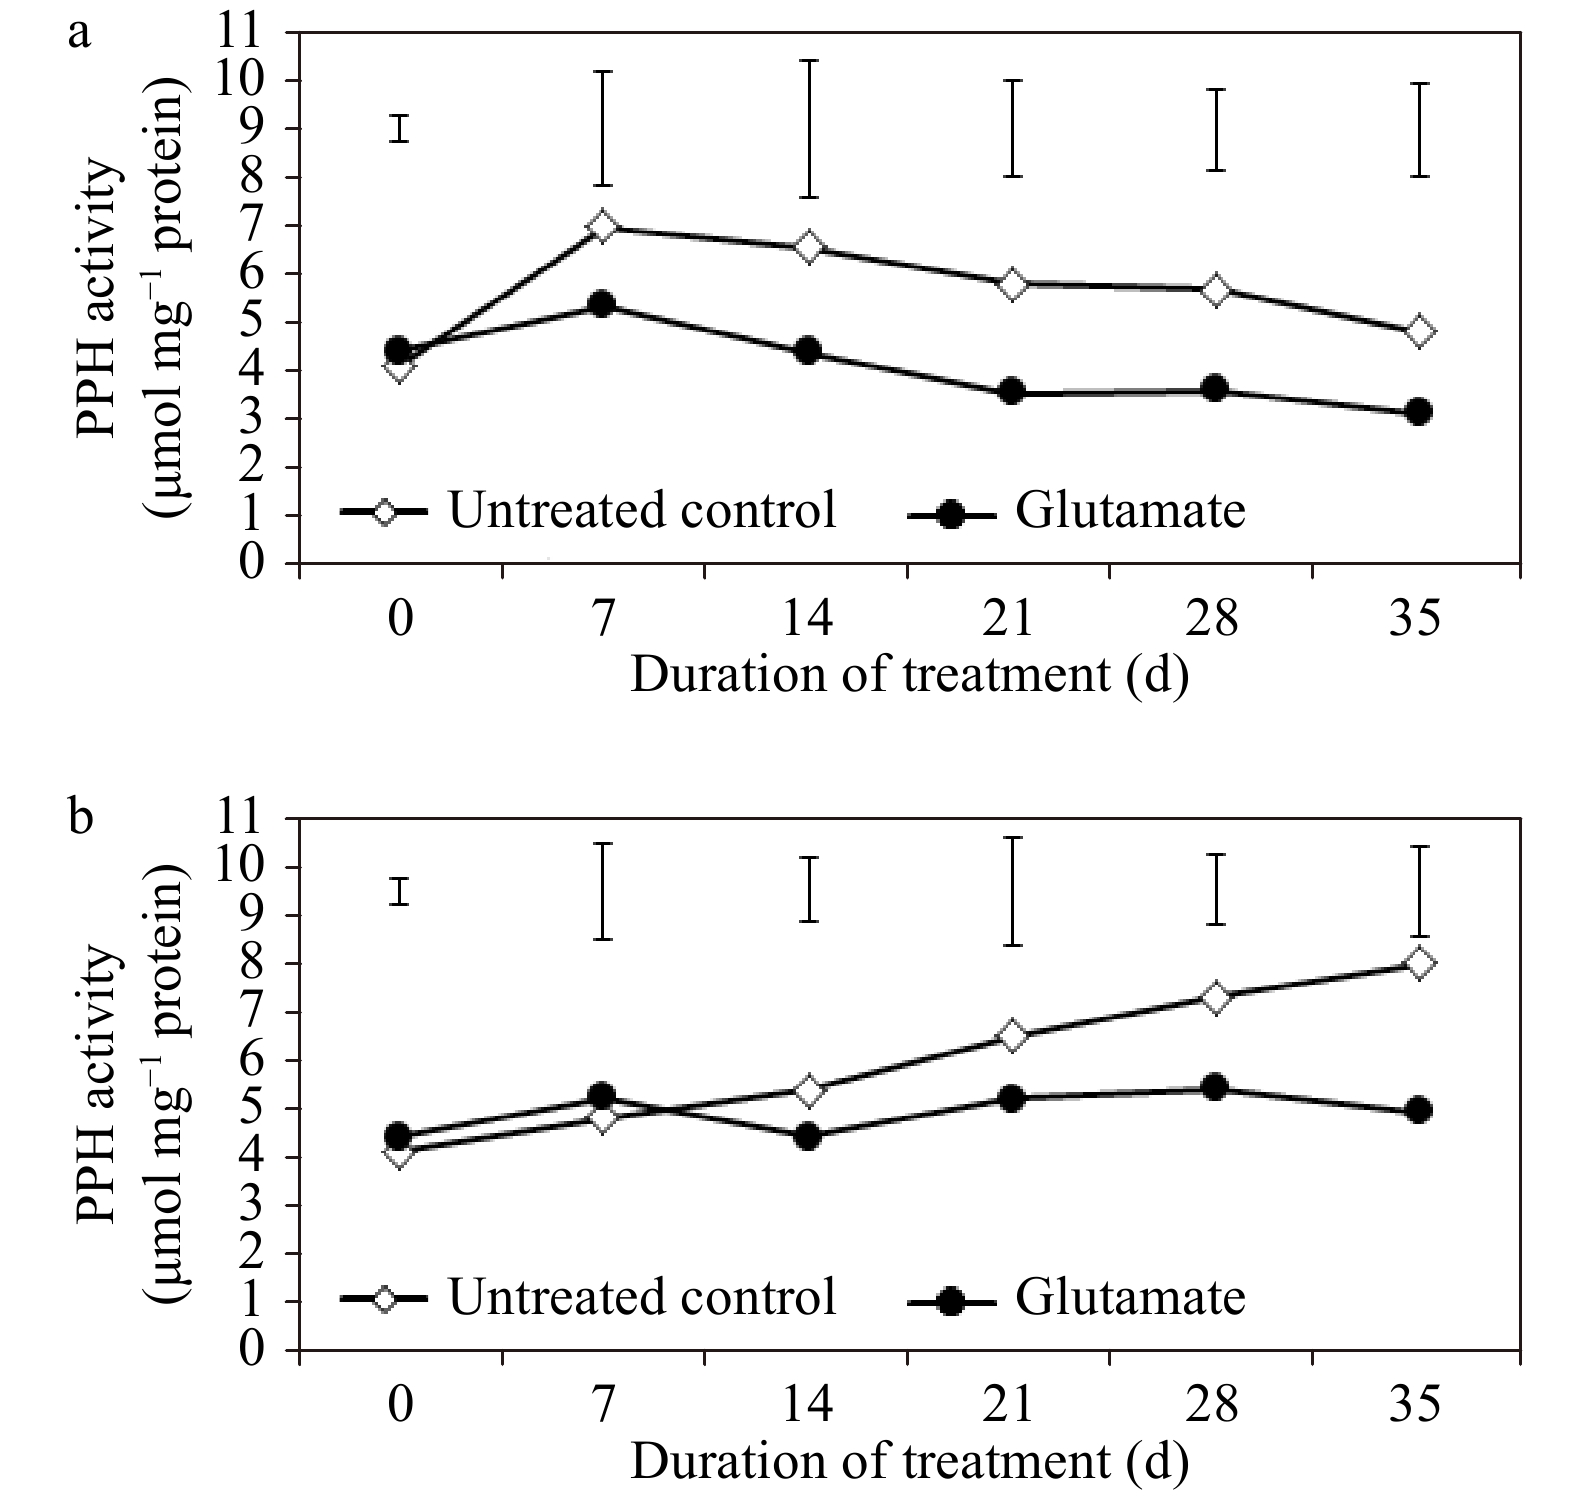
Figure 6. Pheophytinase (PPH) enzyme activity for experimental plants treated with glutamate or untreated controls under non-stress temperature conditions (a) or heat stress (b). Error bars over each data point were used to separate means between non-stress and heat stress temperature conditions for each given date and are delineated by Fisher’s protected least significant difference (LSD) test applied at p < 0.05.
-
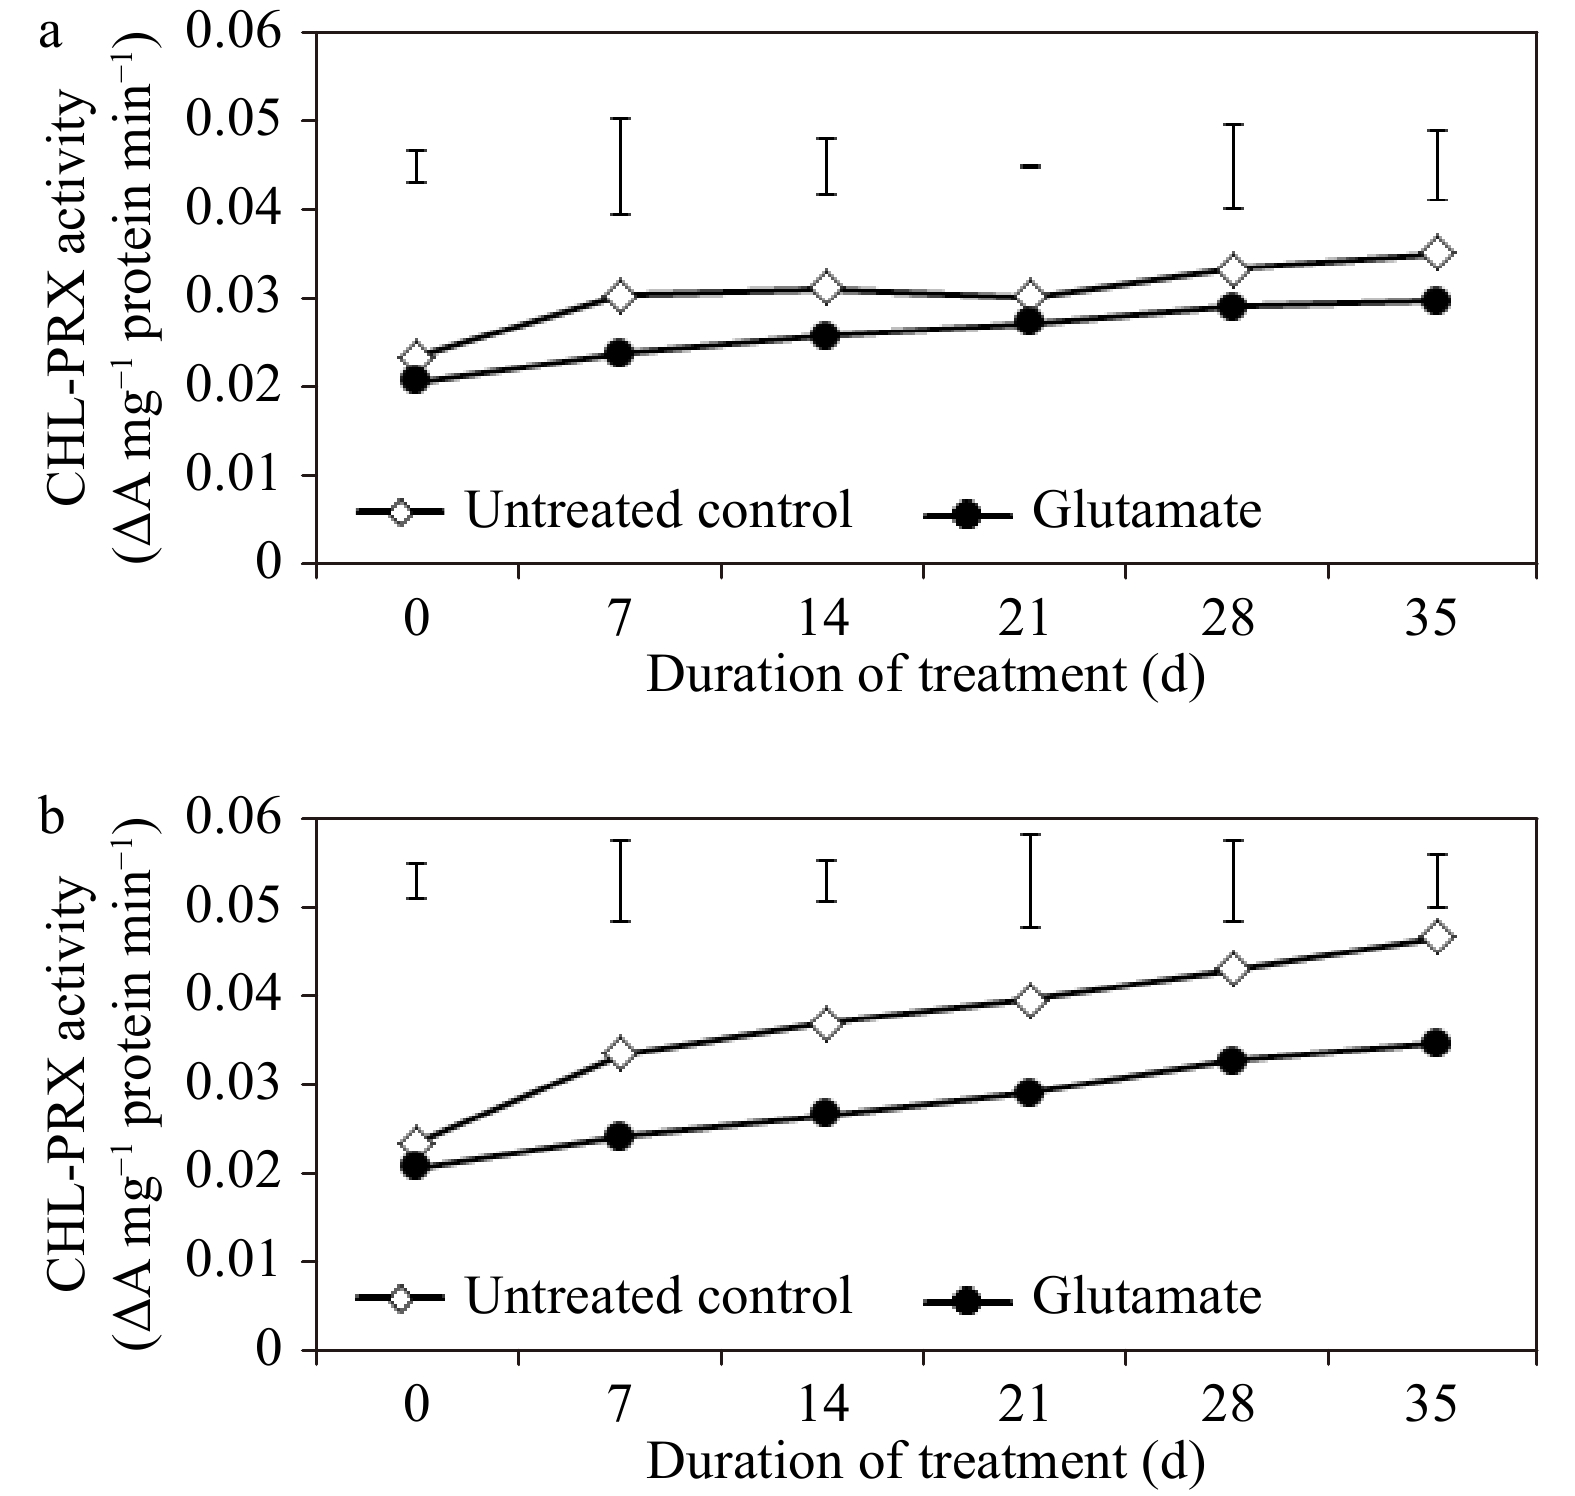
Figure 7. Chlorophyll-degrading peroxidase (CHL-PRX) enzyme activity for experimental plants treated with glutamate or untreated controls under non-stress temperature conditions (a) or heat stress (b). Error bars over each data point were used to separate means between non-stress and heat stress temperature conditions for each given date and are delineated by Fisher’s protected least significant difference (LSD) test applied at p < 0.05.
-
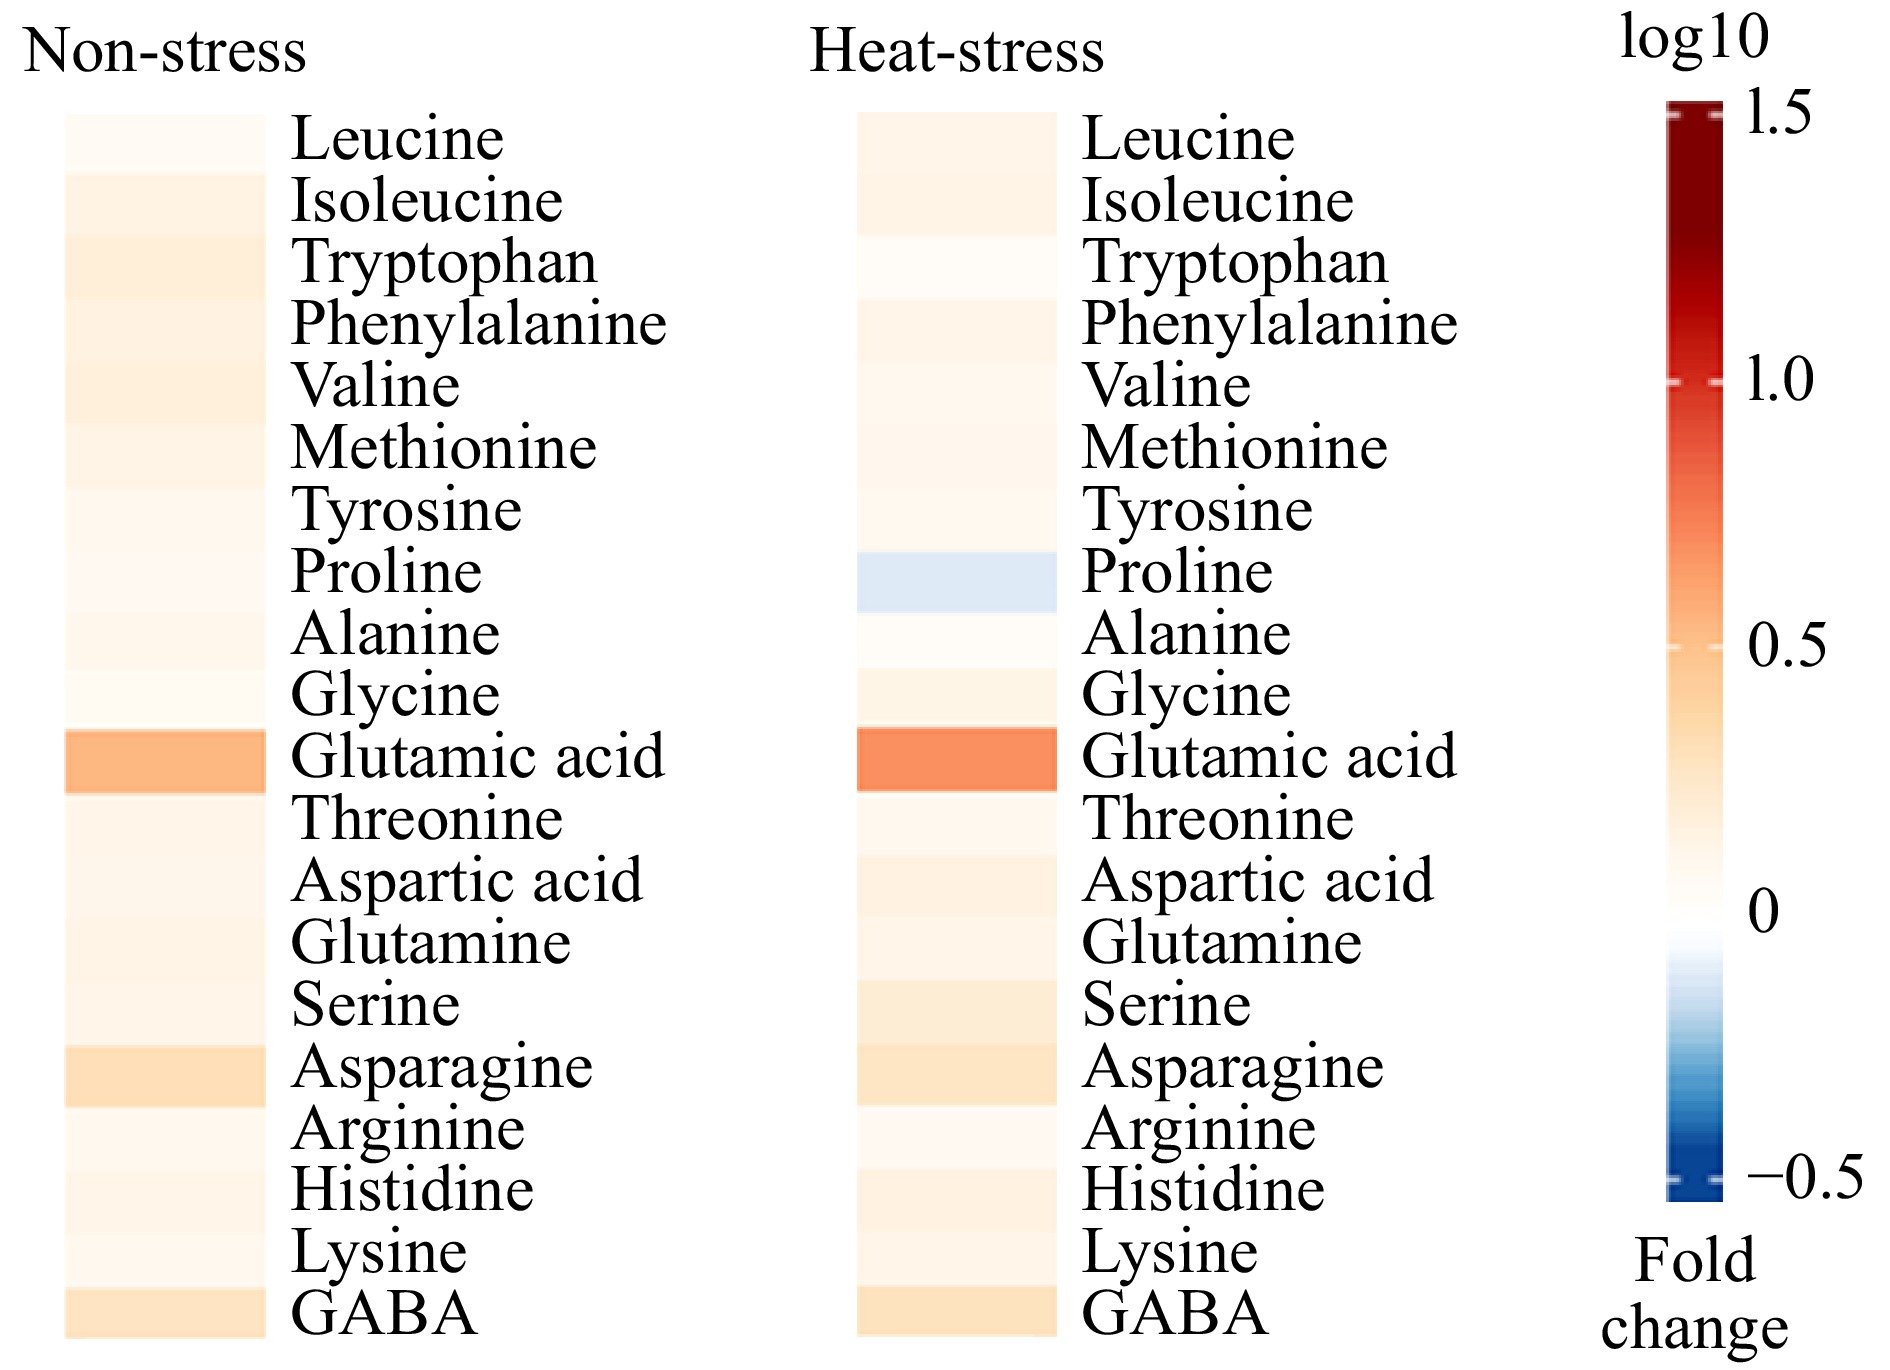
Figure 8. Heat map illustrating the general trend of fold-changes in the content of various amino acids inresponse to glutamate treatment in creeping bentgrass under non-stress or heat stress temperatureconditions. Each horizontal bar represents the fold-change in content for an individual amino acid inglutamate-treated plants relative to untreated plants.
-
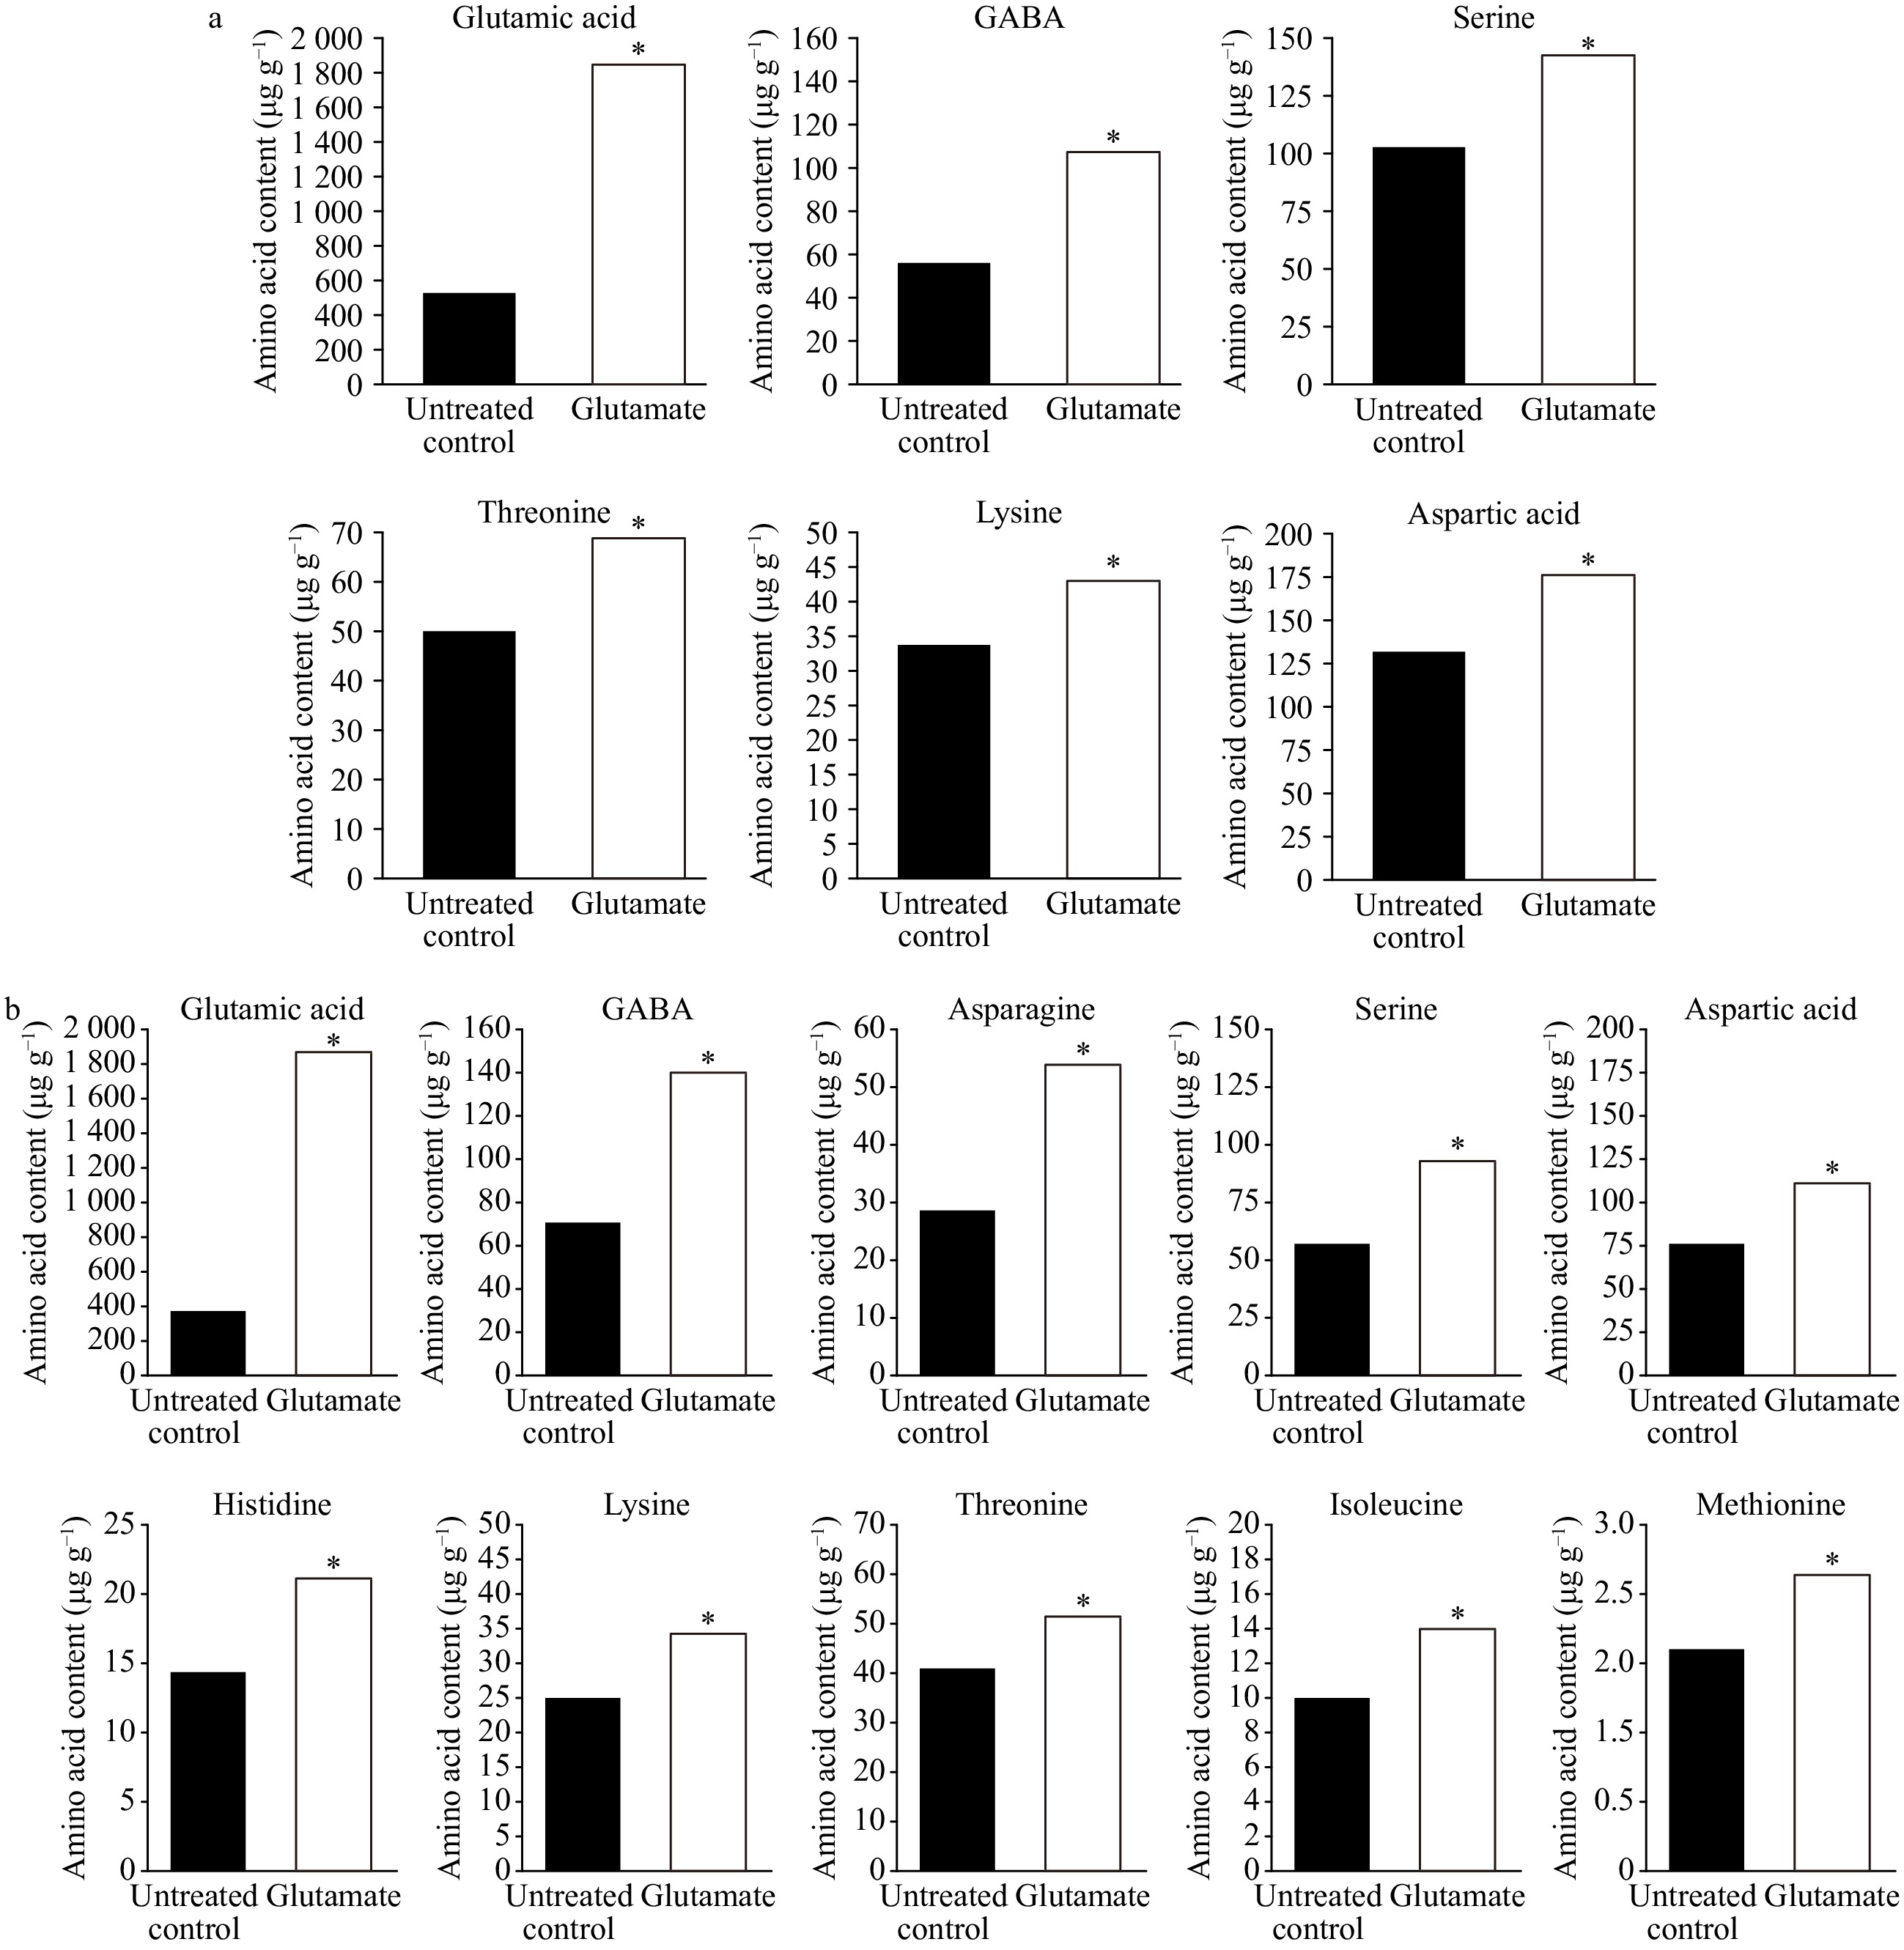
Figure 9. Content of amino acids significantly affected by glutamate for experimental plants under non-stress temperature conditions (a) or at 35 d heat stress (b). Asterisks over data bars represent significant differences between the glutamate treatment and untreated control and are delineated by Fisher’s protected least significant difference (LSD) test, applied at p < 0.05.
-
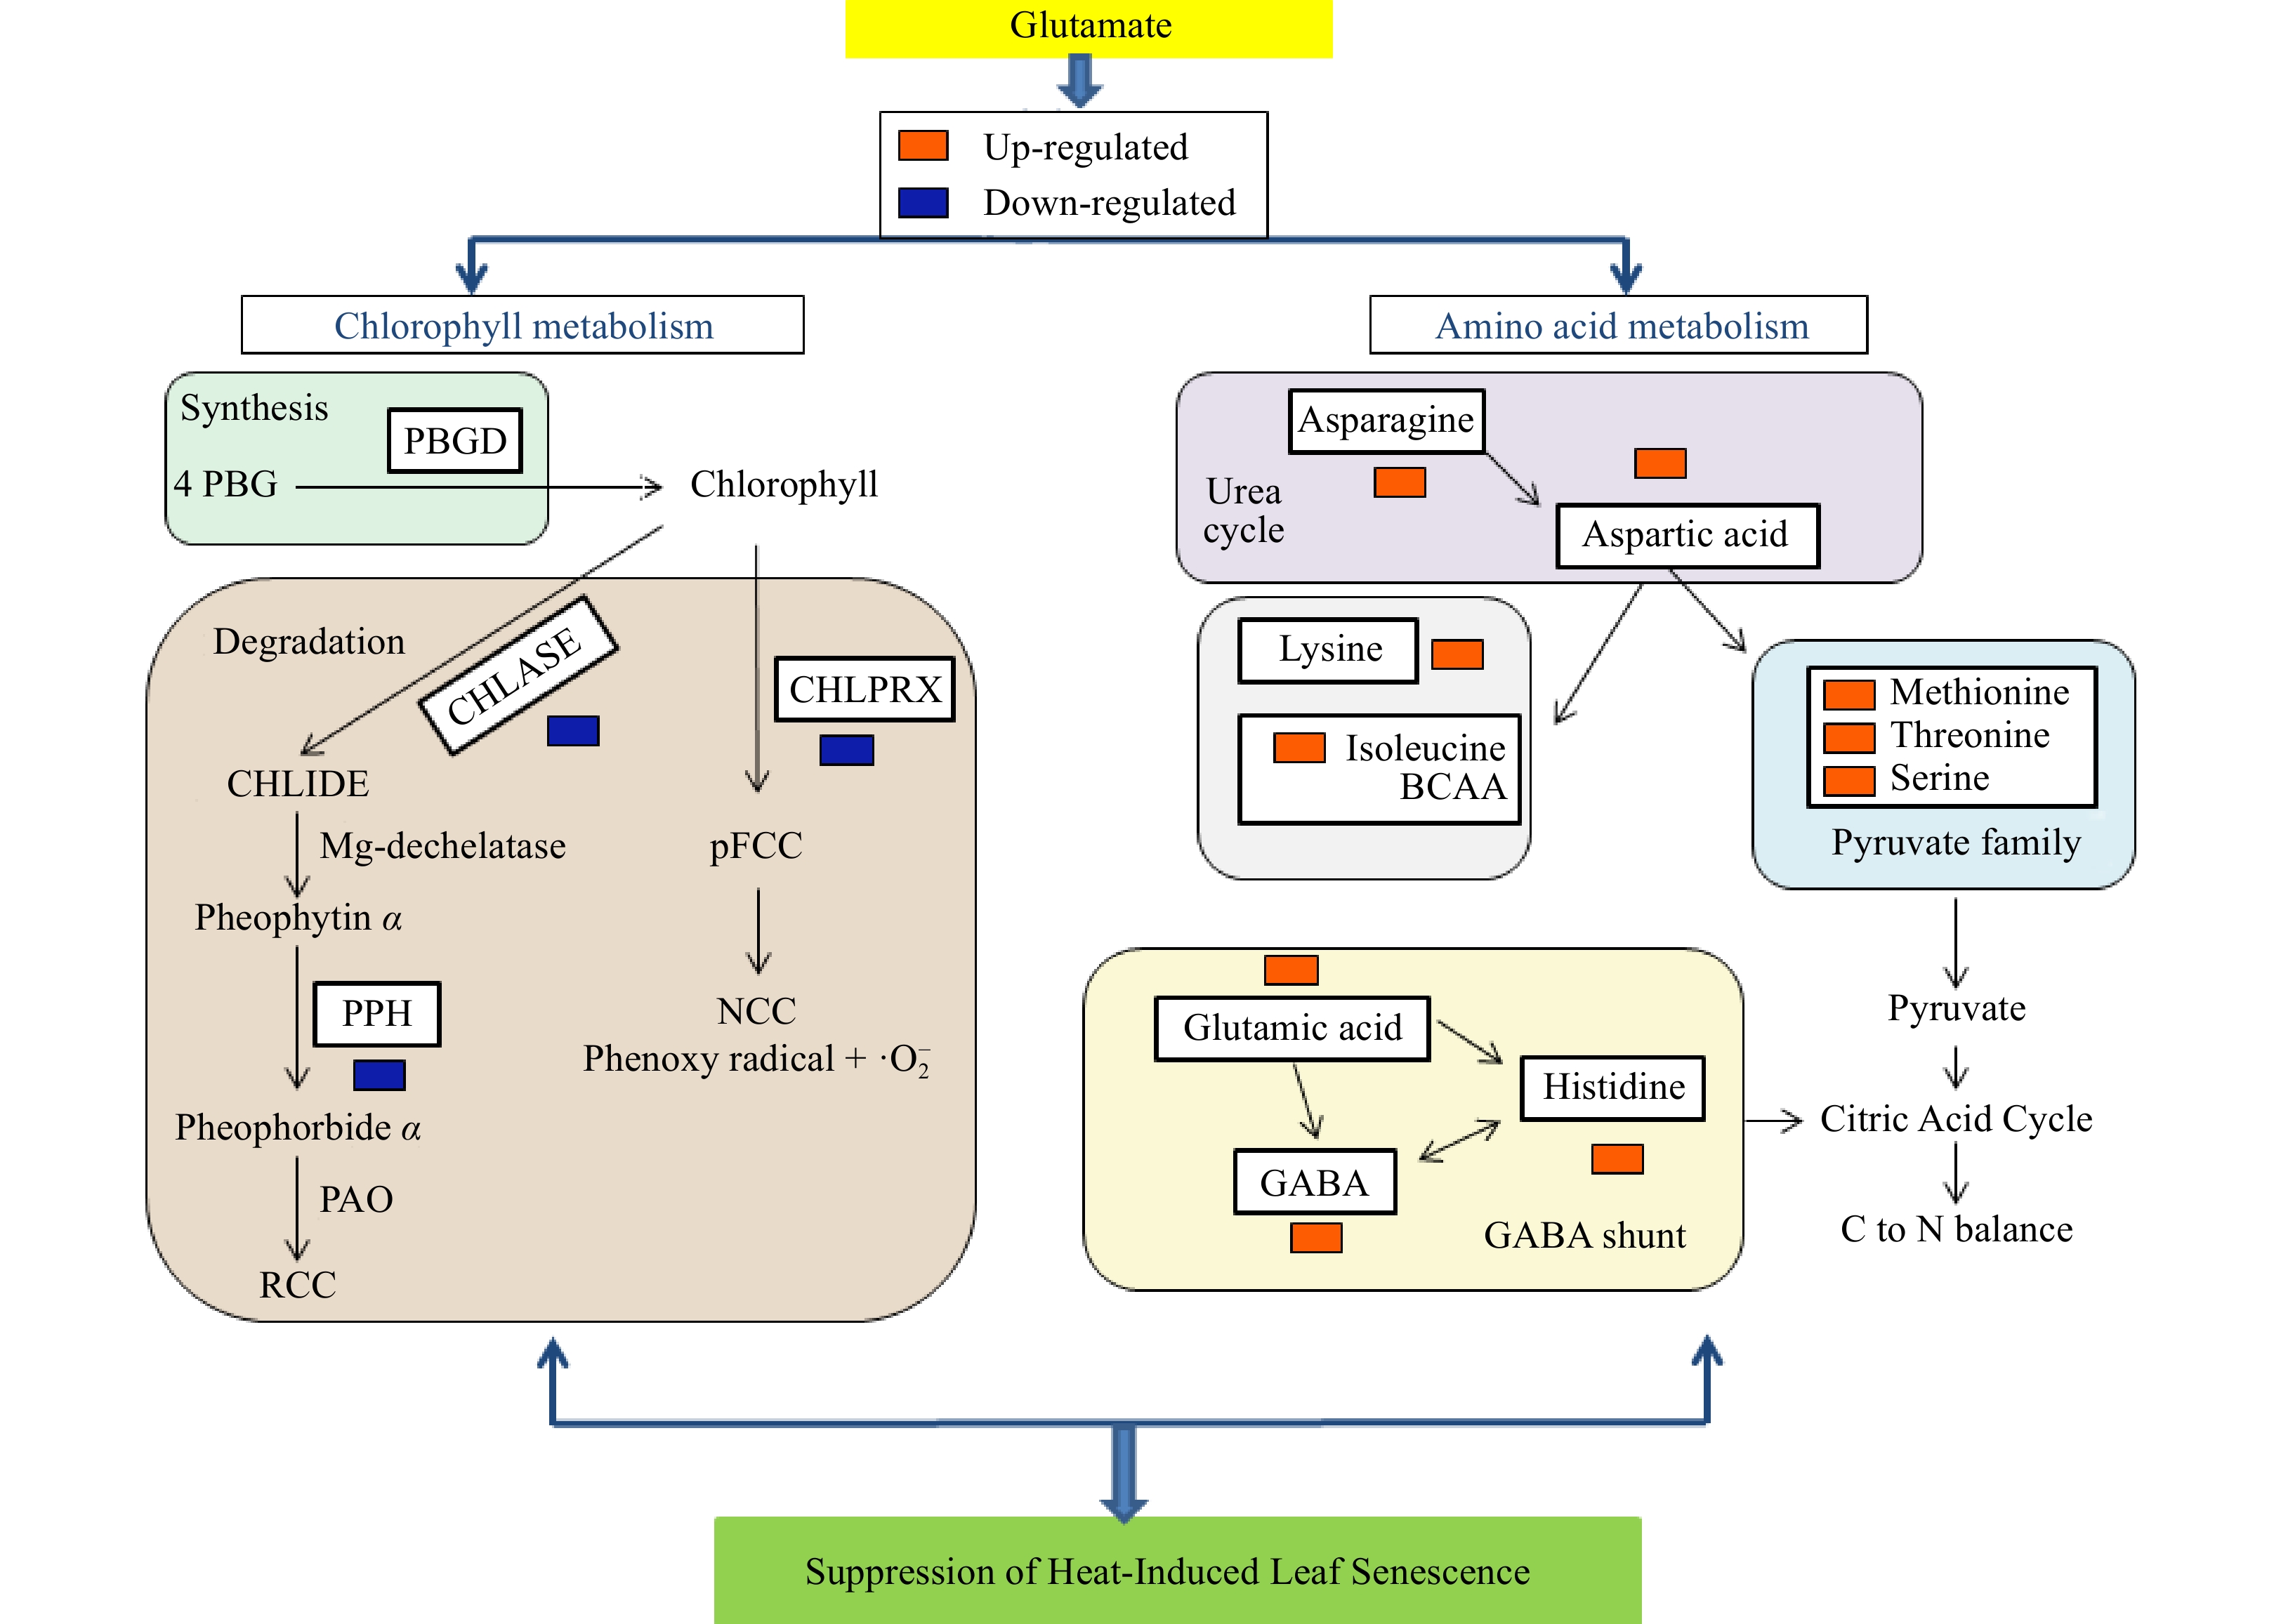
Figure 10. Visual pathway illustrating glutamate-mediated regulation of Chl synthesis and degradation and amino acid metabolic pathways for the abatement of heat-induced leaf senescence in creeping bentgrass.
Figures
(10)
Tables
(0)