-
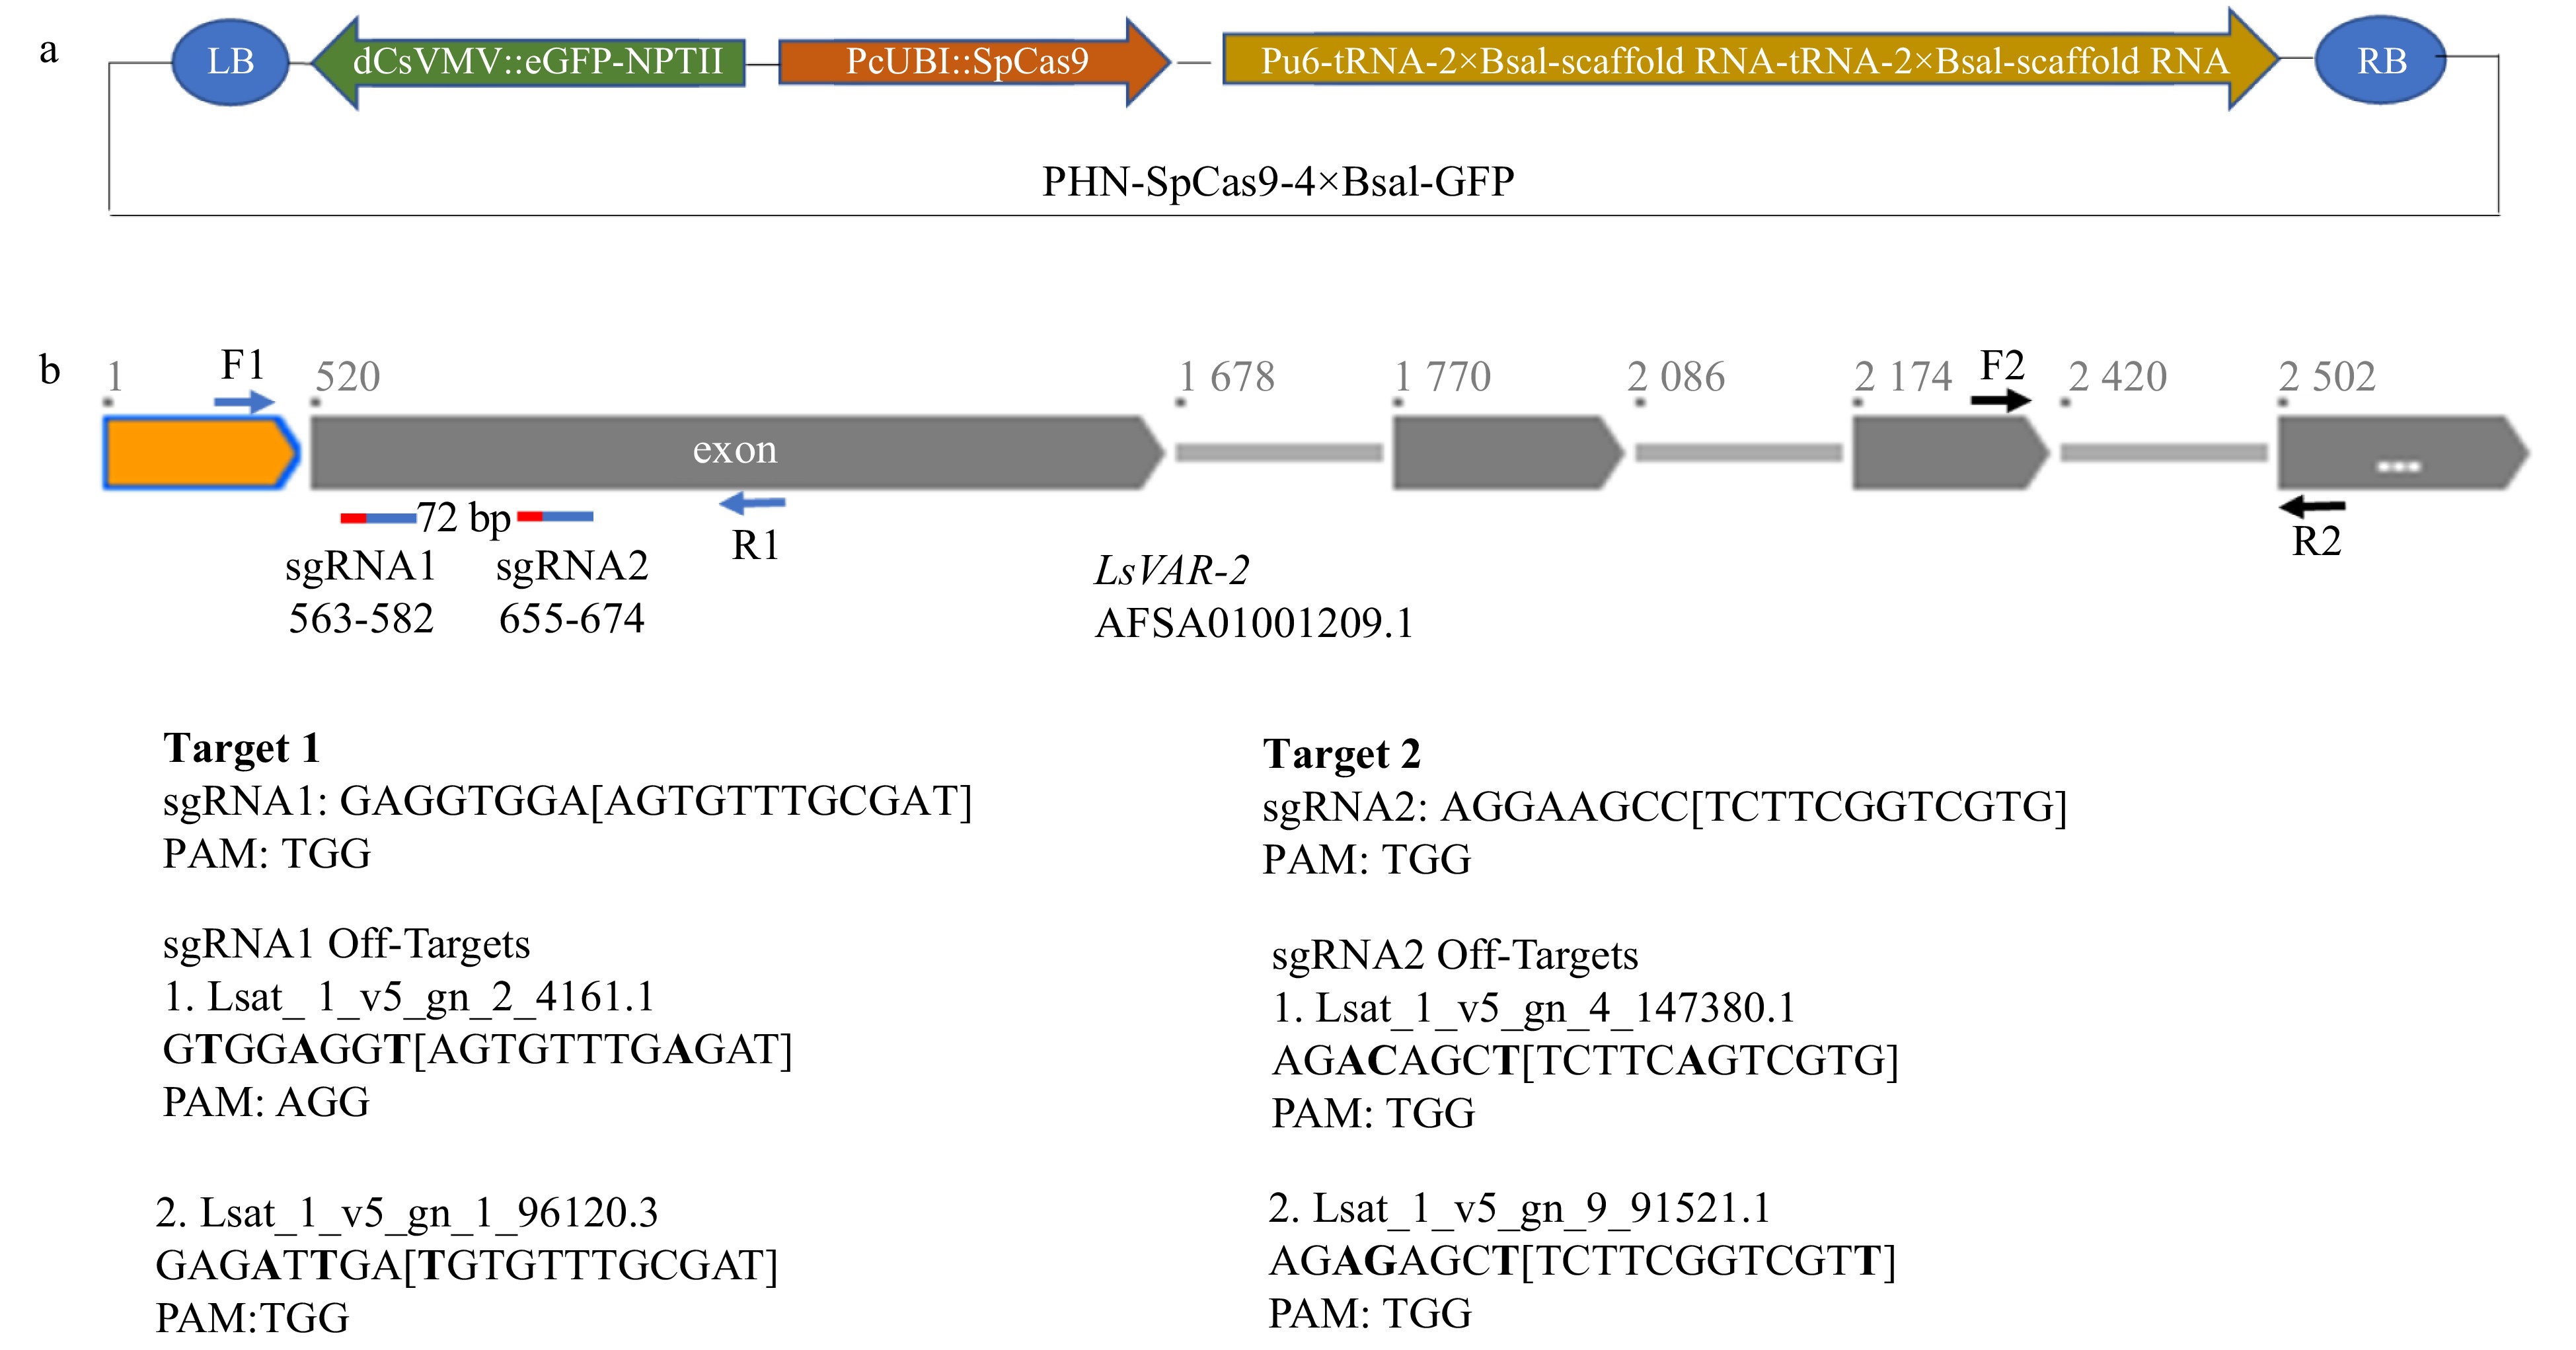
Figure 1. Schematic diagram of CRISPR/Cas9 vector design and LsVAR2 gene. (a) The PHN-SpCas9-4×BsaI-GFP vector contains a codon-optimized SpCas9 for Arabidopsis under parsley ubiquitin (PcUbi) promoter, a fused eGFP-NPTII under a dCsVMV promoter, and a sgRNA cloning cassette with two separate 2×BsaI sites, tRNAs and scaffold RNAs under the AtU6-26 promoter. (b) Schematic structure of LsVAR2 gene, two on-target sgRNAs and their potential off-targets. Orange box: 519 bp sequence upstream the first exon; gray boxes: exons; gray lines: introns. The positions of reverse complementary of two sgRNAs were indicated with two red-blue lines under the first exon with a 72 bp span between two sgRNAs. Red lines indicate PAM region of sgRNAs (blue lines), and the exact positions for both sgRNA were also shown as their numbers. The positions of primers F1/R1 for sequencing were indicated by blue arrows, and the positions of primers F2/R2 for qPCR were indicated by black arrows. Sequences of two guide RNAs and two potential off-targets were shown, and the nucleotide differences between the on-target and off-target sgRNAs were indicated in bold.
-
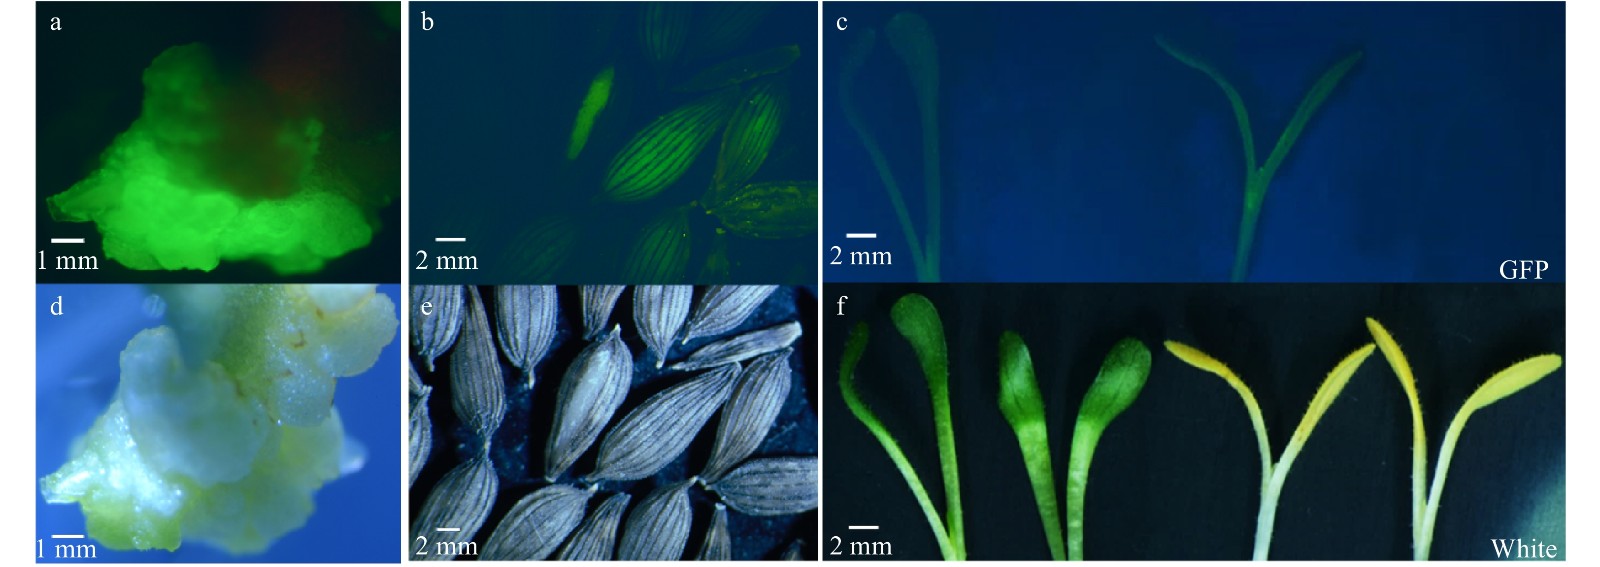
Figure 2. GFP detection after plant transformation using modified CRISPR/Cas9 vector. (a) Strong GFP fluorescence in the callus of lettuce after Agrobacterium infiltration and during plant regeneration and selection; (b) GFP fluorescence was observed in seeds from T1 plants; (c) GFP fluorescence in T1 mutant seedlings; T-DNA free seeds and seedlings segregated from the same genetic lines in (b) and (c) exhibited no GFP fluorescence. (d−f) same images as (a−c) but taken under white light.
-
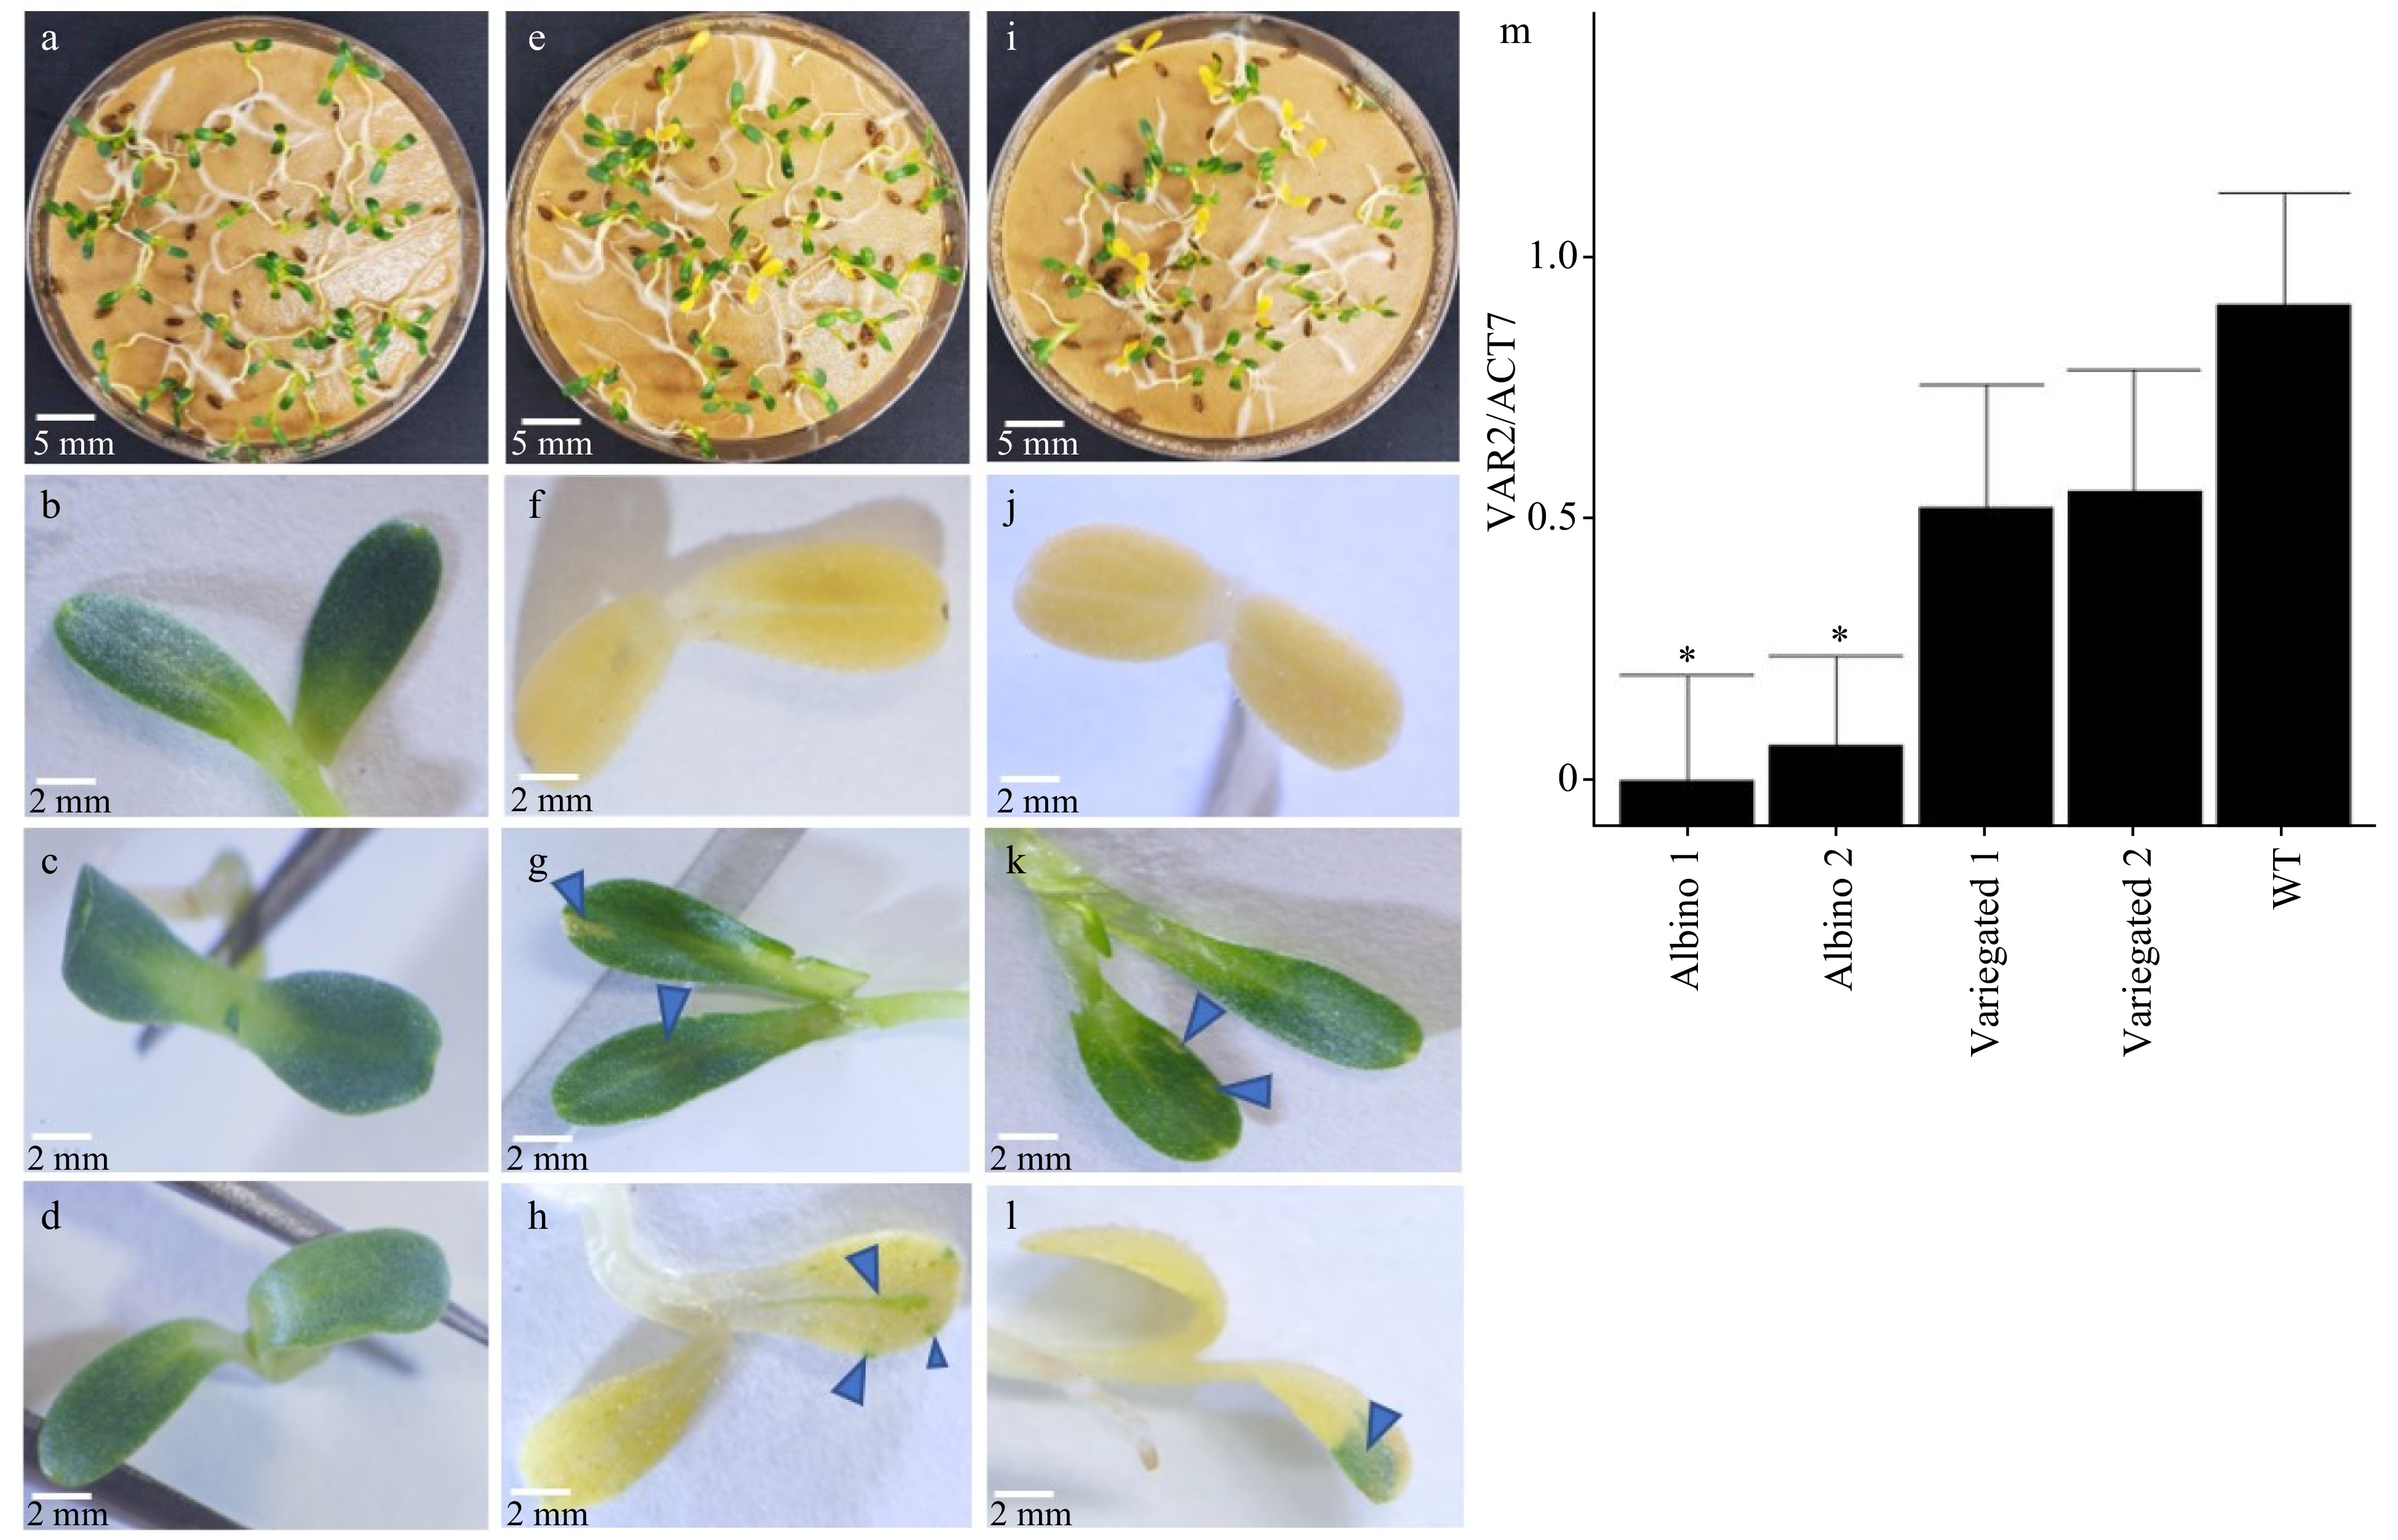
Figure 3. Different variegation phenotypes putatively created by de novo gene editing and transcription of LsVar2. (a) Germinated seedlings and cotyledon (b) of wild type lettuce cv. Salinas. (c) Green cotyledon without white speckles, (e) germinated seedlings, (f) albino cotyledon with no green speckles, (g) green cotyledon with variegated white speckles, (h) albino cotyledon with variegated green spots from heterozygous LsVAR2 gene edited T1 line 26-VAR-1-F_R. Arrows in (g) and (h) indicate variegated white speckles in the green cotyledon and green speckles in the albino cotyledon, respectively. (d) Green cotyledon without white speckles, (i) germinated seedlings, (j) albino cotyledon with no green speckles, (k) green cotyledon with variegated white speckles, (l) albino cotyledon with variegated green spots from heterozygous LsVAR2 gene edited T1 line 25-VAR-1-F. Arrows in (k) and (l) indicate variegated white speckles in the green cotyledon and green speckles in the albino cotyledon, respectively. (m) Relative gene expression in variegated and albino seedlings from 26-VAR-1-F_R (Albino 1) and 25-VAR-1-F (Albino 2) lines, and in wild type seedlings (WT). The gene expression was expressed as a normalized value to the wild type. All images were taken at 7 days after germination.
-
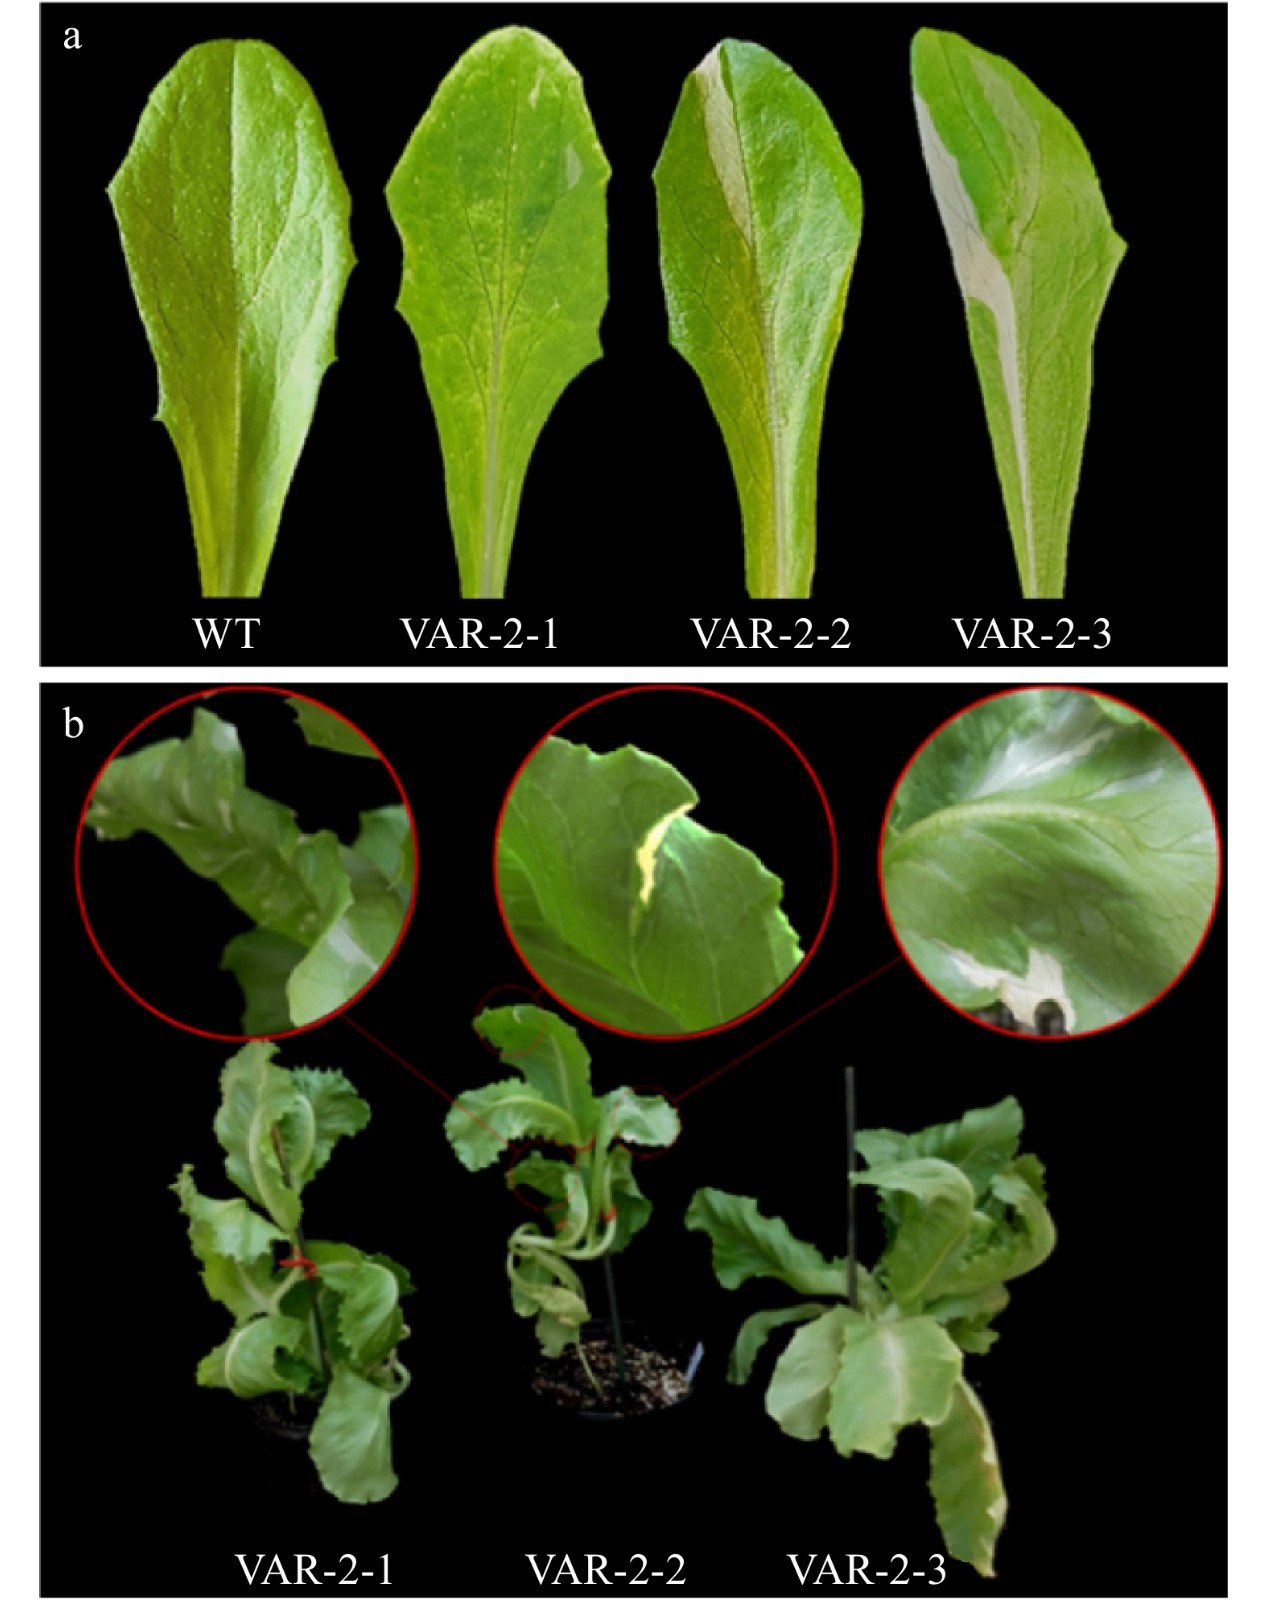
Figure 4. Phenotypes of LsVAR-2 adult mutant plants. (a) Different variegated patterns on young leaves of 3 week-old mutant and WT plants. (b) Variegated phenotype in three 6 week-old mutant plants.
-
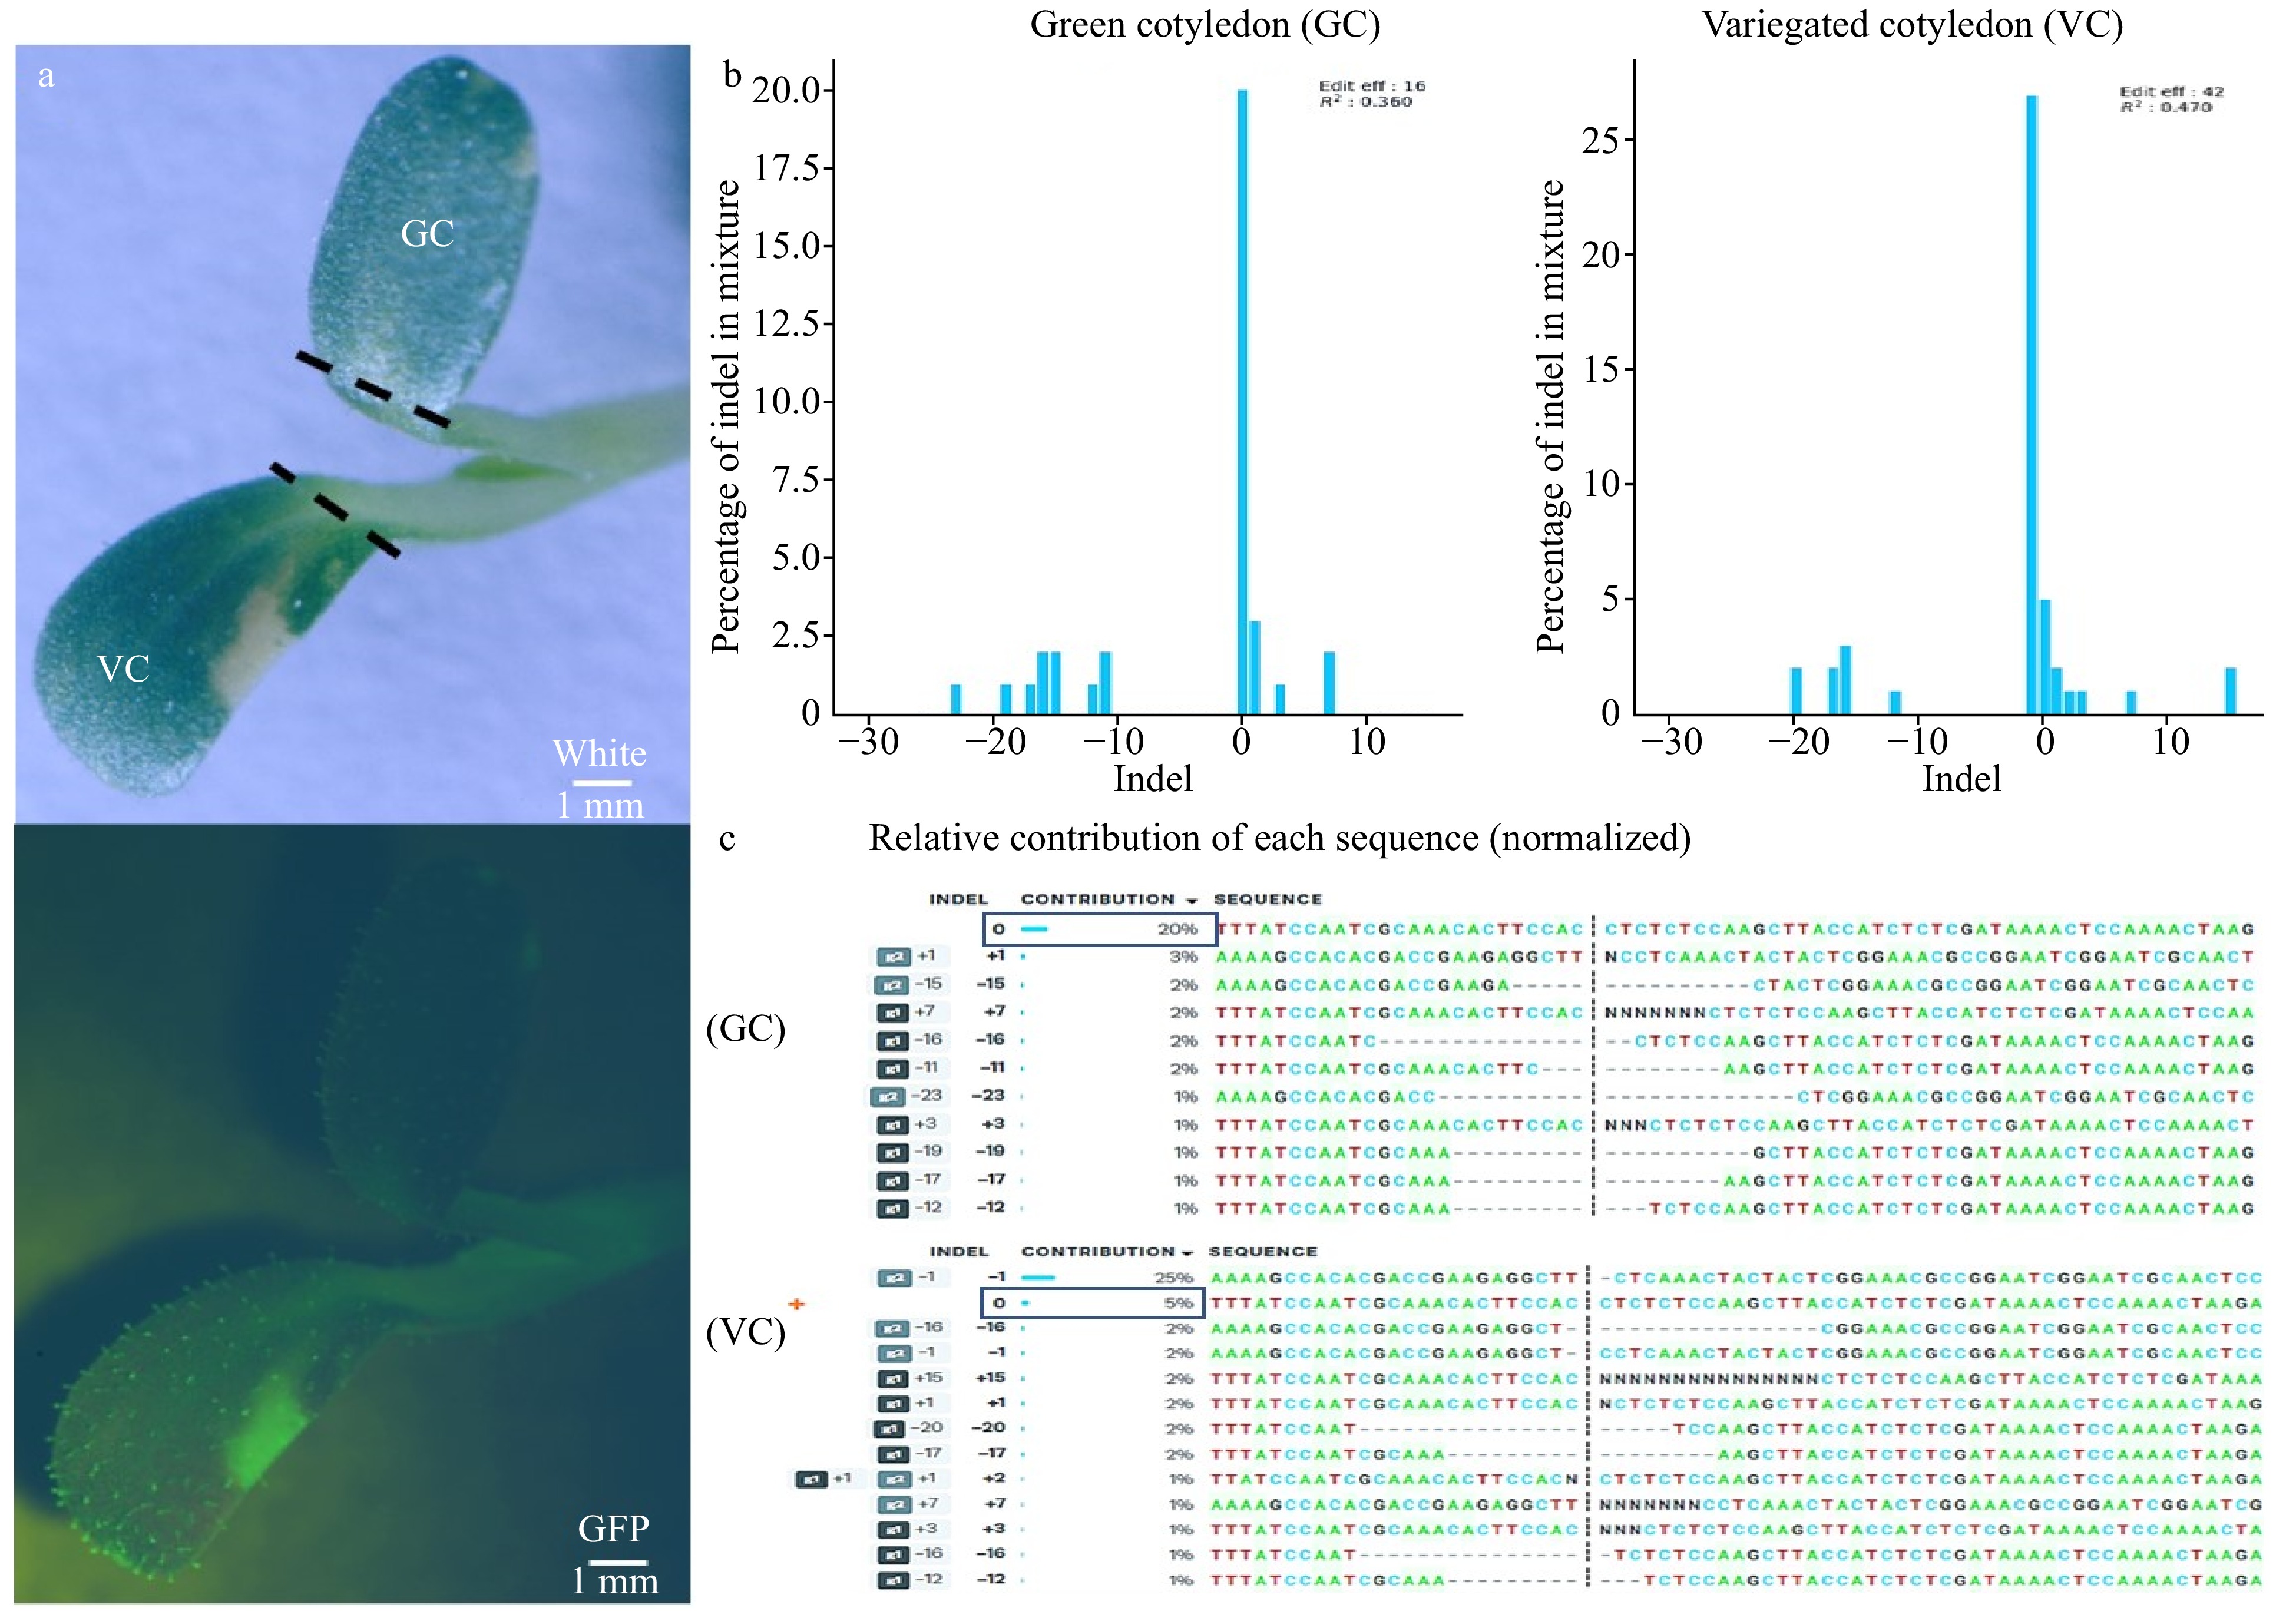
Figure 5. Phenotypic difference caused by de novo gene editing in cotyledon containing Cas9. (a) Green cotyledon (GC) and variegated cotyledon (VC) cut (---) from the same seedling under white light (top), GFP (bottom). (b) The percentage of indel mixture indicated that green cotyledon only had an editing efficiency of 16% while the editing efficiency in variegated cotyledon increased to 42%. (c) Relative contribution of each sequence showed green cotyledon had 20% of WT sequence contribution while the variegated cotyledon WT contribution decreased to 5%. g1: sgRNA1, g2: sgRNA2.
-
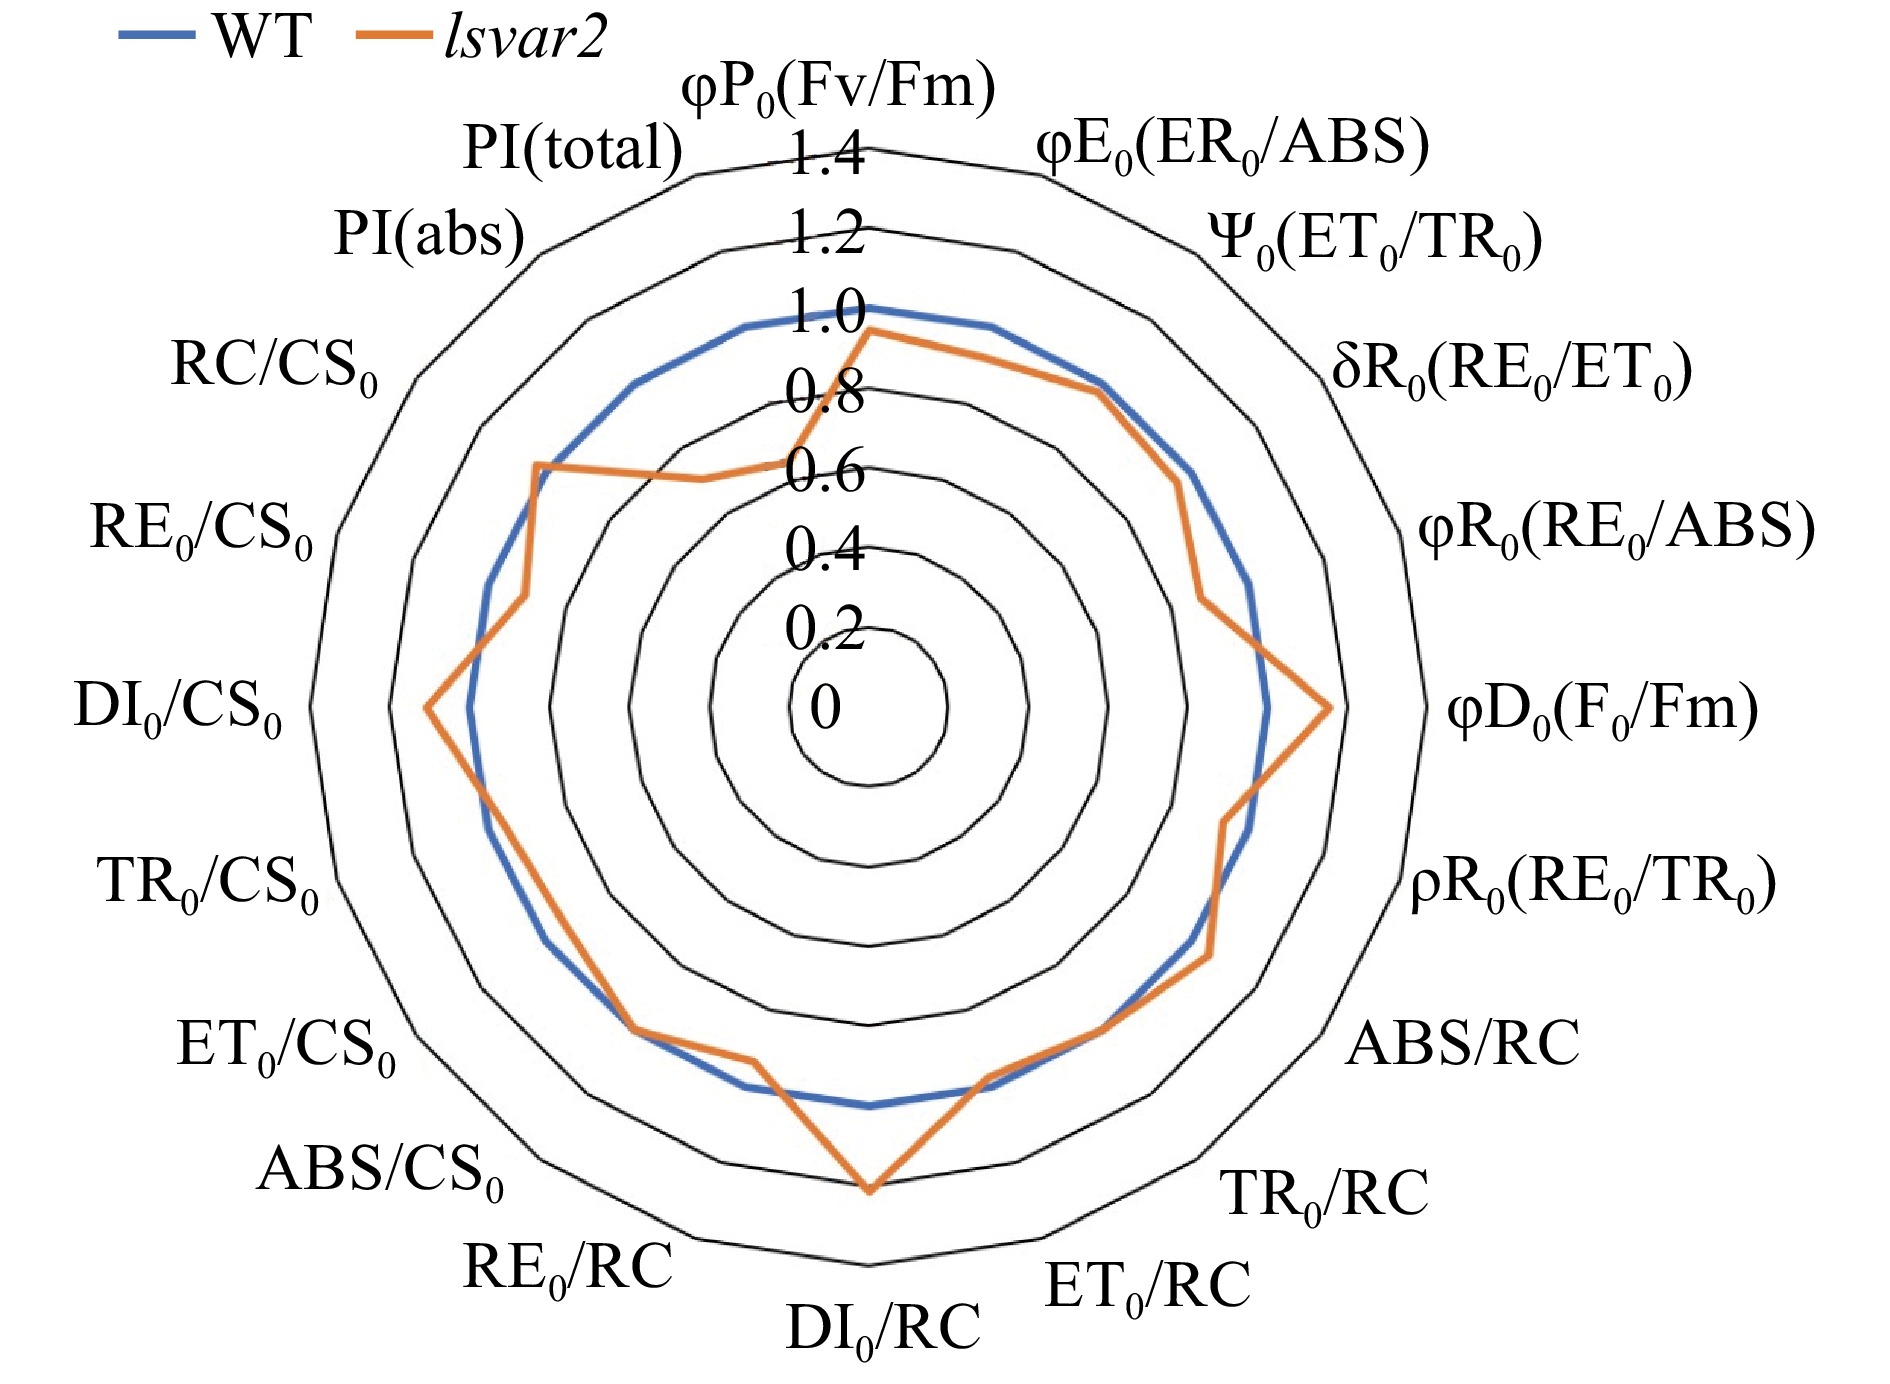
Figure 6. OJIP test parameters of lettuce mutant (var2) induced by CRISPR/Cas9 and wild type. PSII energy dissipation flux increased while the performance index for energy conservation decreased in the mutant when compared to the wild type.
-
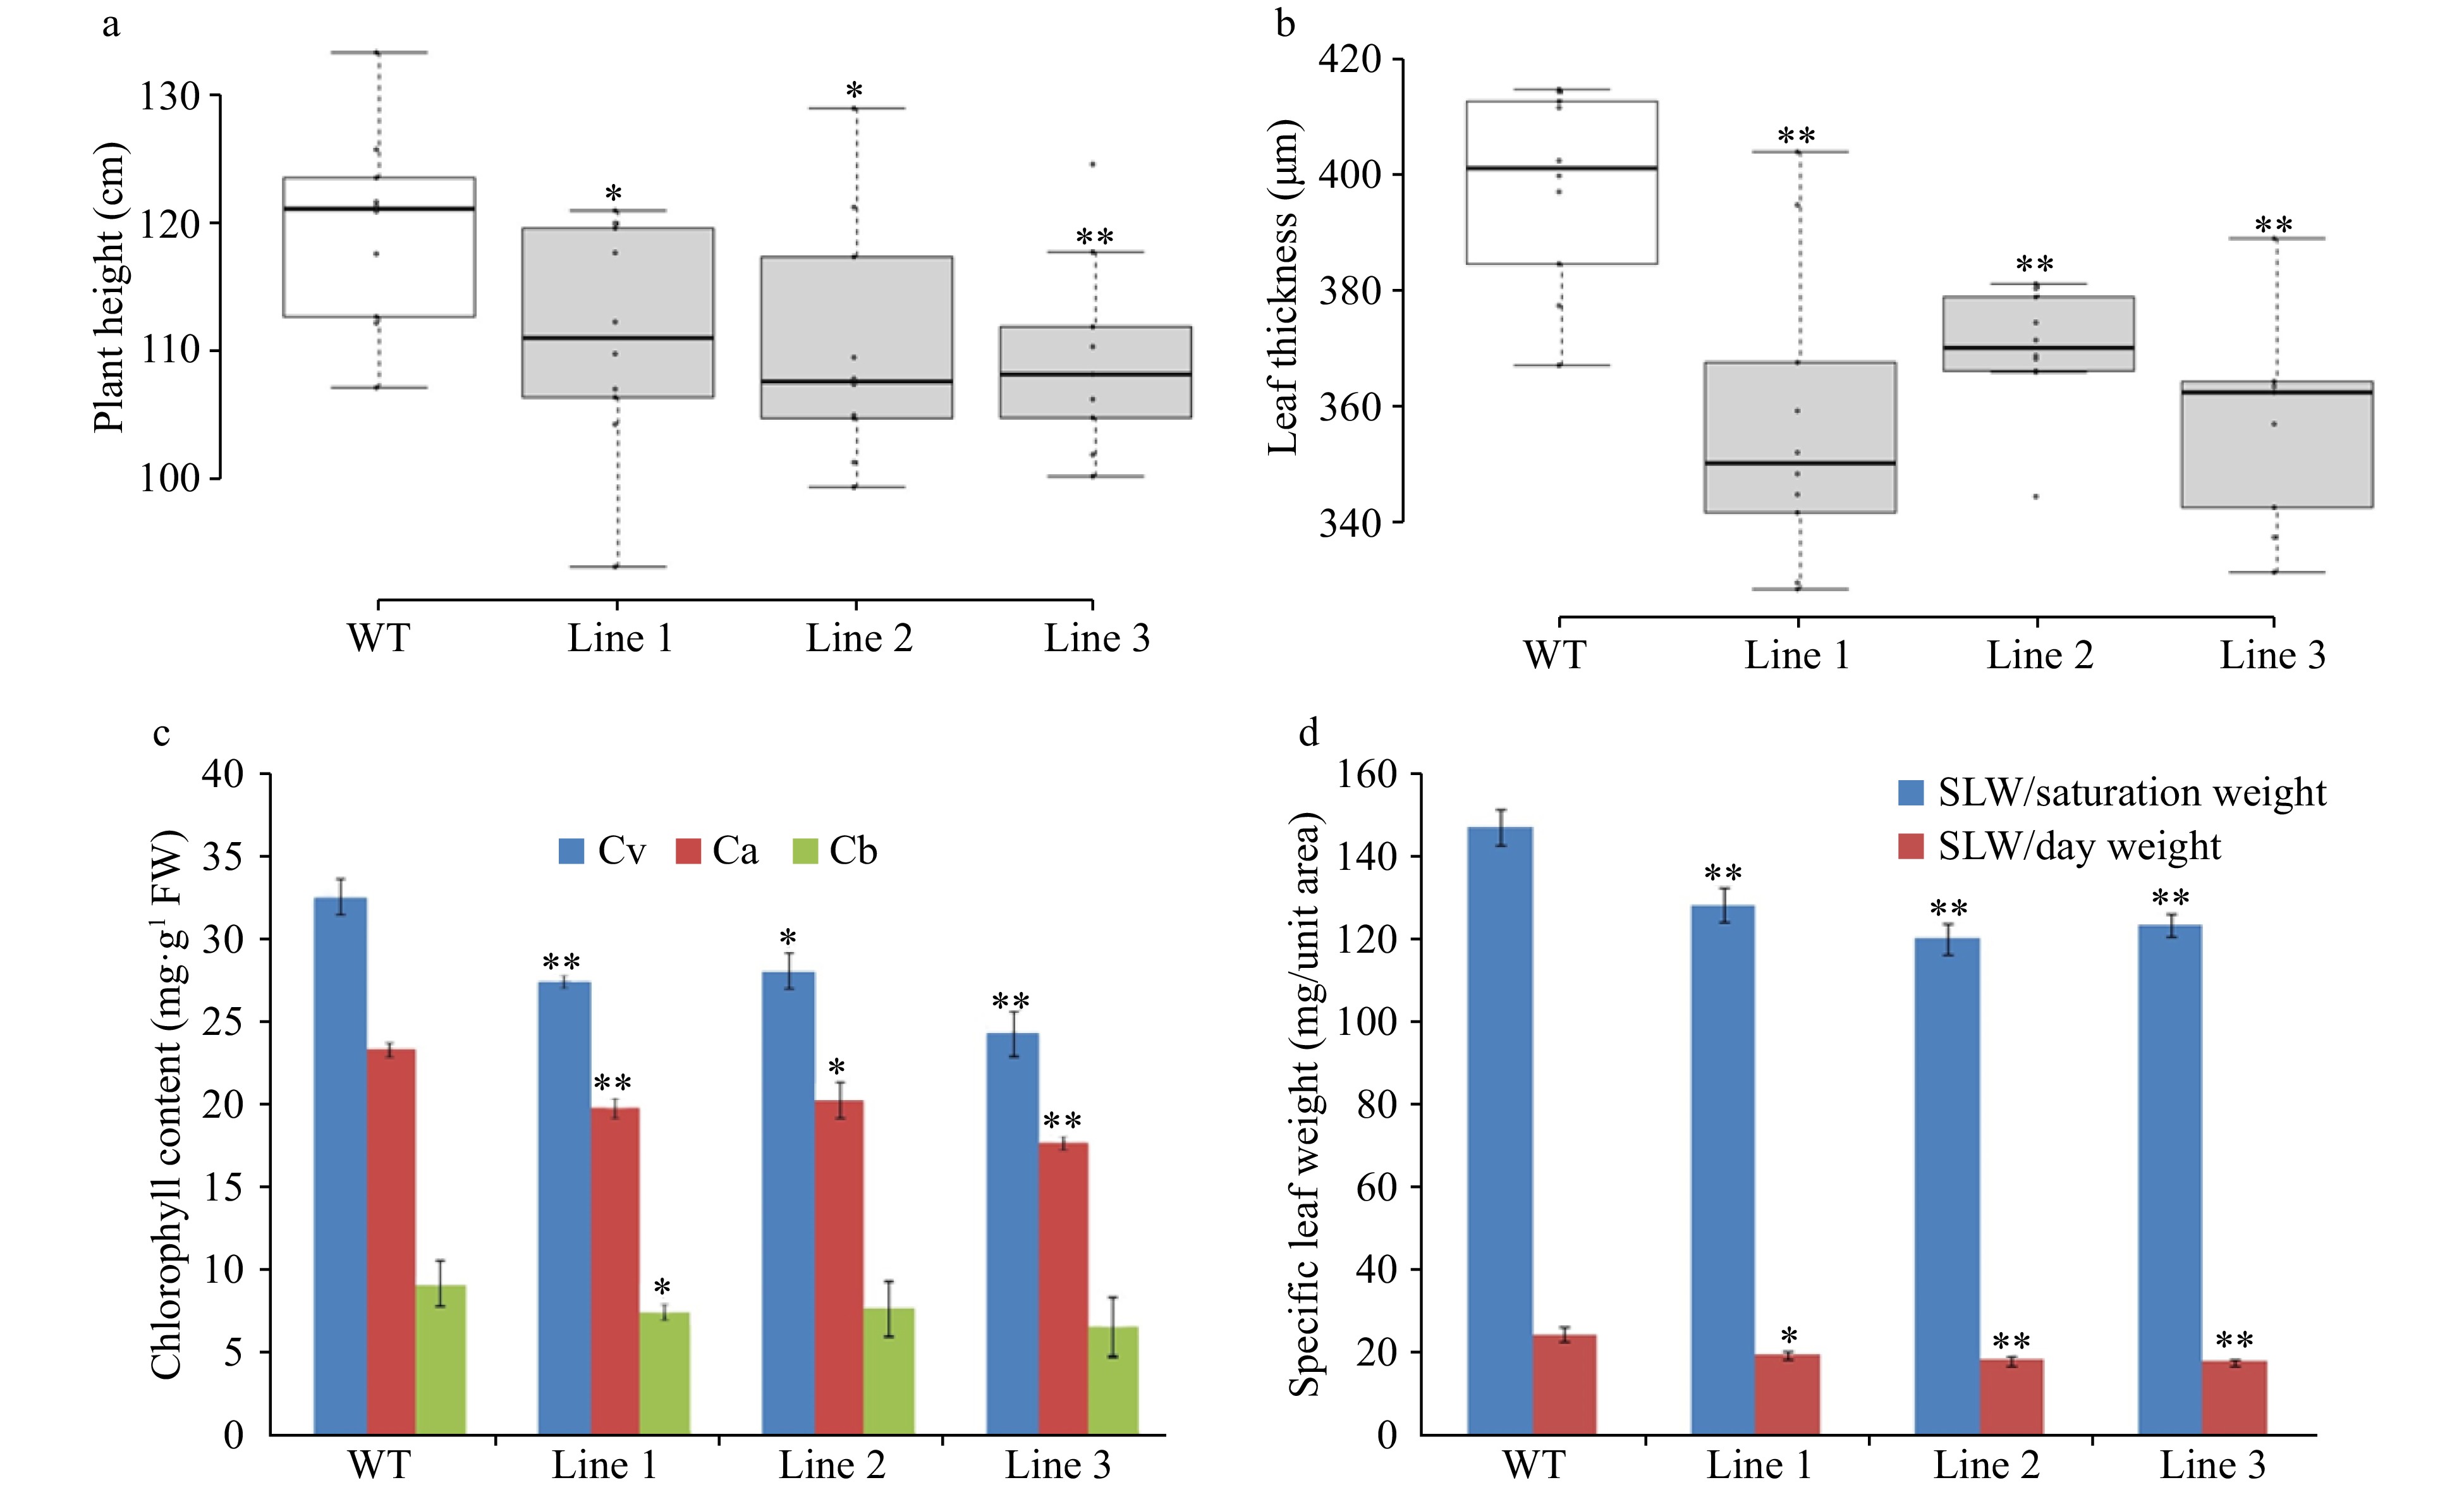
Figure 7. Morphological and physiological measurements of LsVAR2 mutants by CRISPR/Cas9. (a) Plant height; (b) Leaf thickness; (c) Chlorophyll content; (d) Specific leaf weight (SLW). The asterisks denote a statistically significant difference at p < 0.05 between the mutants and wild type.
Figures
(7)
Tables
(0)