-
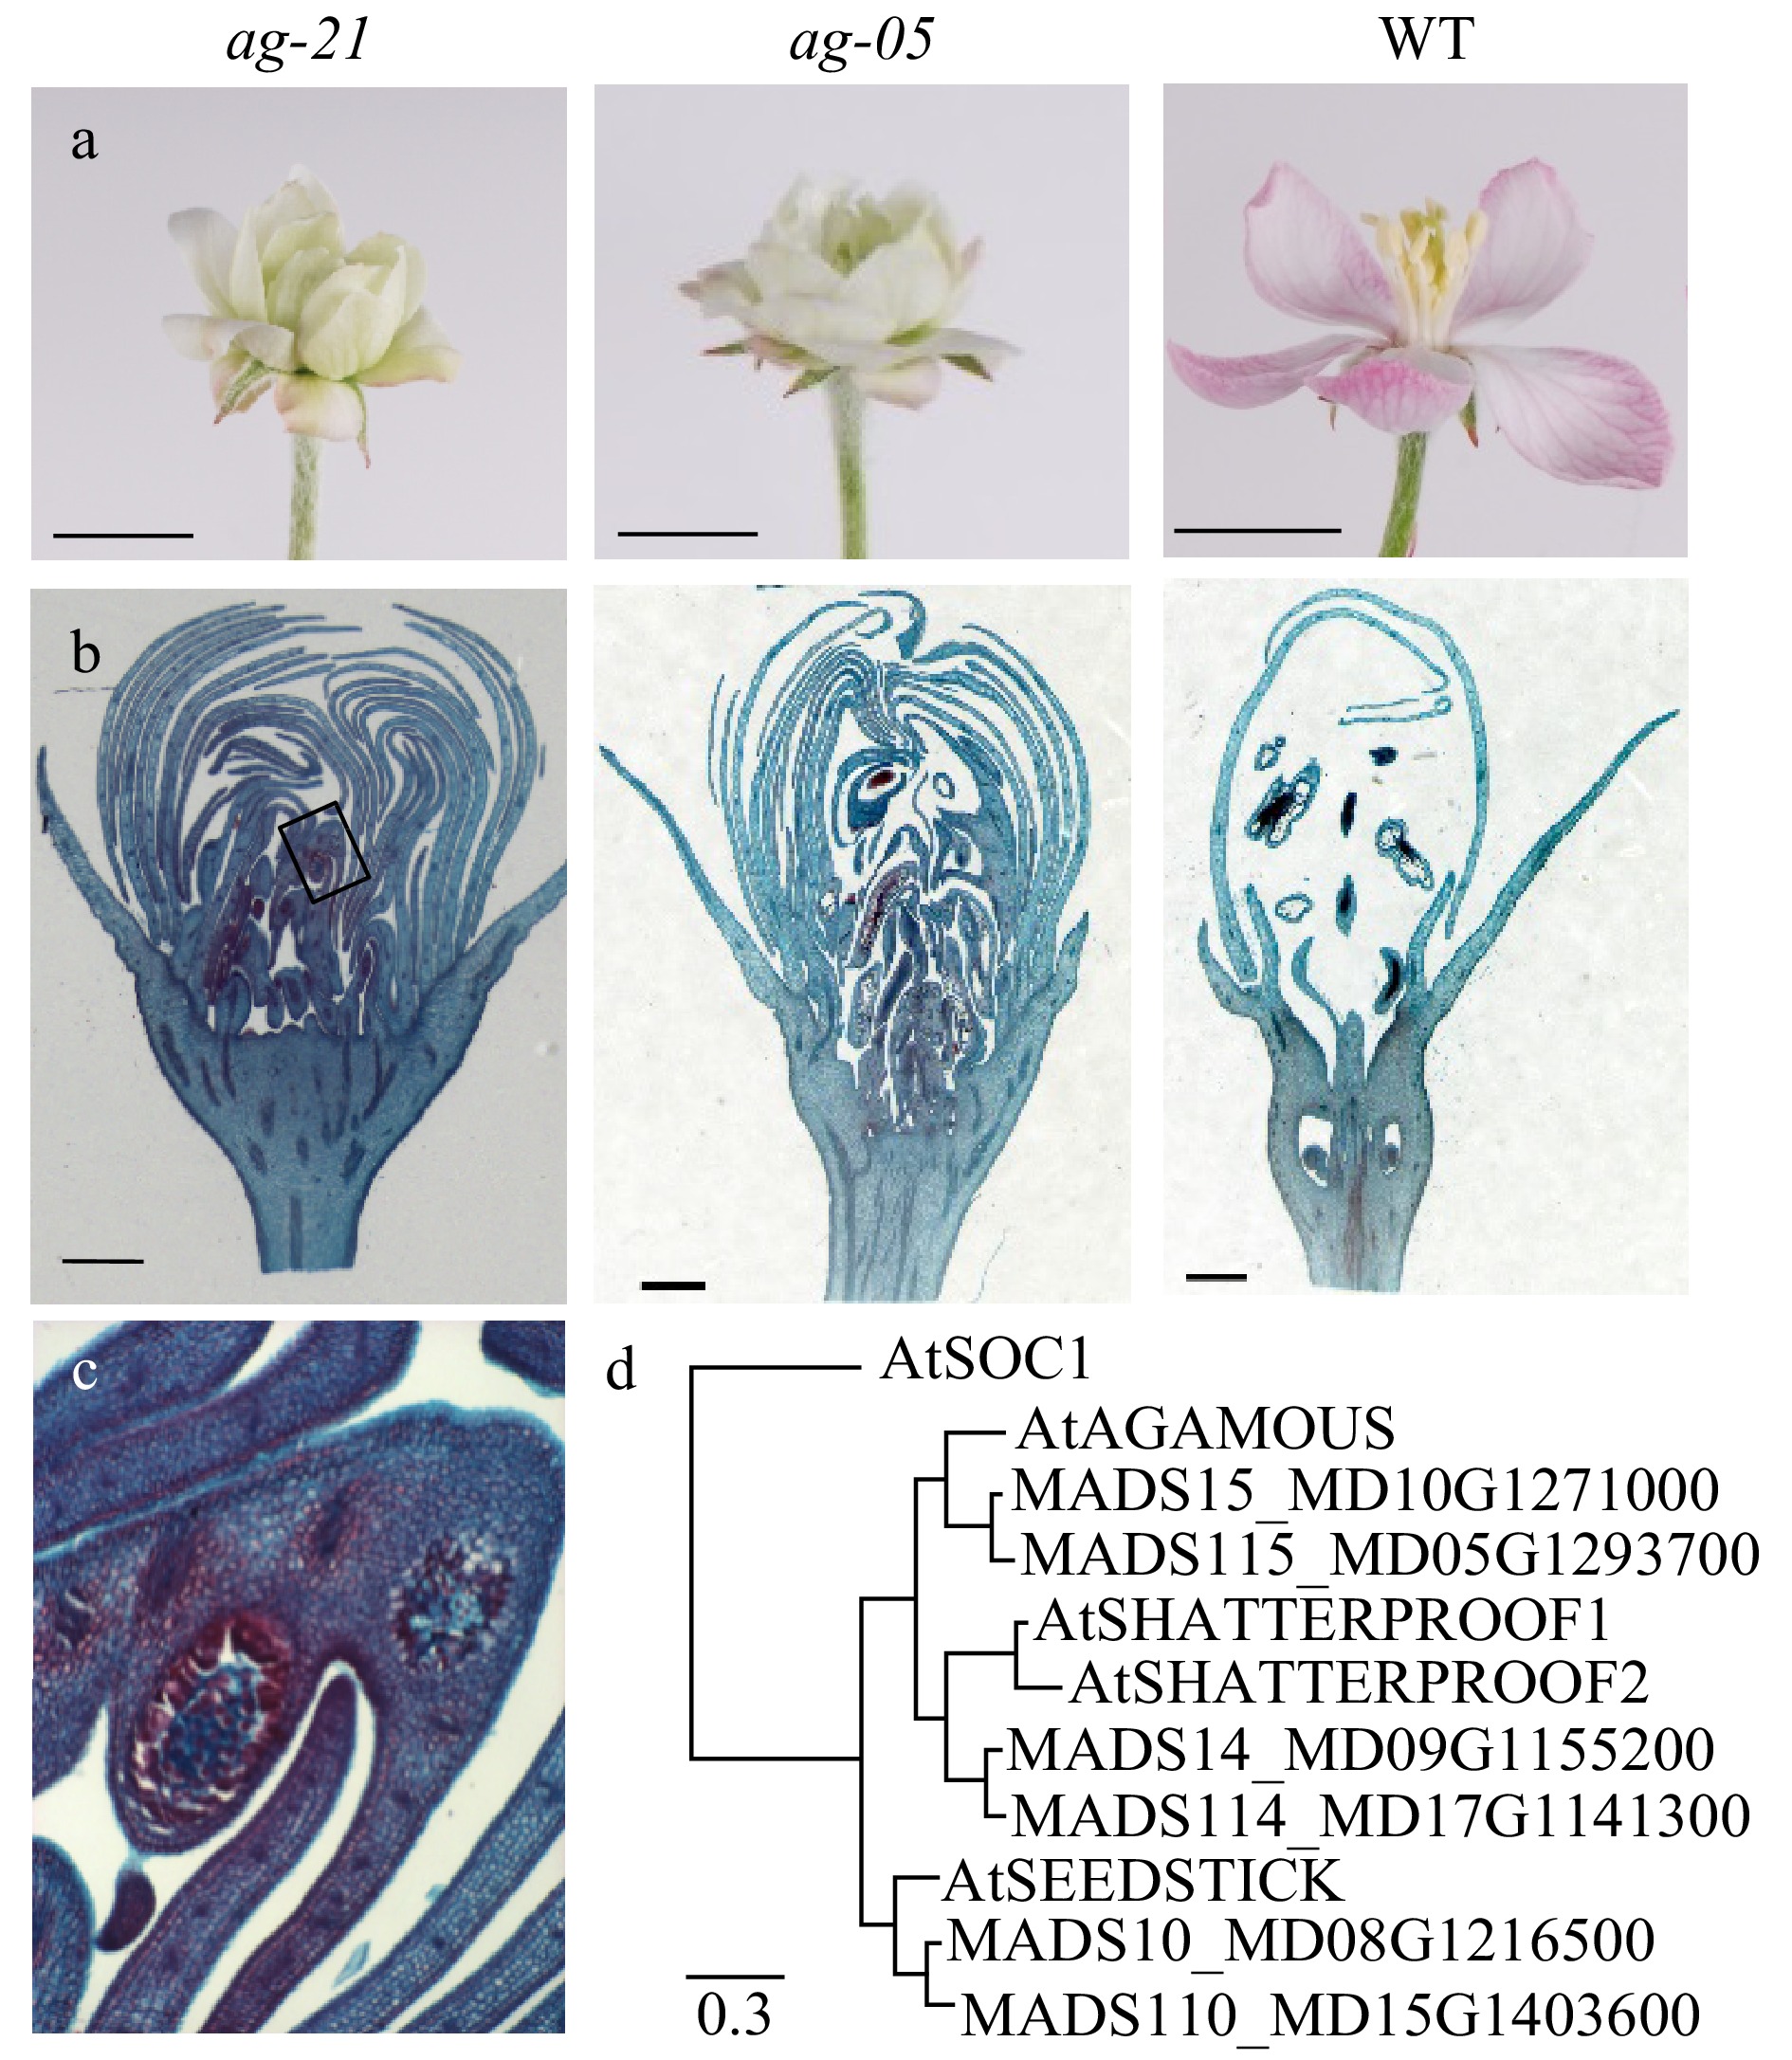
Figure 1. Removing apple carpel tissues through suppression of AG-like genes. (a, b, c) Floral phenotype of wild-type and RNAi lines. (a) Flowers at full bloom (open stage). Scale bar, 1 cm. (b) Longitudinal sections of flowers at balloon stage stained with safranin fast-green. Rectangle on ag-21 image borders tissues with pollen-like granules and demarcates boundary of magnified image in (c). Scale bar, 1 mm. (c) Magnification (10X) of pollen-like granules in ag-21. (d) Phylogenetic tree of AG-like genes in apple and Arabidopsis, model and accession numbers listed in Supplementa Table S1, shown with AtSOC1 (AT2G45660.1) as outgroup. Scale indicates 0.3 substitutions per site.
-
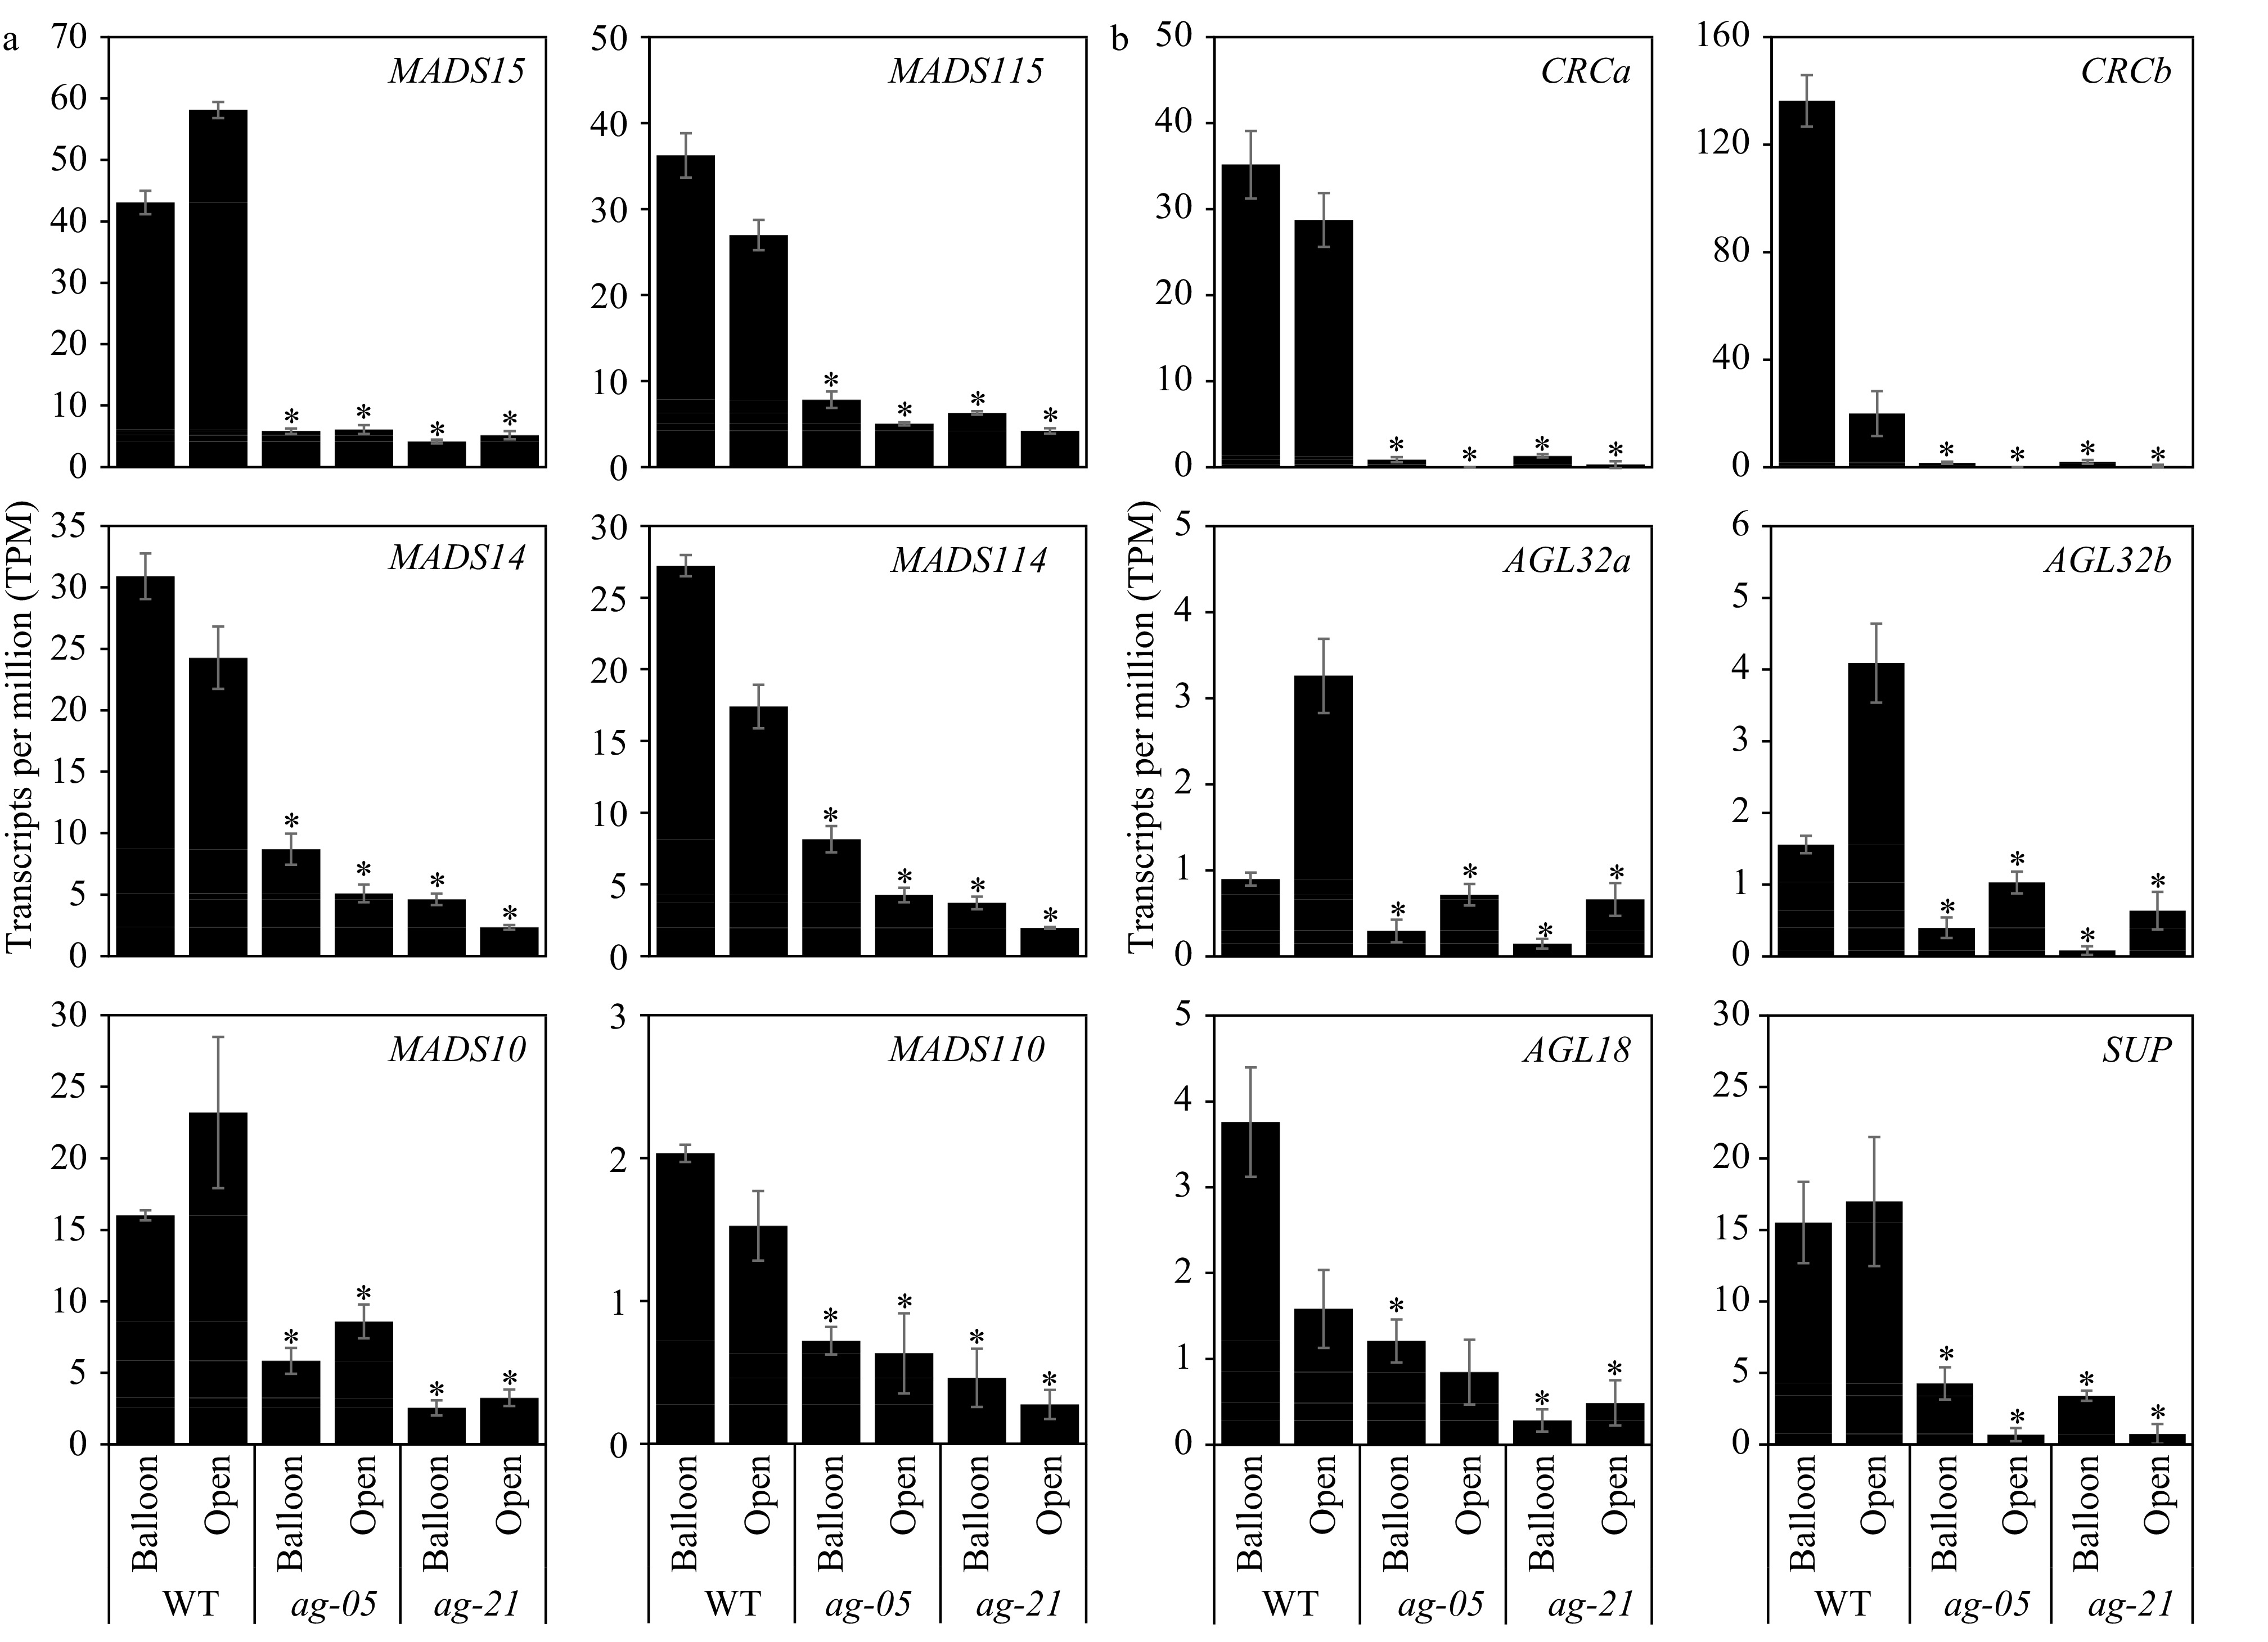
Figure 2. mRNA-seq analysis of apple AG-like gene models (a) and apple homologues to direct targets of AG (b) in wild-type (WT) and RNAi lines ag-05 and ag-21. Gene expression (transcripts per million, TPM) as found in whole flowers at two development stages (balloon and open flower). Values are mean ± SEM (n = 3). * p ≤ 0.05, −1 ≥ Log2FC ≥ 1 compared with WT stage. Apple AG clade accession and model numbers provided in Supplemental Table S1. HFTH1 gene model IDs for apple homologues are: CRCa, HF07613; CRCb, HF42325; AGL32a, HF11534; AGL32b, HF23066; AGL18, HF20484; SUP, HF14066.
-
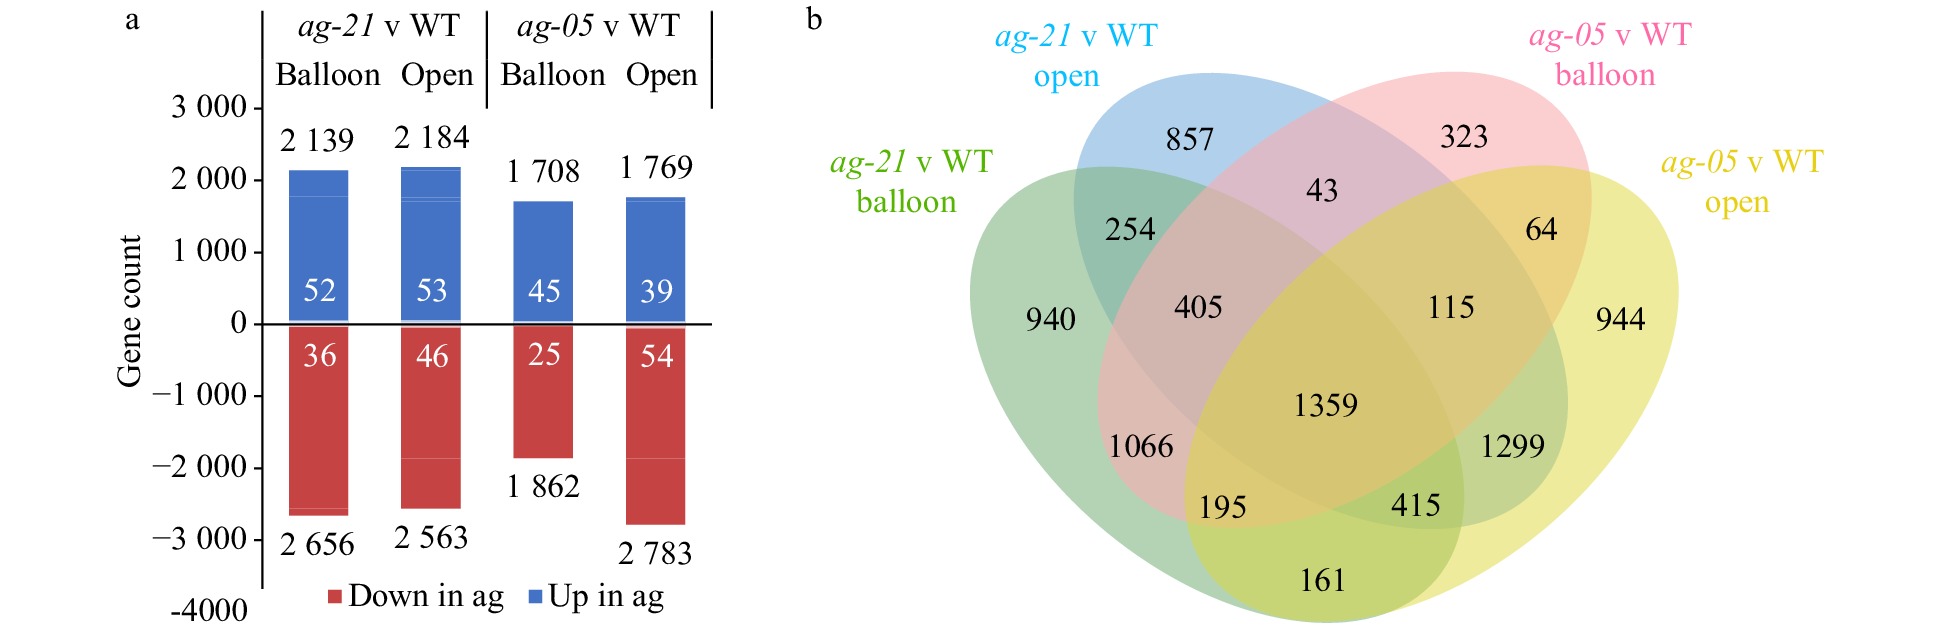
Figure 3. Comparison of transcriptomes of extreme and partial RNAi apple lines. (a) Significantly differentially expressed genes (p ≤ 0.05, −1 ≥ Log2FC ≥ 1, black data labels) in RNAi lines compared with wild-type (WT) at two floral stages (balloon and open flower) and corresponding proportion of AG direct target homologues (white data labels). (b) Venn diagram showing relationships of differentially expressed genes in terms of floral stage and genotype.
-
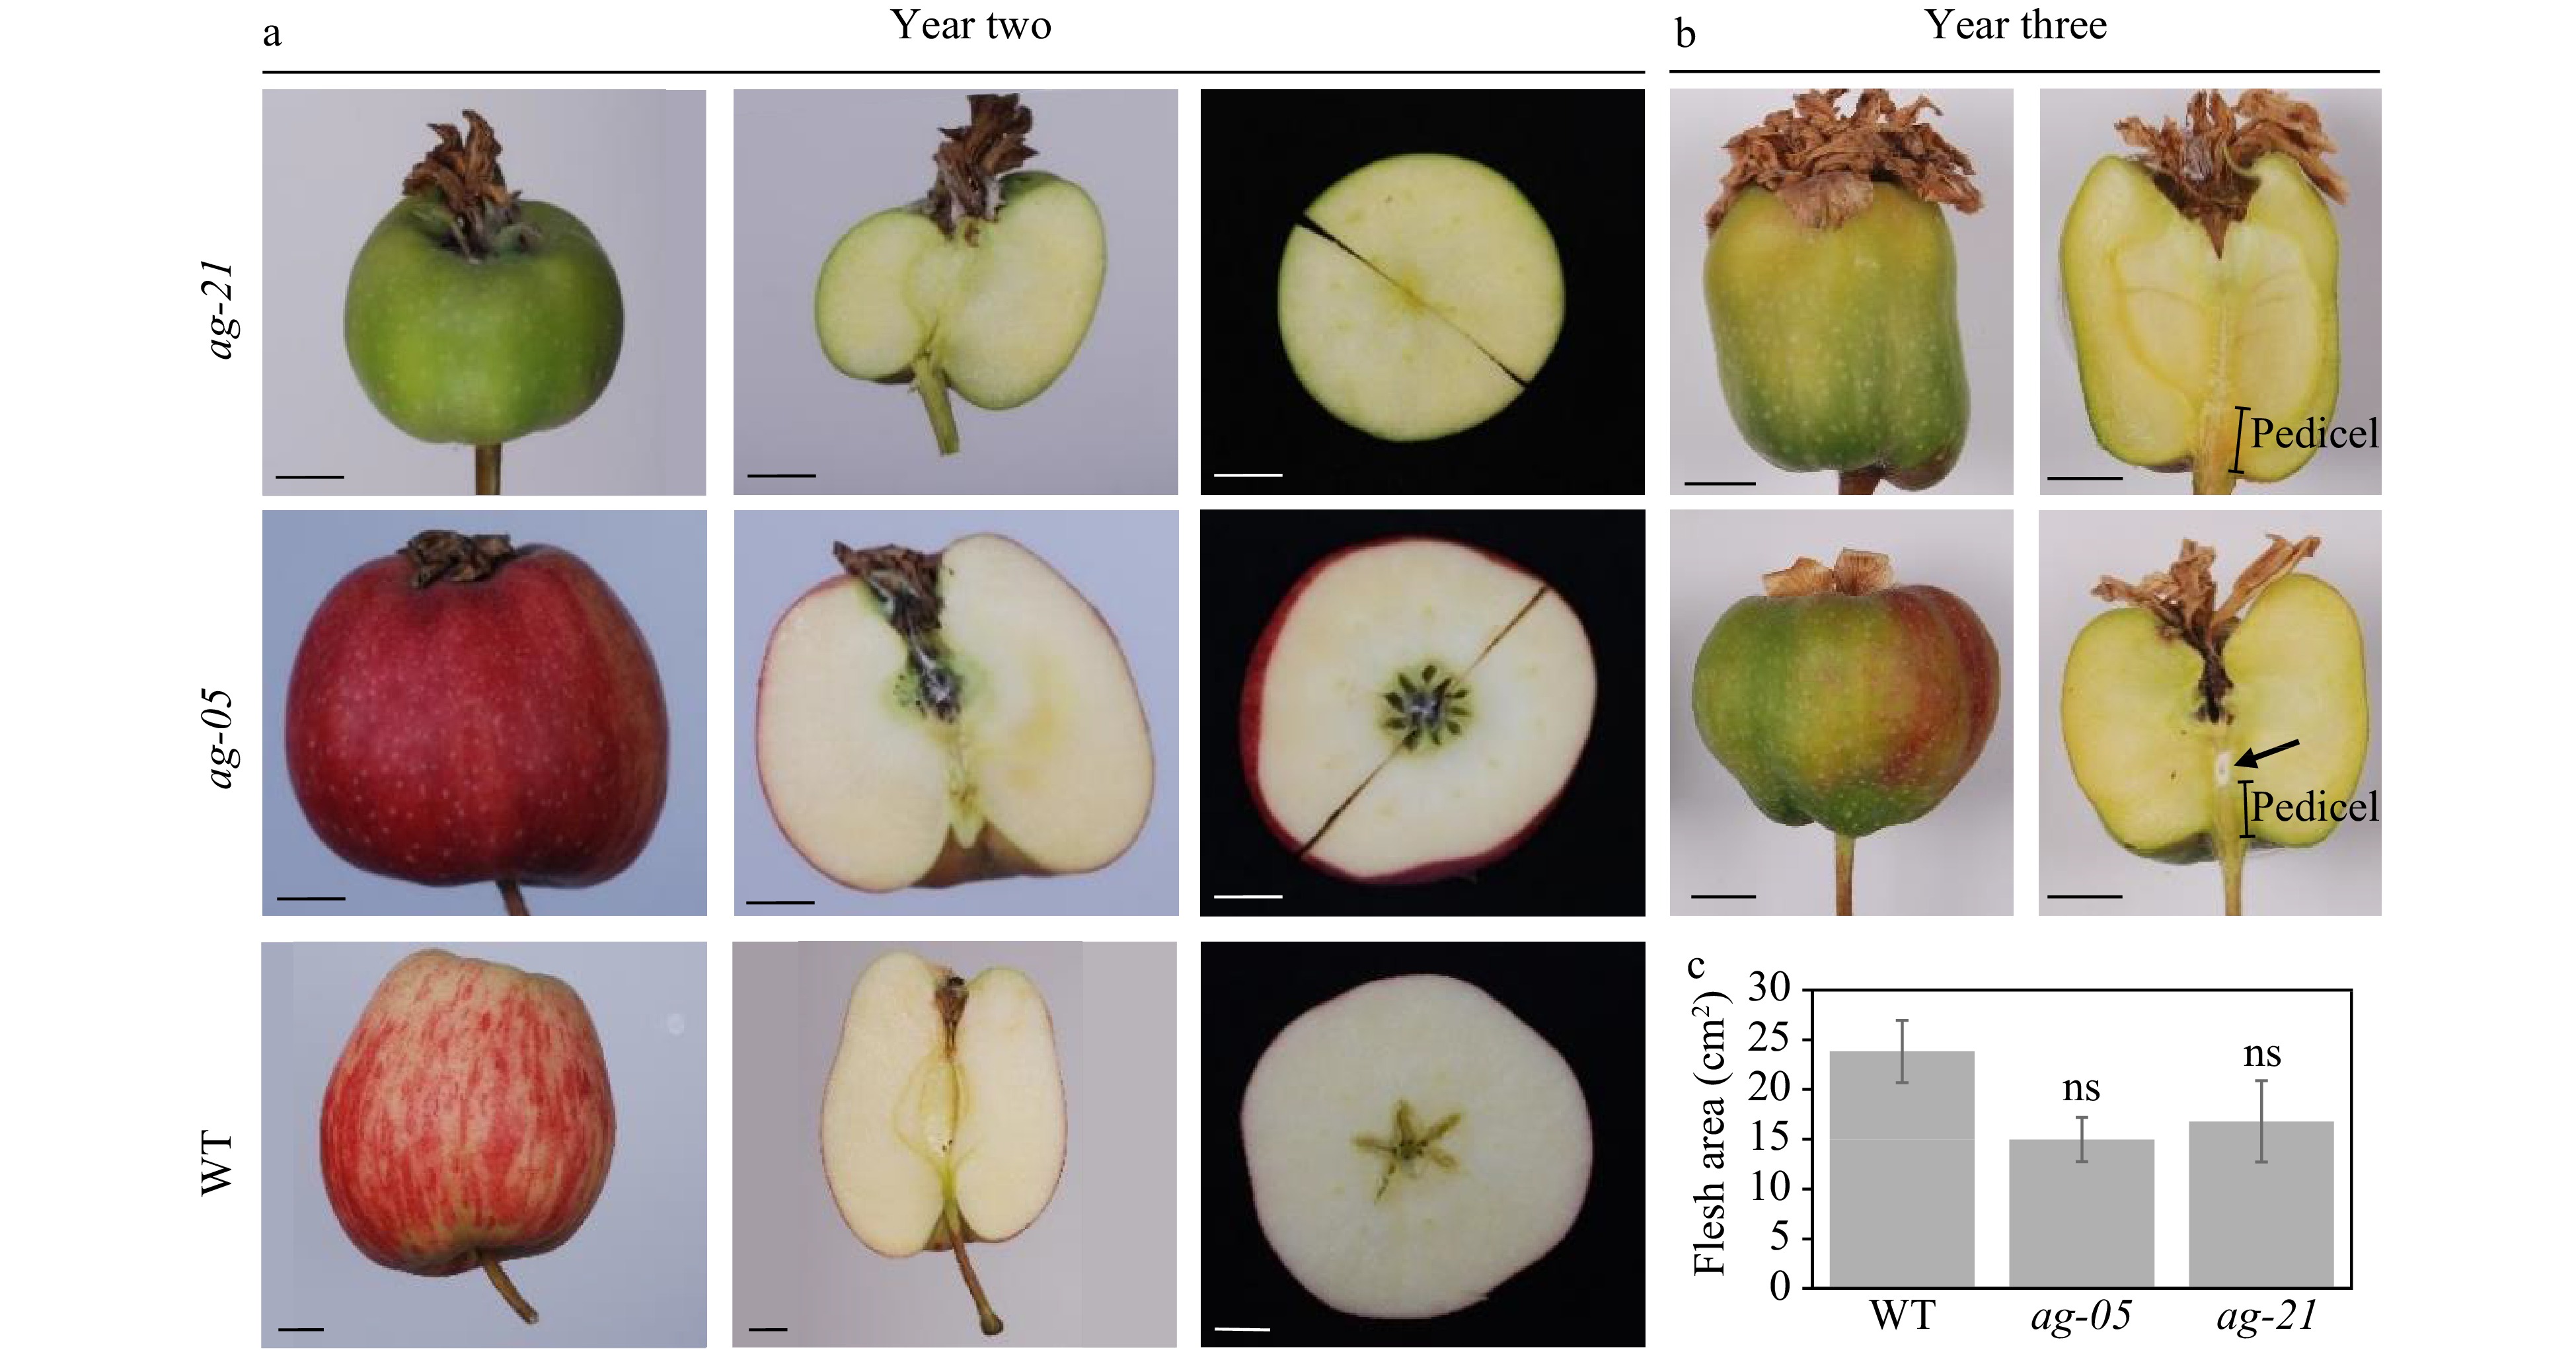
Figure 4. Mature apples (approx. 120 DAFB) produced by hormone-induction in wild-type and RNAi lines in (a) year two and (b) year three. Classic parthenocarpic fruit phenotype in wild-type, compared with coreless phenotype in ag-21. Scale bar, 1 cm. (c) Comparison of flesh area in wild-type and RNAi lines, n = 5 per genotype; Student’s t-test, p ≤ 0.05.
-
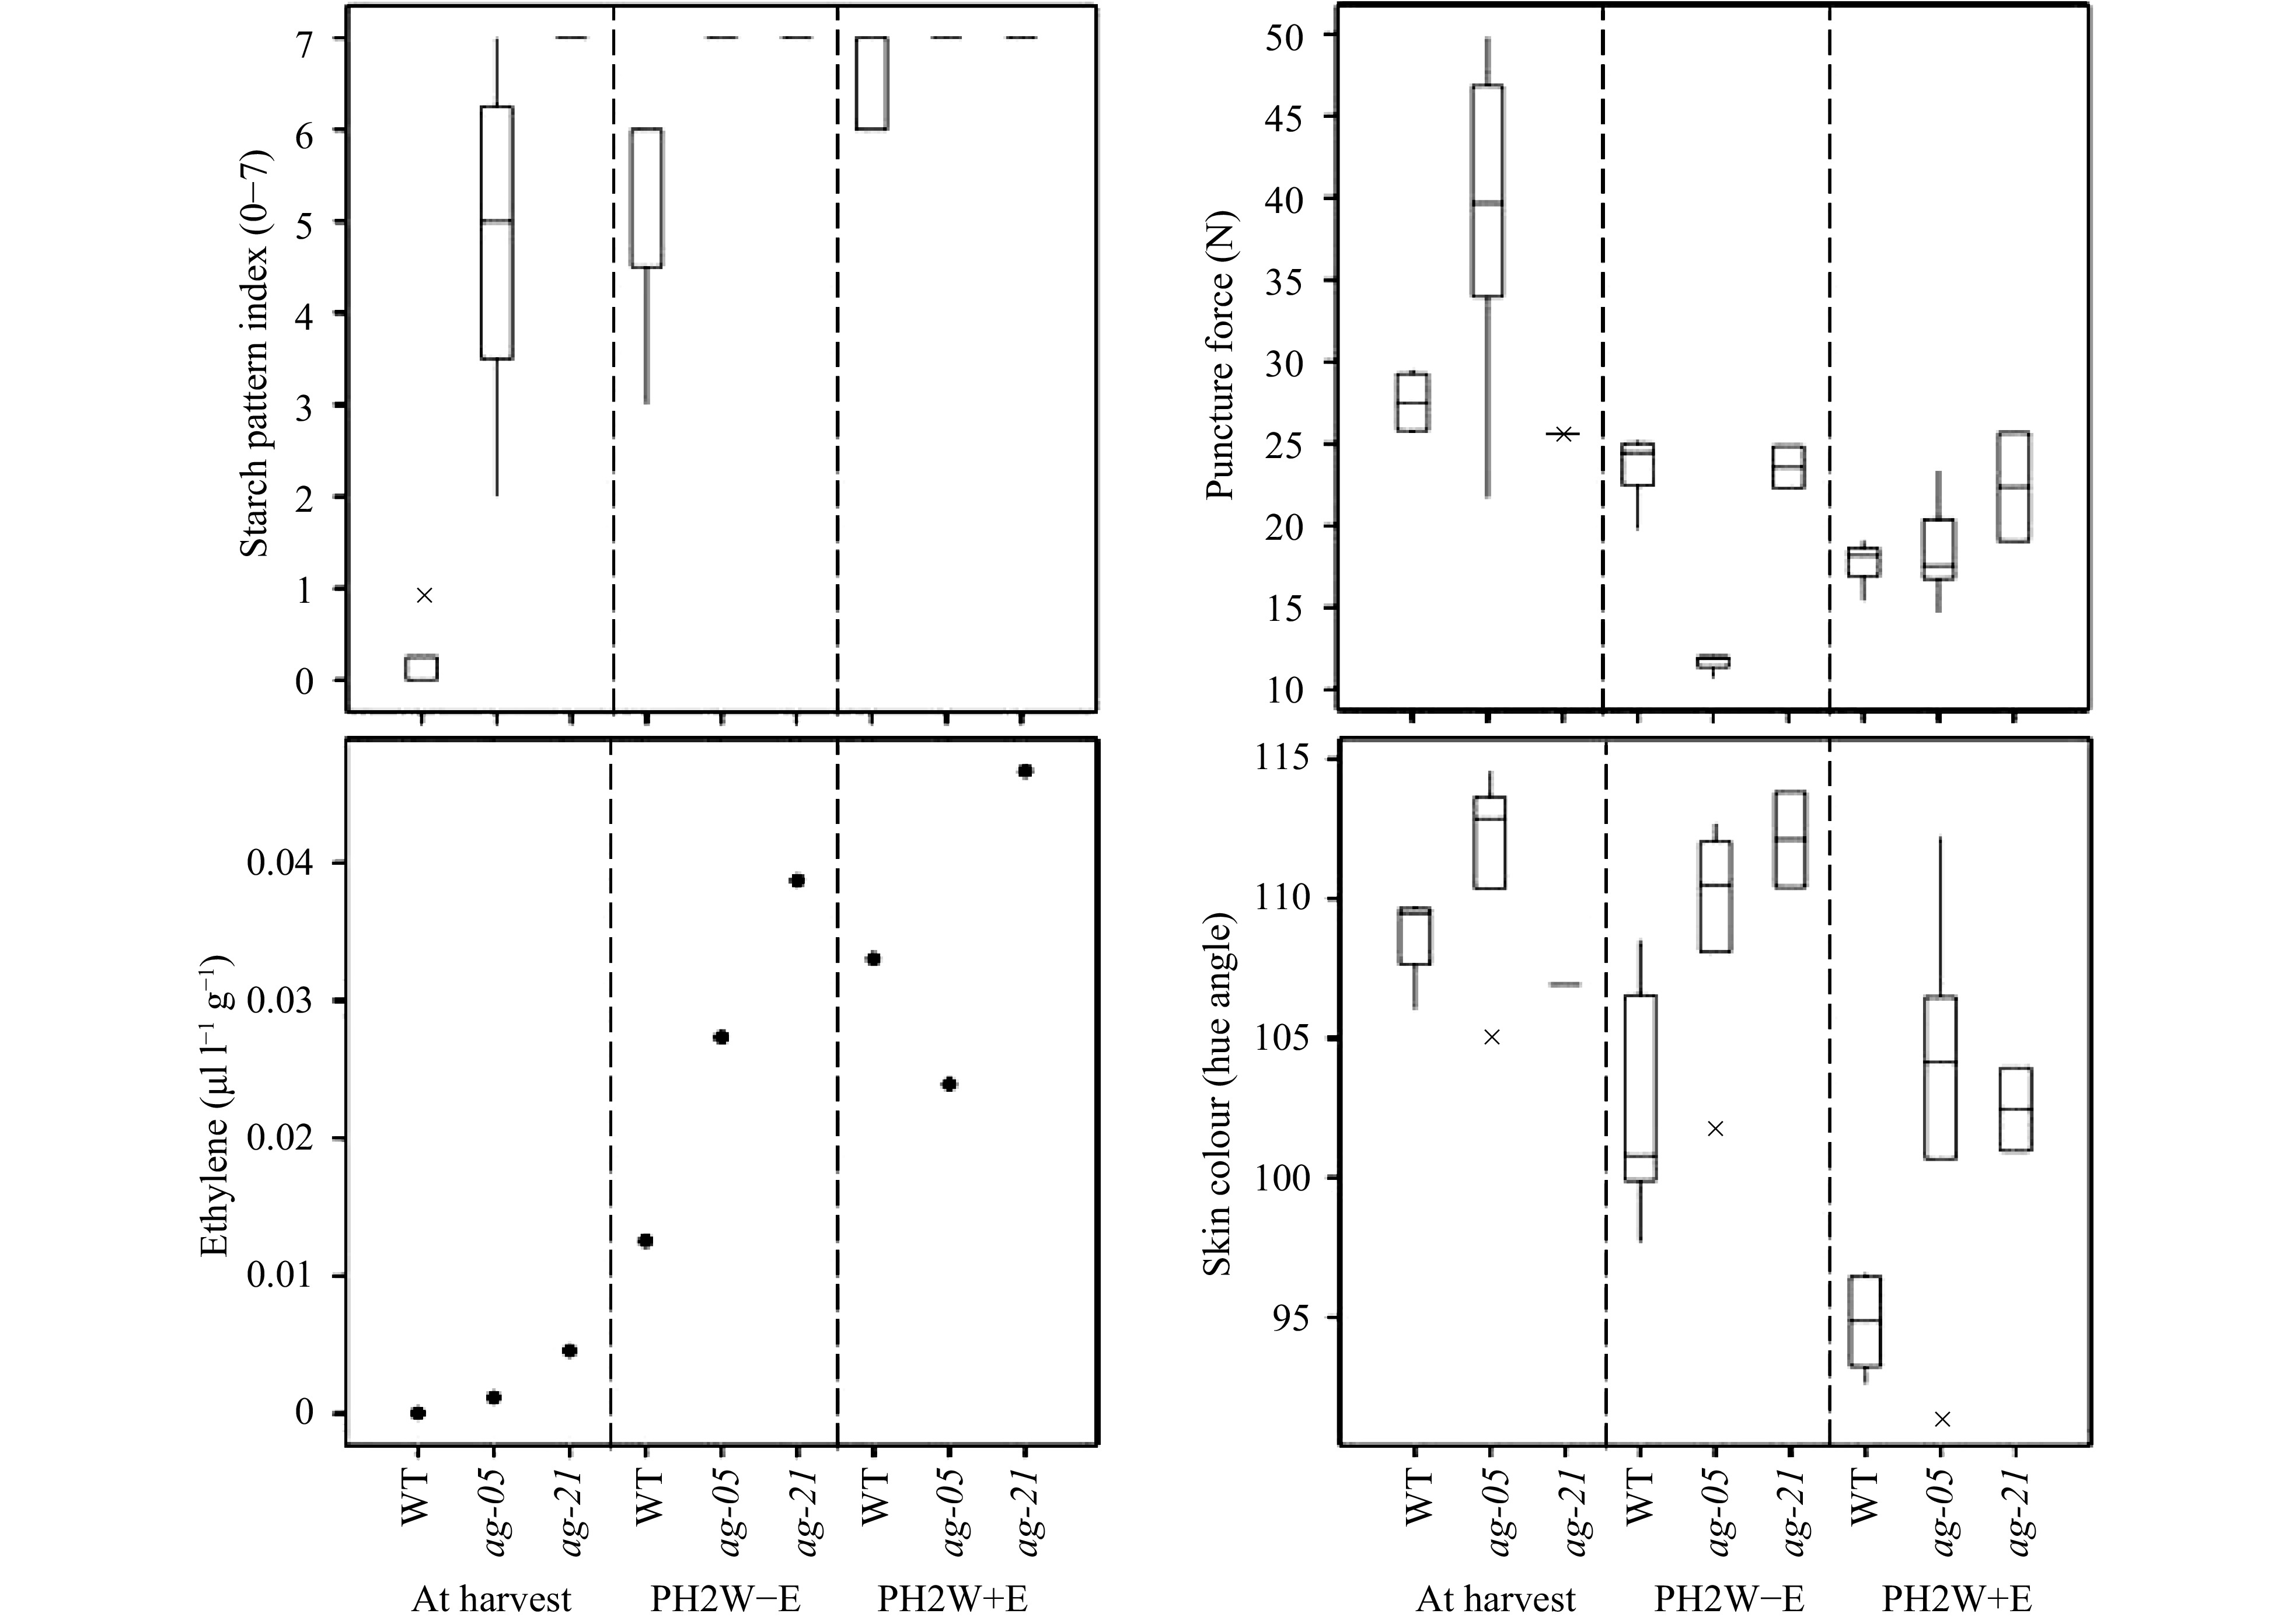
Figure 5. Fruit ripening in mature pollinated ‘Royal Gala’ (wild-type; WT) (n = 5 fruit), and RNAi lines ag-05 (n = 5 fruit) and ag-21 (n = 1−2 fruit) apples. Starch content on a scale of 1 (high starch) to 8 (no starch), flesh firmness measured by puncture force, emission of ethylene using head space analysis, background skin colour measured by hue angle from green (115) to yellow (95) as observed during ripening. PH2W−E are postharvest fruit ripened for 2 weeks at room temperature in the absence of ethylene, PH2W+E are postharvest fruit ripened for 2 weeks in the presence of 100 ppm ethylene.
-
Year Conditions of hormone treatment Line No. of flowers treated No. of mature fruit 1 Single 1.5 mM GA4 from -7 to -4 DAFB (no auxin treatment) ag-05 65 0 Single 1.5 mM GA4 from -7 to -4 DAFB with daily 5.7 µM IAA from 0 to 1 DAFB, until appearance of yellowing ag-05 55 0 Daily 5.7 µM IAA from 0 to 1 DAFB, until appearance of yellowing ag-05 50 0 2 602 µM GA4, 5.7 µM IAA, beginning -7 DAFB, repeated every 3−4 days for 2 weeks WT 110 5 ag-05 110 1 ag-21 40 0 602 µM GA4, 5.7 µM IAA, 444 µM 6-BAP, beginning -7 DAFB, repeated every 3−4 days for 2 weeks WT 115 7 ag-05 115 0 ag-21 45 1 No Hormone control, beginning -7 DAFB, repeated every 3−4 days for 2 weeks WT 55 0 ag-05 65 0 ag-21 40 0 3 602 µM GA4, 5.7 µM IAA, 444 µM 6-BAP, beginning -7 DAFB, repeated every 2 days for 3 weeks, then every 3 days for 1 week. ag-05 193 63 ag-21 123 5 Table 1. Hormone treatments to induce pathenocarpy.
Figures
(5)
Tables
(1)