-
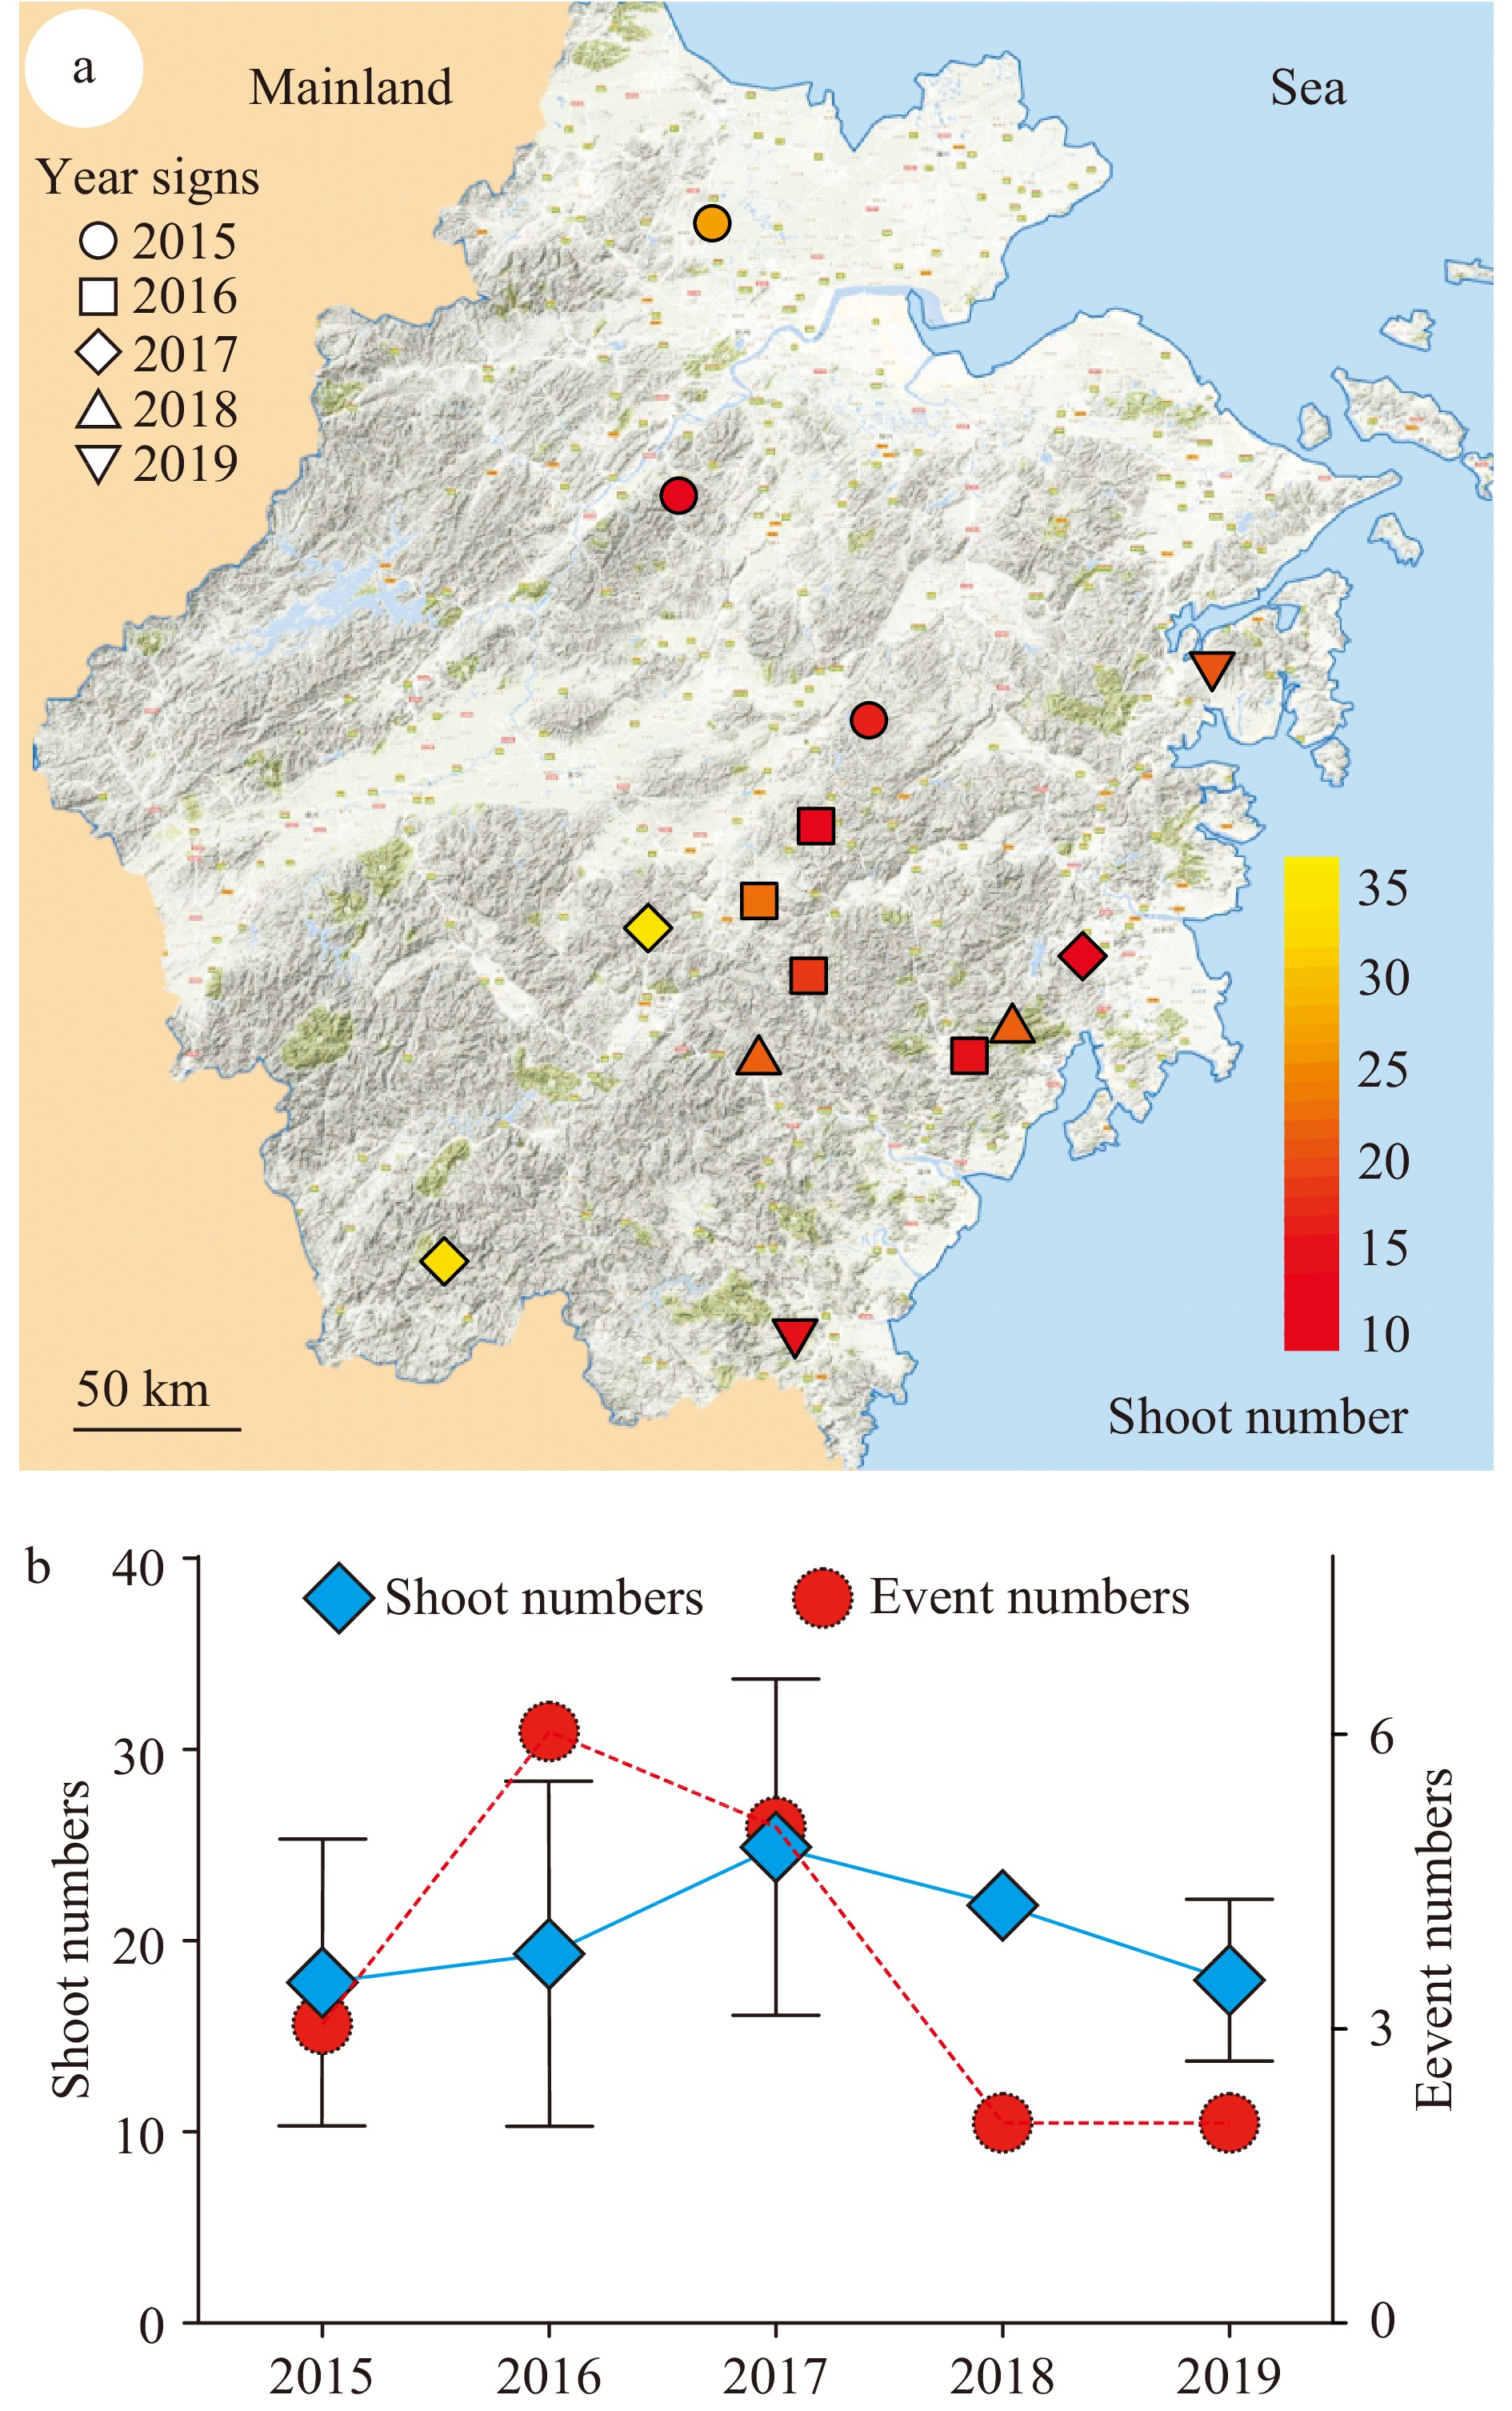
Figure 1. Collection of events of rhizomes with shoot clusters in Zhejiang province. A total of 14 shoot cluster events were recorded. (a) The location of the collected events were marked on the map of Zhejiang province in East China. The recorded events were from 2015–2019, which are represented with different shapes as indicated. The shoot number of each rhizome was from 11–36 as indicated with the color key from red to yellow. Scale bar = 50 km. (b) The number of events recorded each year and the average shoot number of the events for each year were presented. Red circles indicate event number. Blue rhombus indicate yearly average shoot number.
-
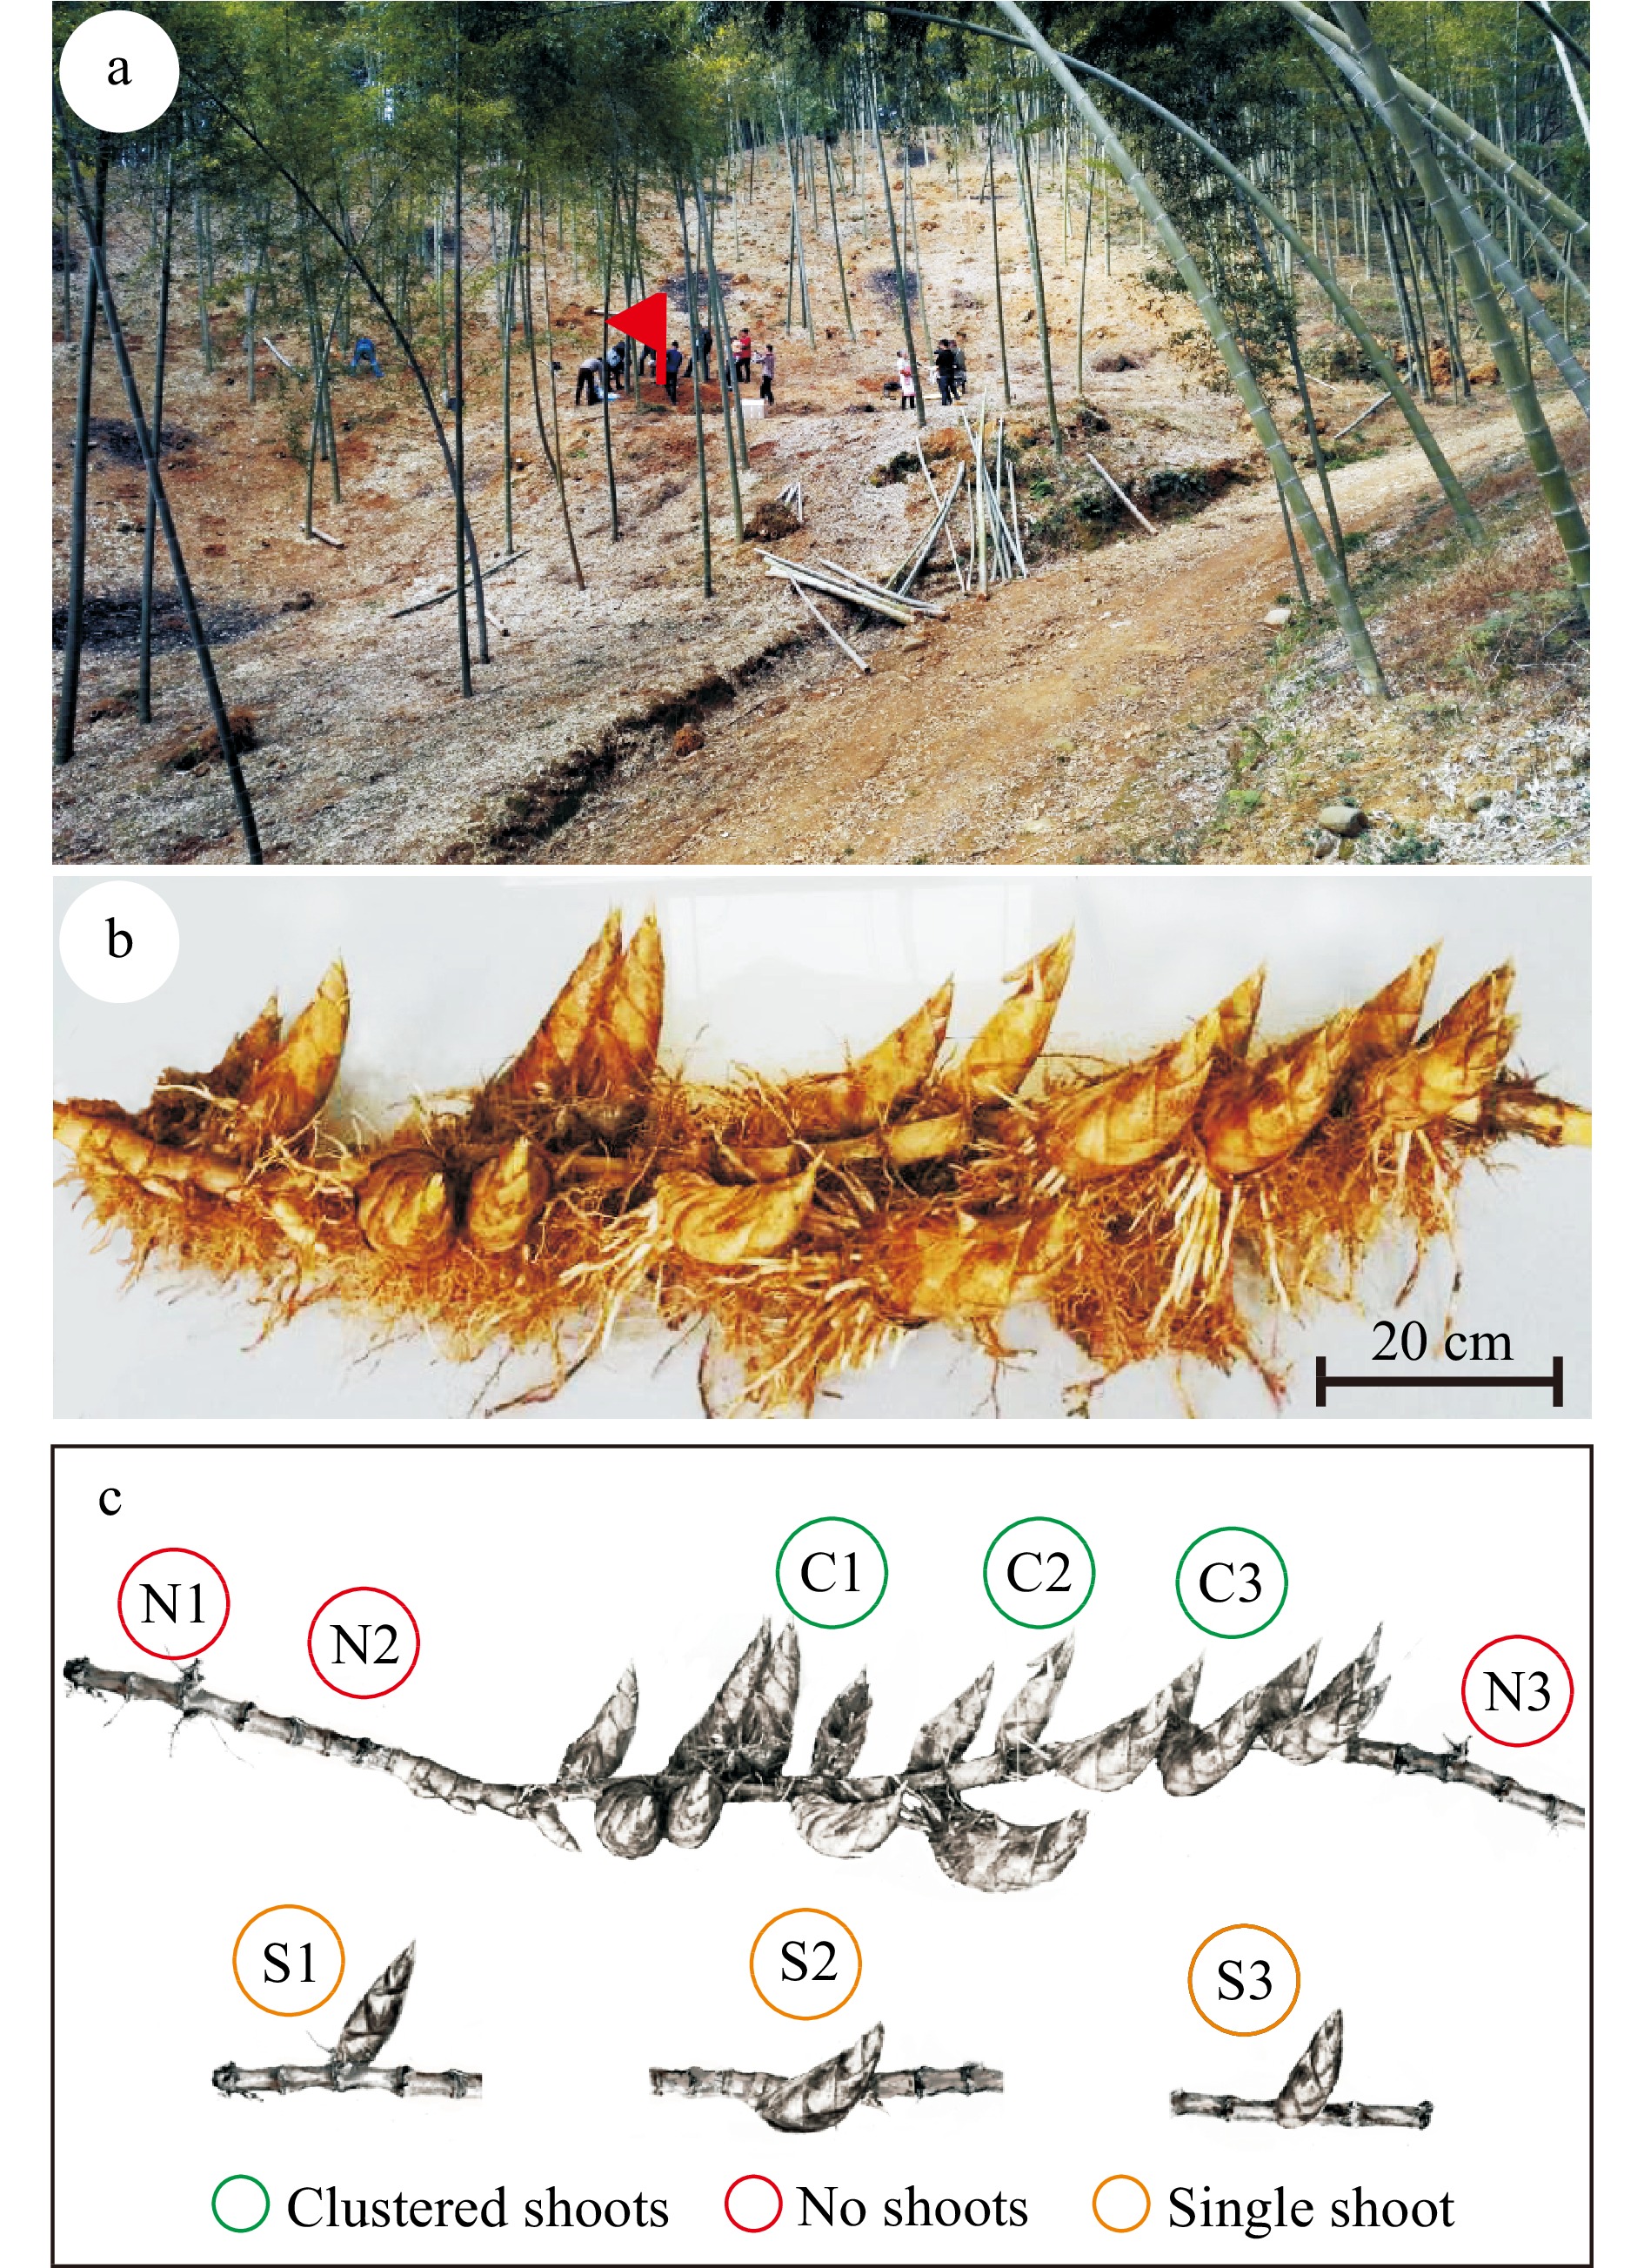
Figure 2. A rhizome with clustered shoots from a moso bamboo plantation. (a) The terrain of the location. The rhizome growing site is indicated with a red flag. (b) Picture of the rhizome with a cluster of 18 shoots. Please note that two shoots are missing from the photograph as they were damaged during harvest. Bar = 20 cm. (c) Schematic diagram of the positions within the rhizome that were sampled for microbial community analysis. Circles with different colors indicate the sampling positions and types.
-
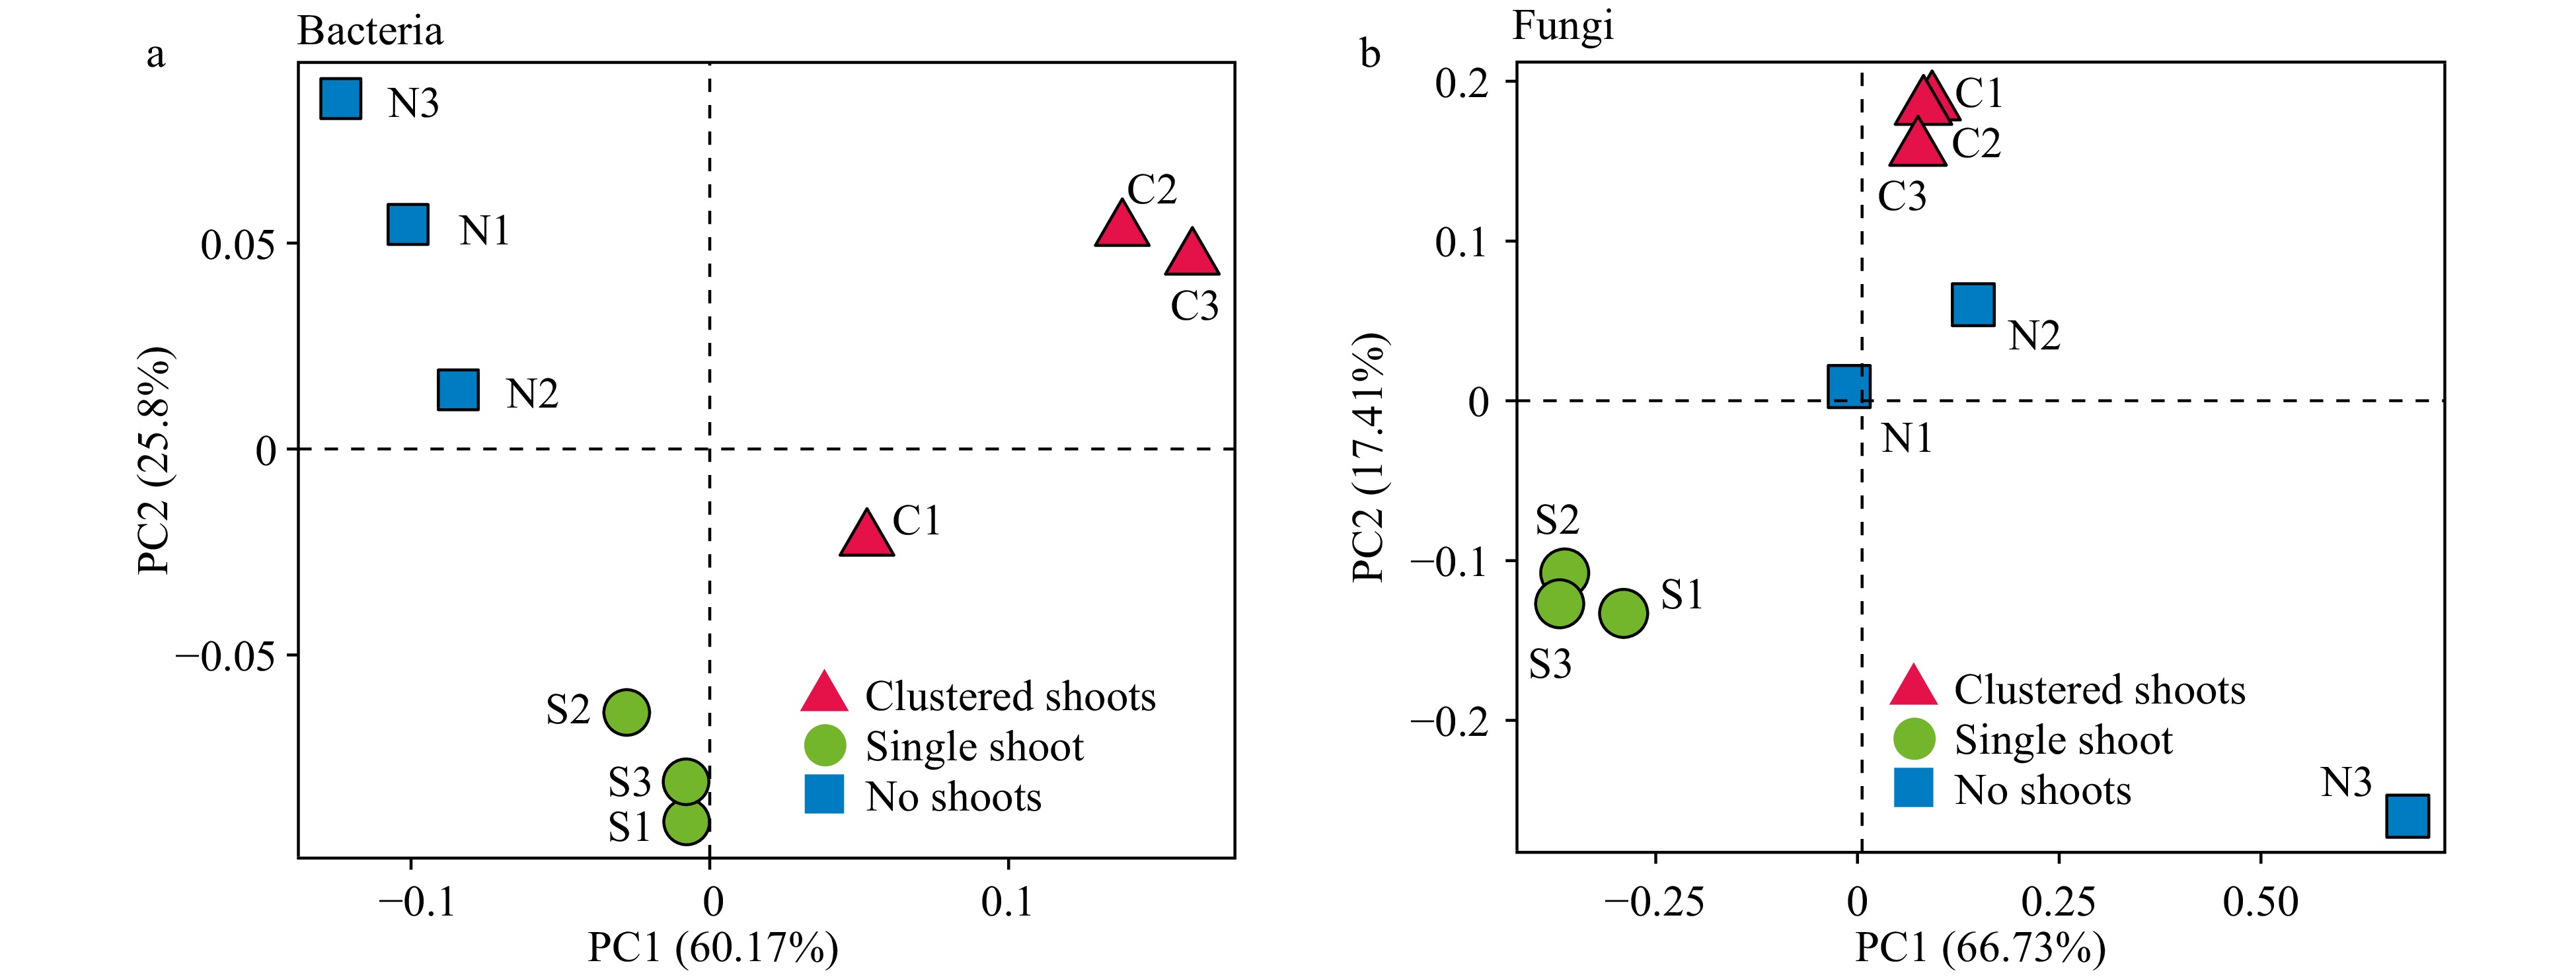
Figure 3. Weighted UniFrac principle component analysis (PCA) of the microbial diversity in three moso bamboo rhizosphere soil sample types. (a) Prokaryotic 16S rDNA gene sequences. Three repeats of each sample type are indicated with red triangles (shoot cluster), green circles (single shoots) and blue square (no shoots). (b) Fungal ITS sequences. Three repeats of each sample type are indicated as in (a).
-
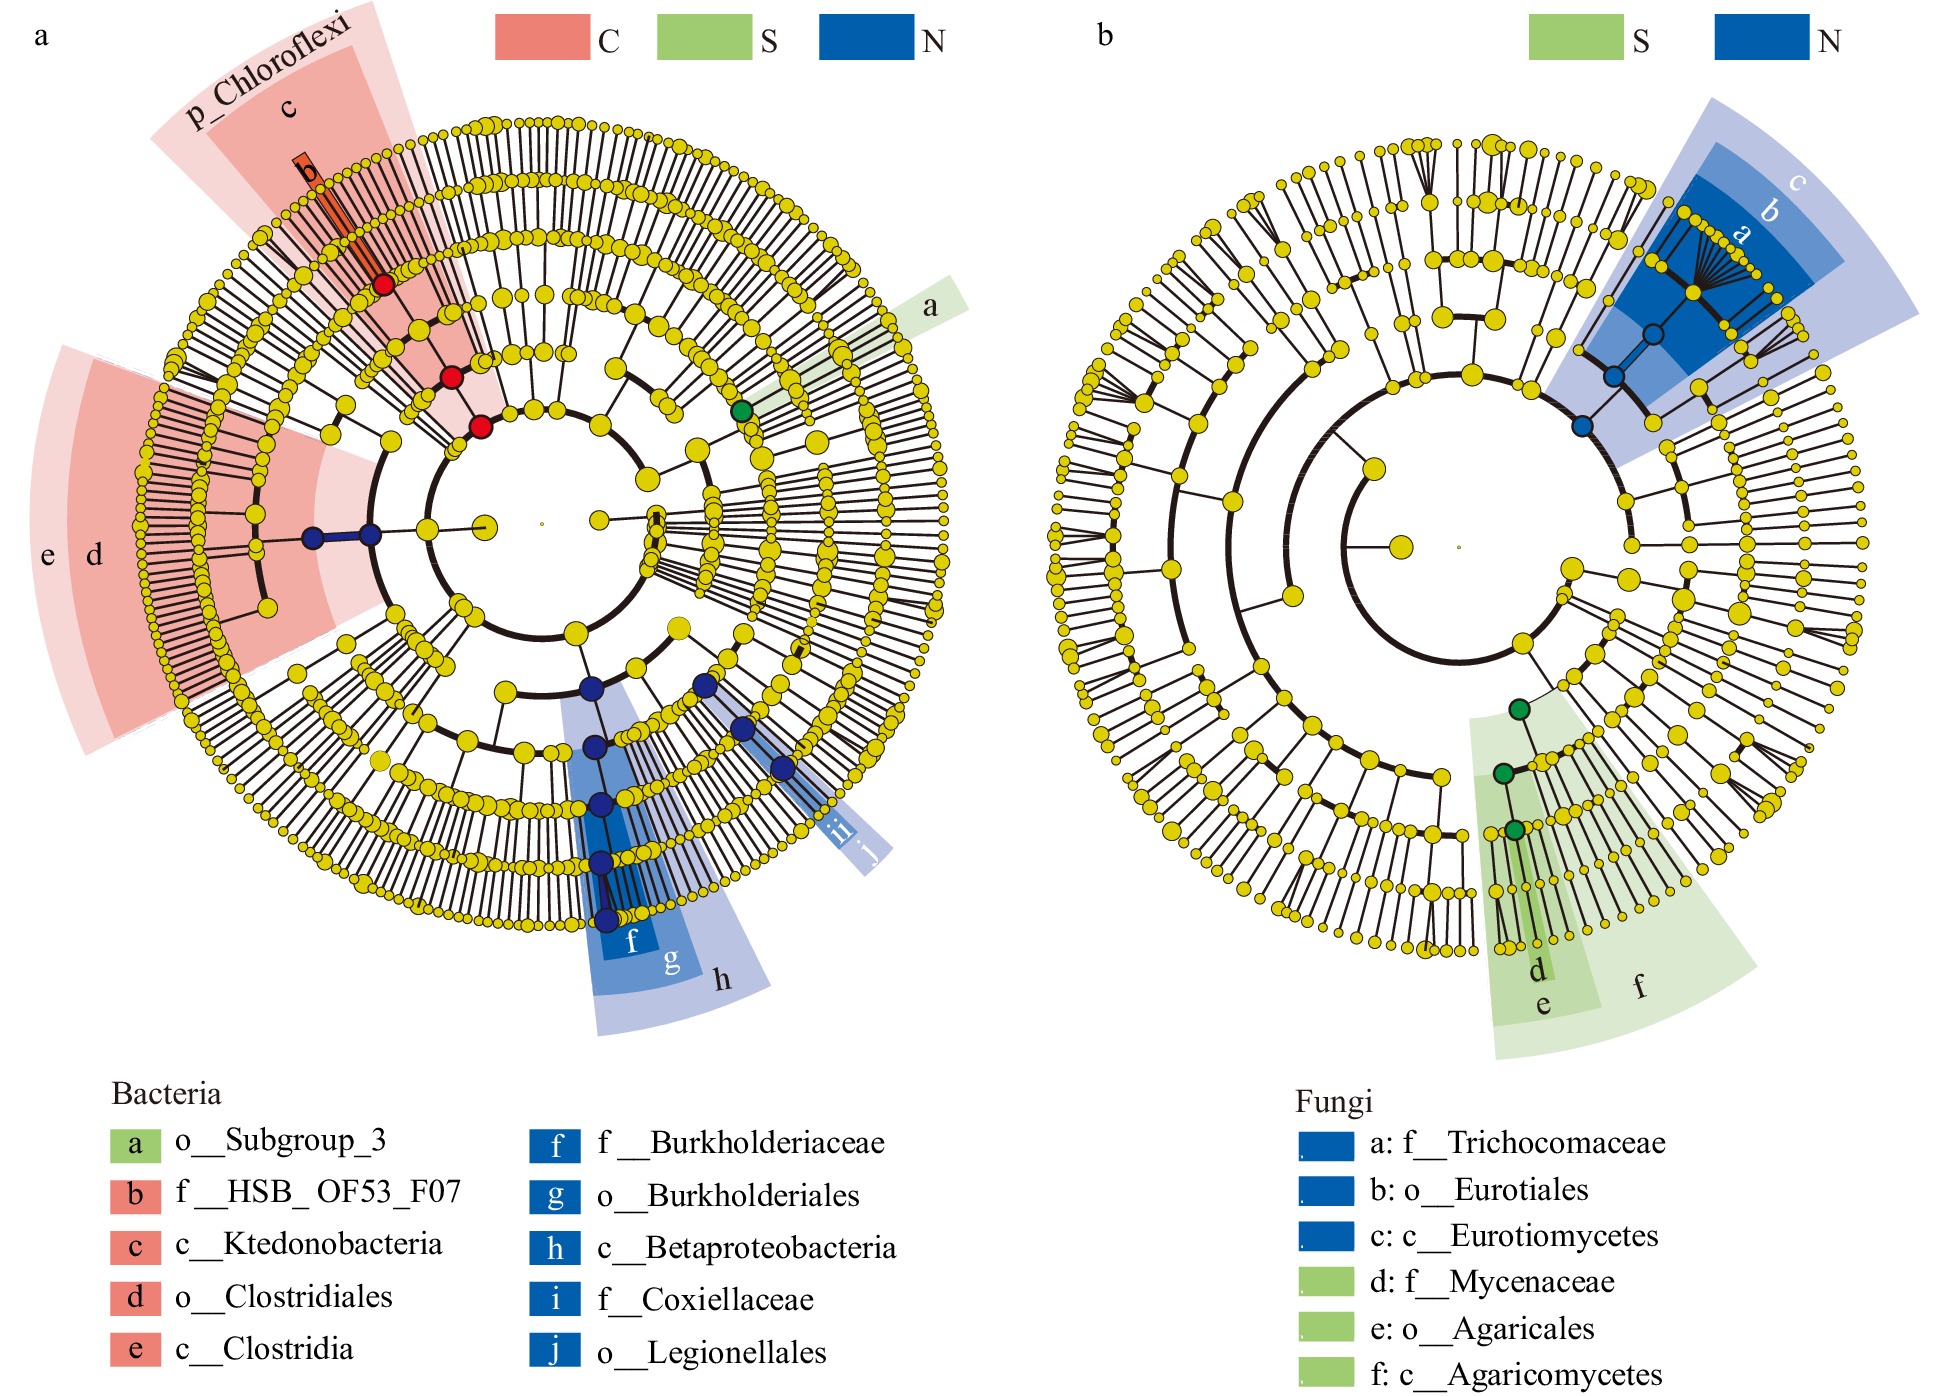
Figure 4. The differential phylogenetic distribution and biomarker microbial taxa of each sample group determined by the linear discriminant analysis (LDA) effect size method. (a) Bacteria. (b) Fungi. LDA scores ≥ 3. Circles indicate phylogenetic levels from phylum to genus. The yellow nodes represent non-significant differential microbes while the nodes in different colors represent the significant differential biomarker microbes. The color sectors indicate sample types as abbreviated: C, clustered shoots, in the pink sector; S, single shoot, in the green sector; N, no shoots, in the blue sector.
-
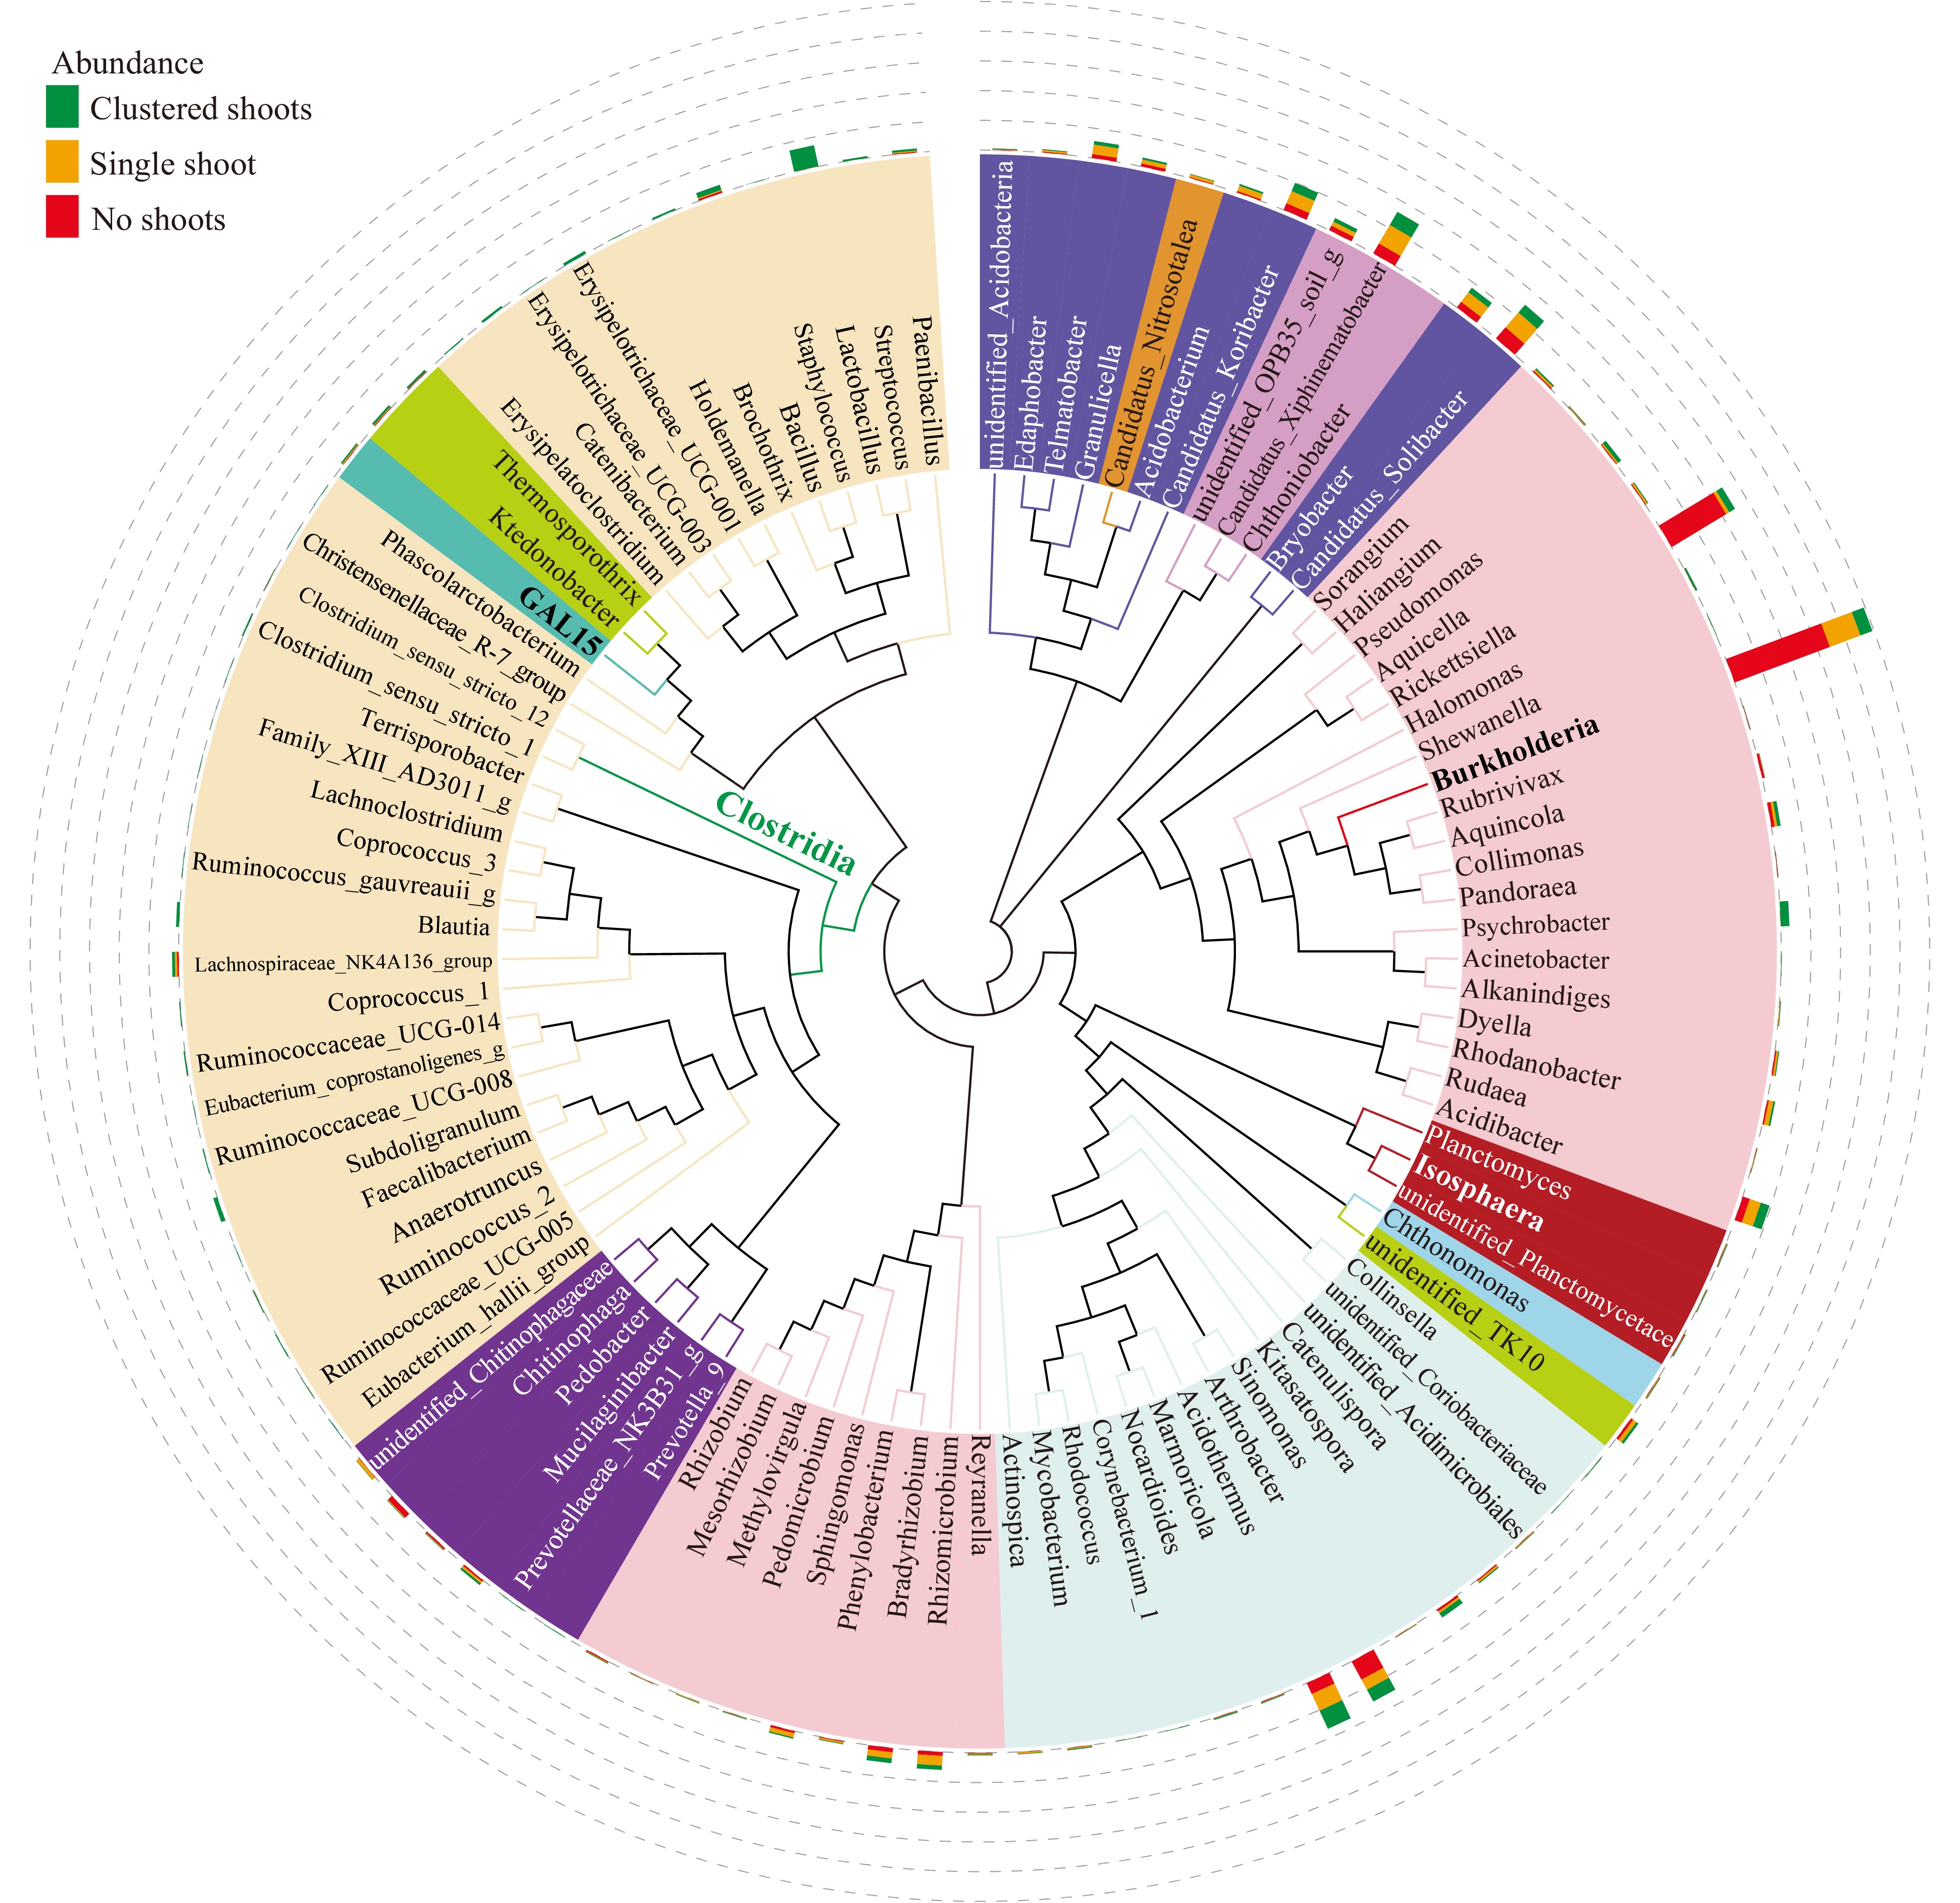
Figure 5. Maximum likelihood phylogeny of the 100 most abundant taxa. Phylogenetic tree based on the most abundant 16S sequences was generated using MEGA 5 with the maximum likelihood method[77]. The relative abundance of each genus was proportionally represented with colored bars indicating their sample of origin (green, shoot cluster; orange; single shoots; red, no shoots) and plotted in the outer circles as percent of the most abundant taxa (Burkholderia, indicated in bold text).
-
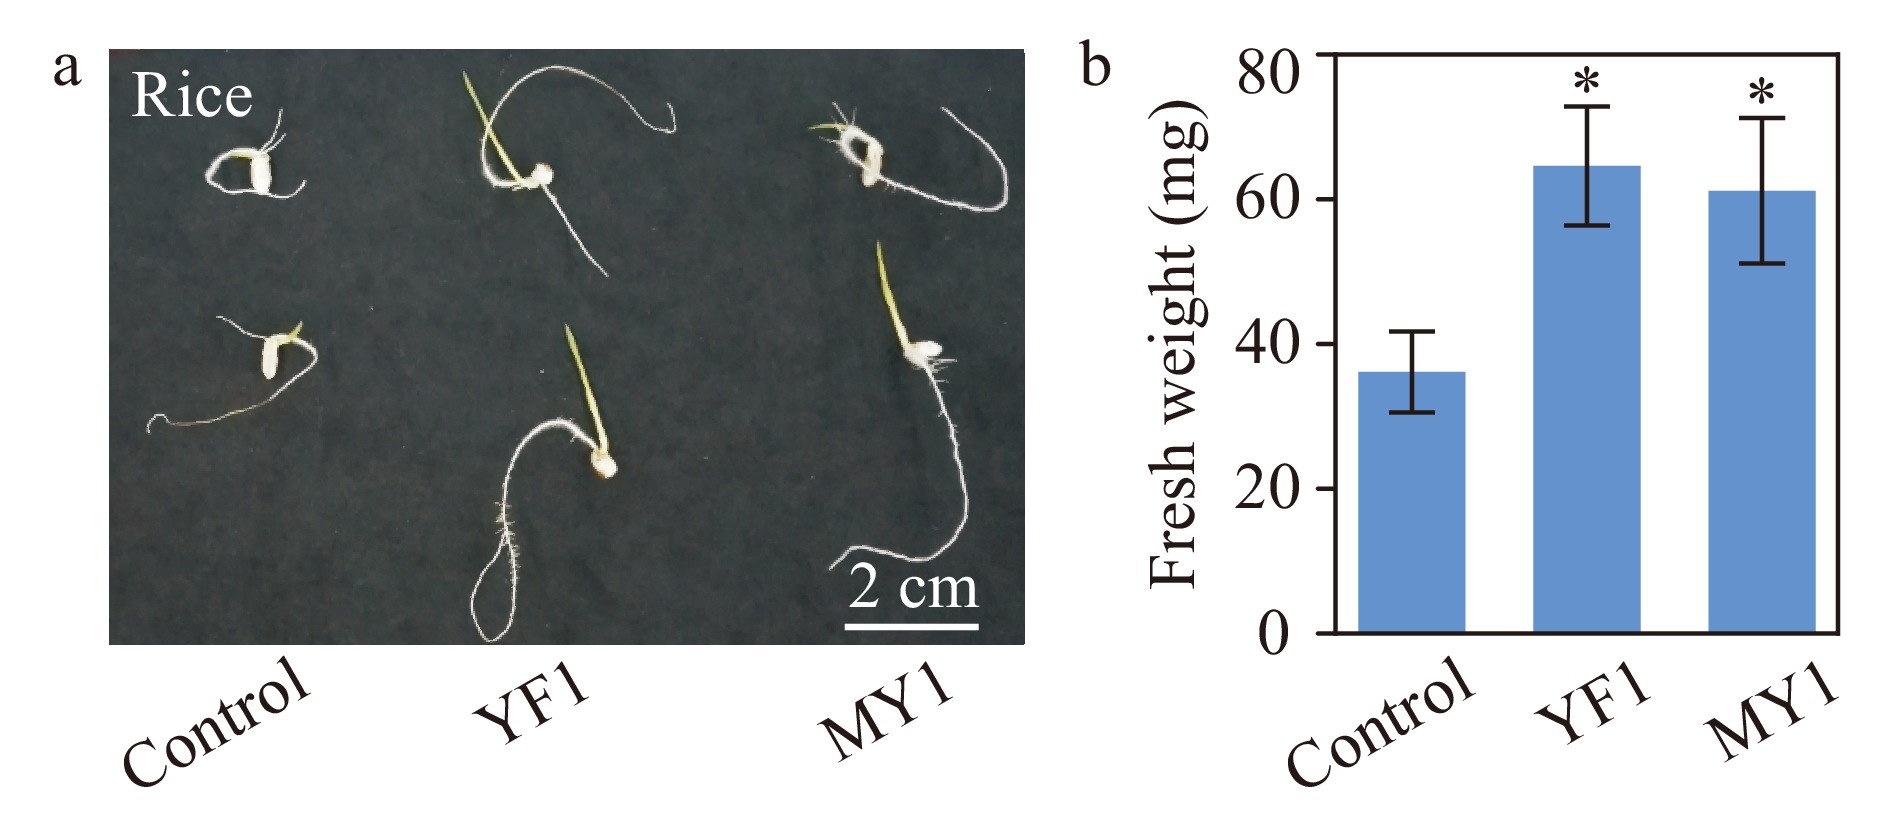
Figure 6. Growth assay of rice seedlings treated with two isolated Burkholderia species. (a) Rice seedlings grown in vitro with or without Burkholderia sp. strain YF1 and MY1. Bar = 2 cm. (b) Quantitative data of fresh weight of rice seedlings treated with strains YF1 and MY1. Error bars represented SD of the means of 20 replicates. This experiment were repeated twice with similar results. * indicates significant groups (t-test, P < 0.05).
-
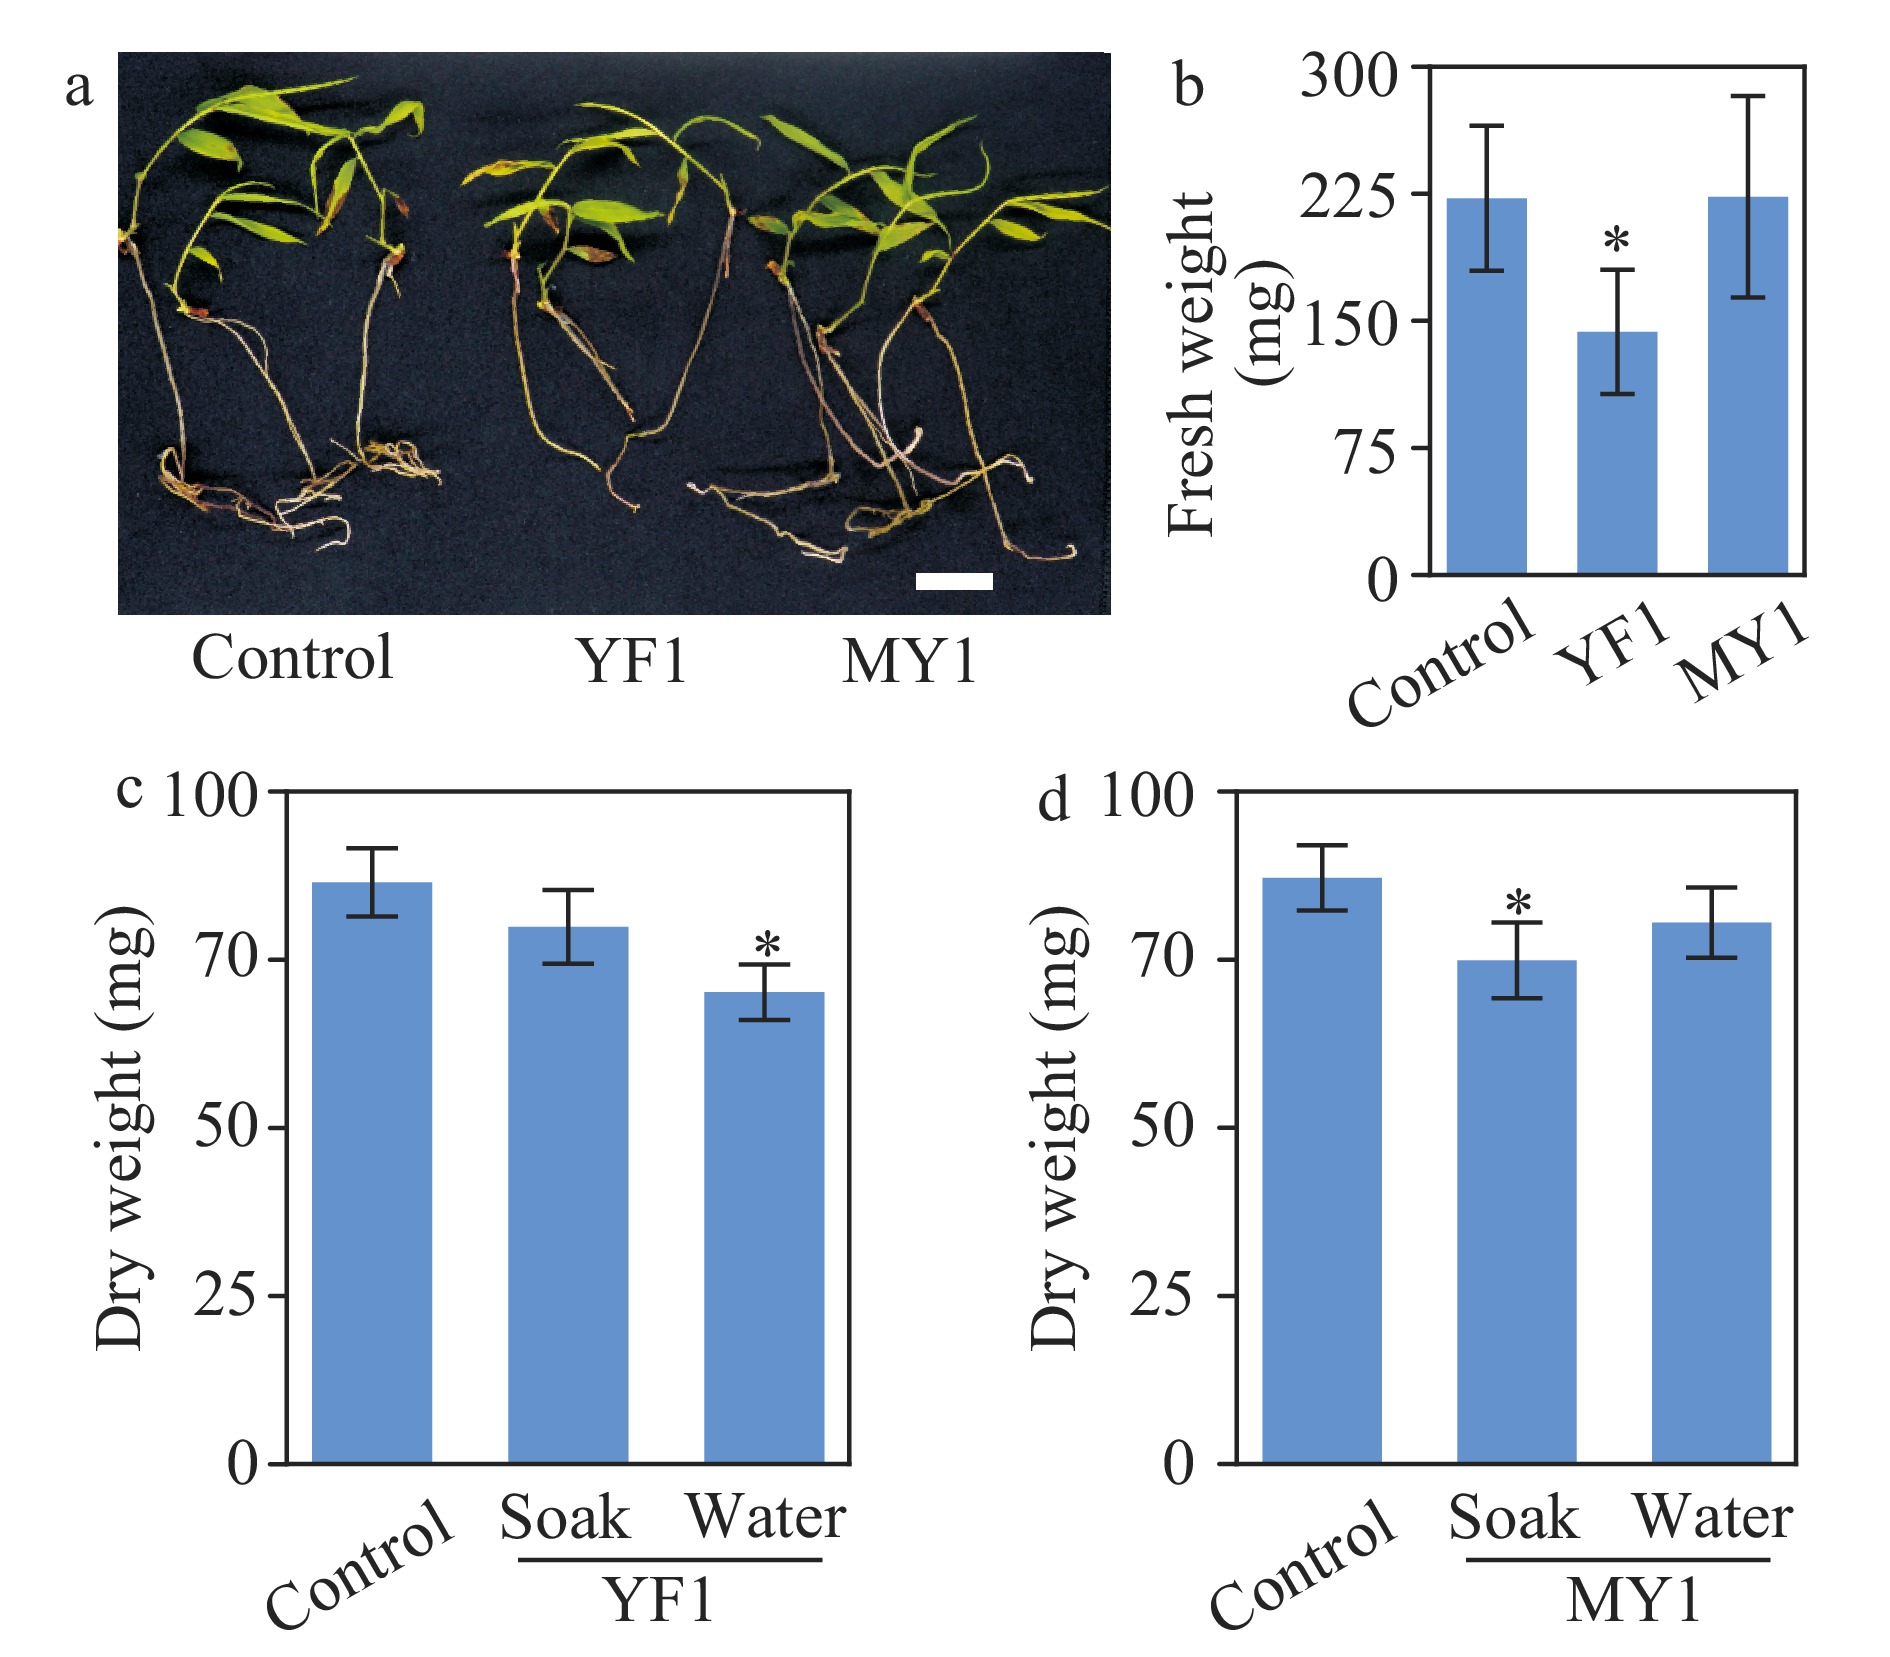
Figure 7. Growth assay of moso bamboo seedlings treated with Burkholderia species strains YF1 and MY1. (a) Photographs of one-month-old seedlings with or without application of strain YF1 or MY1. Bar = 2 cm. (b) Quantitative data of fresh weight of the bamboo seedlings in (a). * indicates significant groups (t-test, P < 0.05). (c, d) Soil-grown bamboo seedlings inoculated with or without strains YF1 or MY1. Inoculation was performed with two methods; soaking bamboo seeds in suspension of strains YF1 or MY1 respectively before sowing (abbreviated as soak), or watering bamboo seedlings with the indicated bacteria suspension three times during growth (abbreviated as water). Data of three repeats were analyzed in a linear mixed model with single-step P-value adjustment. Error bars represent SE of means. * indicates significant groups (P < 0.05).
Figures
(7)
Tables
(0)