-
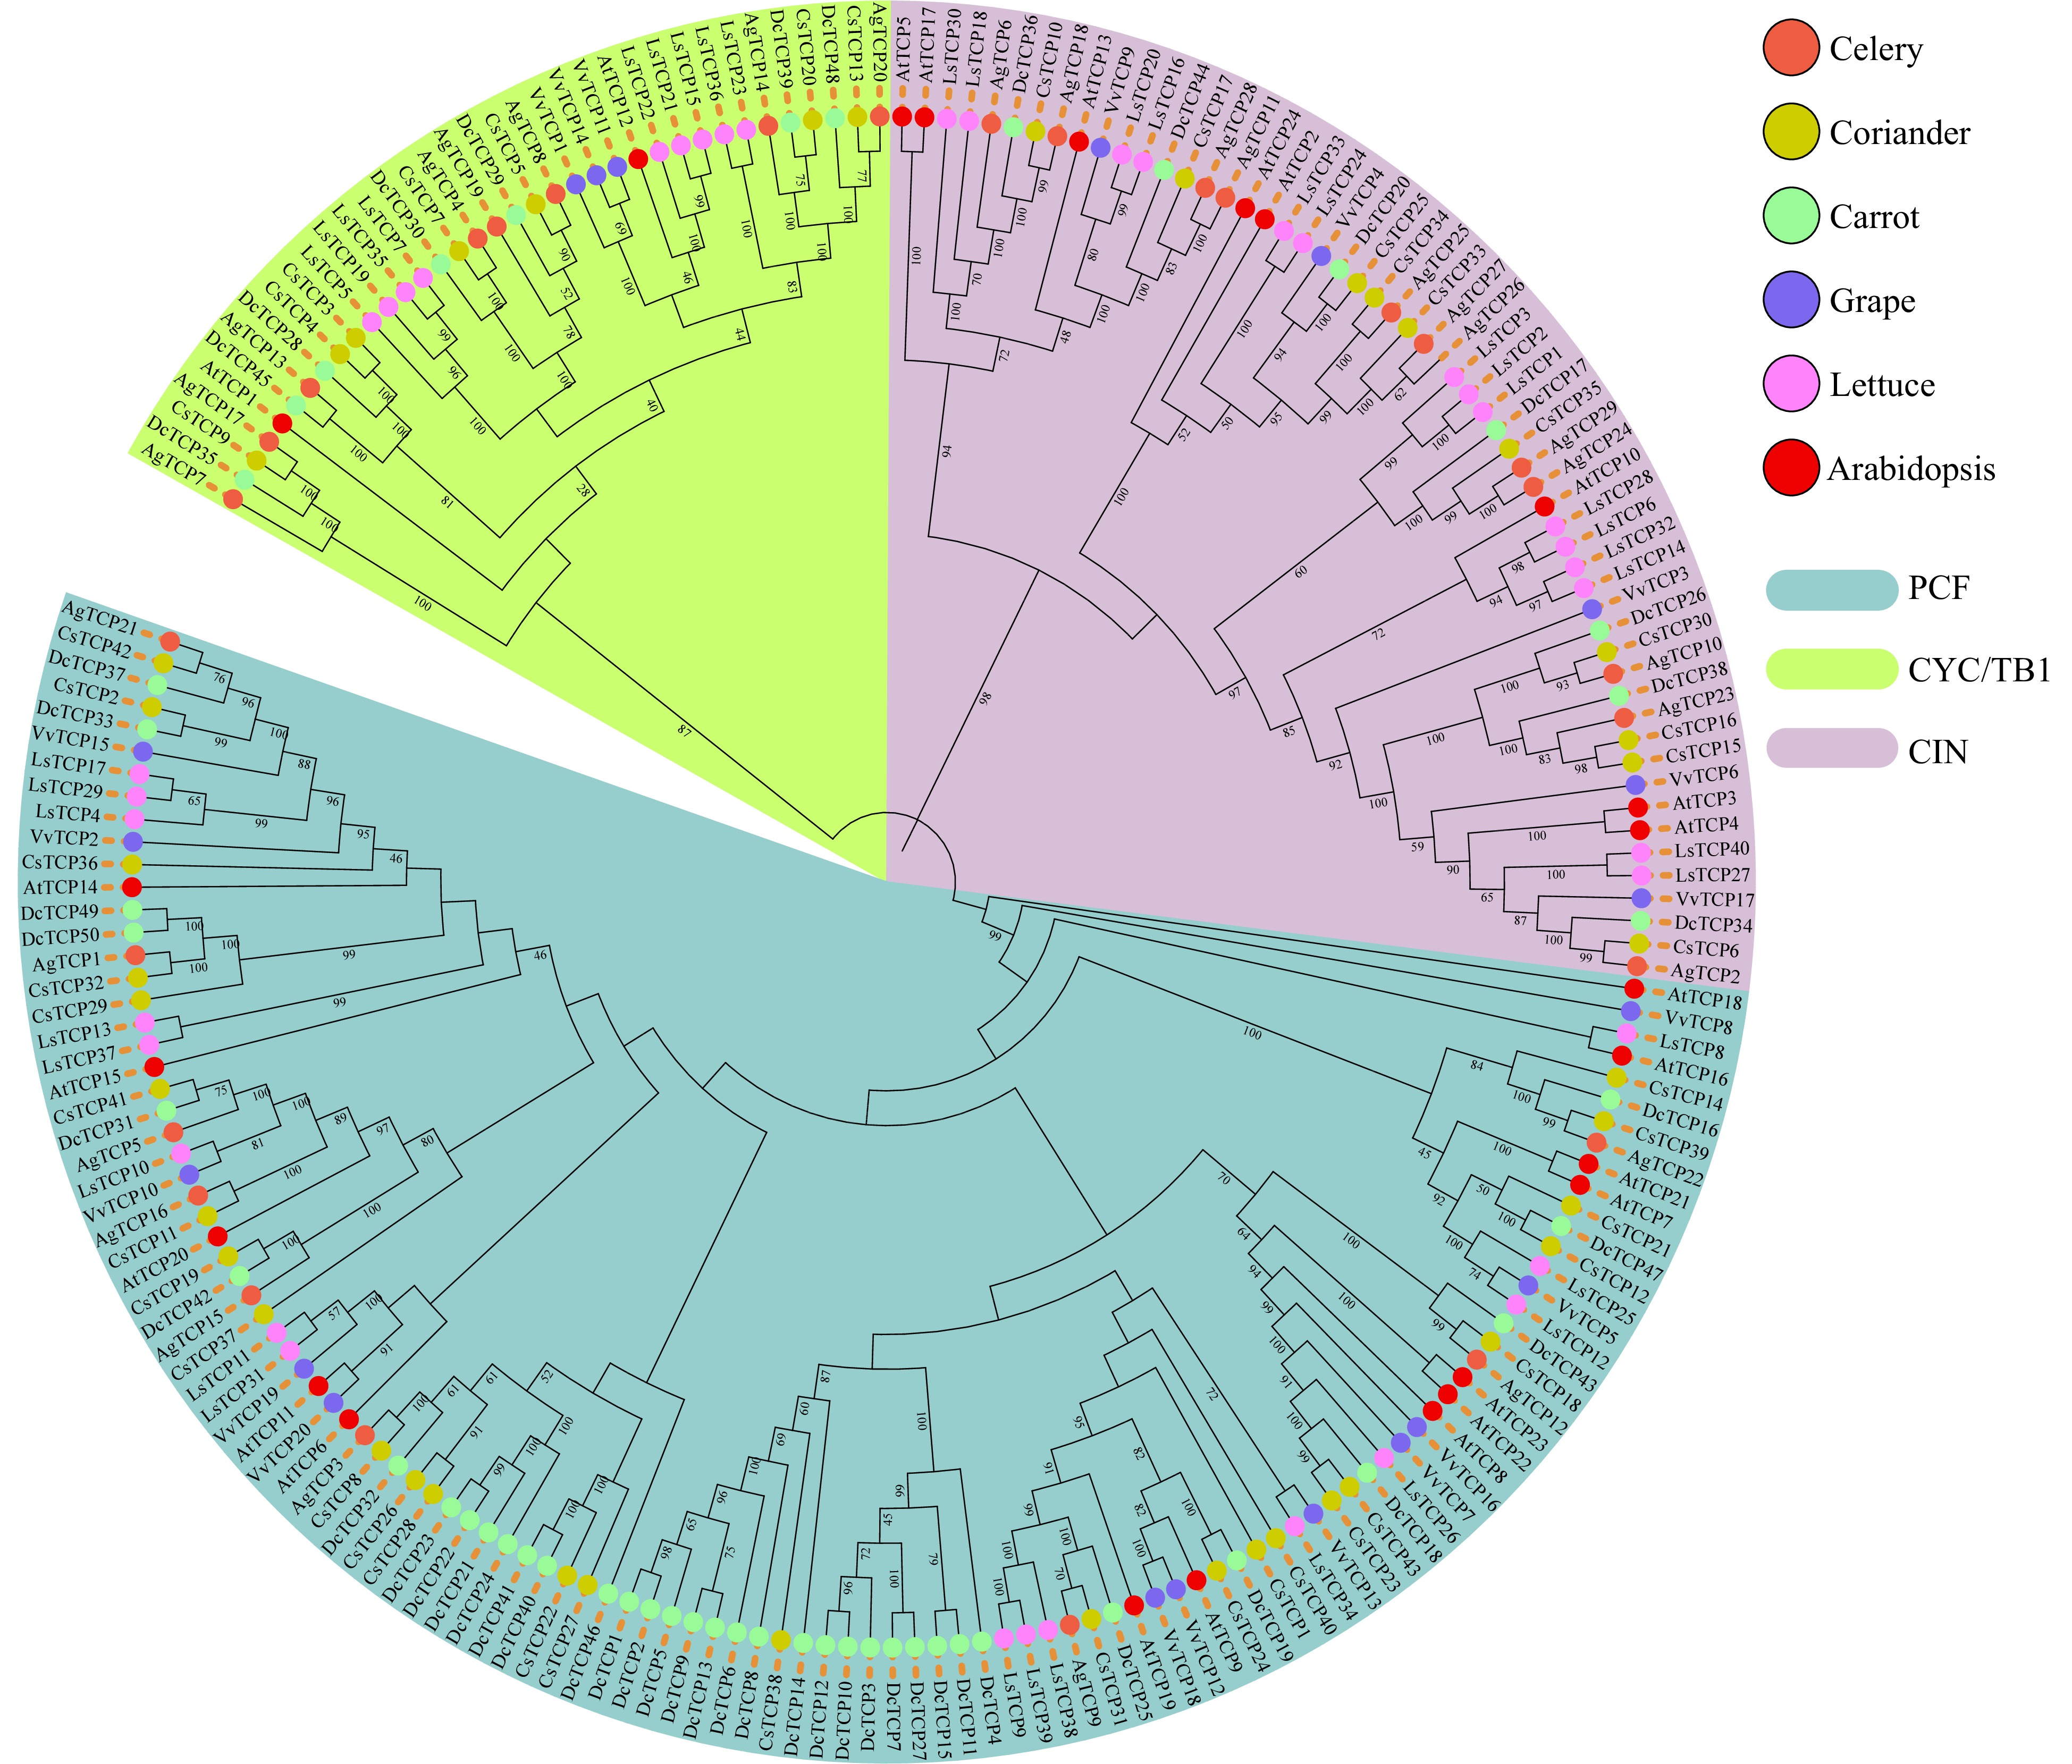
Figure 1. Phylogenetic tree of TCP family genes in three Apiaceae species (carrot, celery and coriander) and lettuce, grape and Arabidopsis. The topology of the phylogenetic tree was determined using IQ-TREE with maximum likelihood (ML) based on the JTT+F+R8 model. The bootstrap was set to 1,000 replicates, and values > 40% are shown. The three classes were identified based on bootstrap values and phylogenetic topology.
-
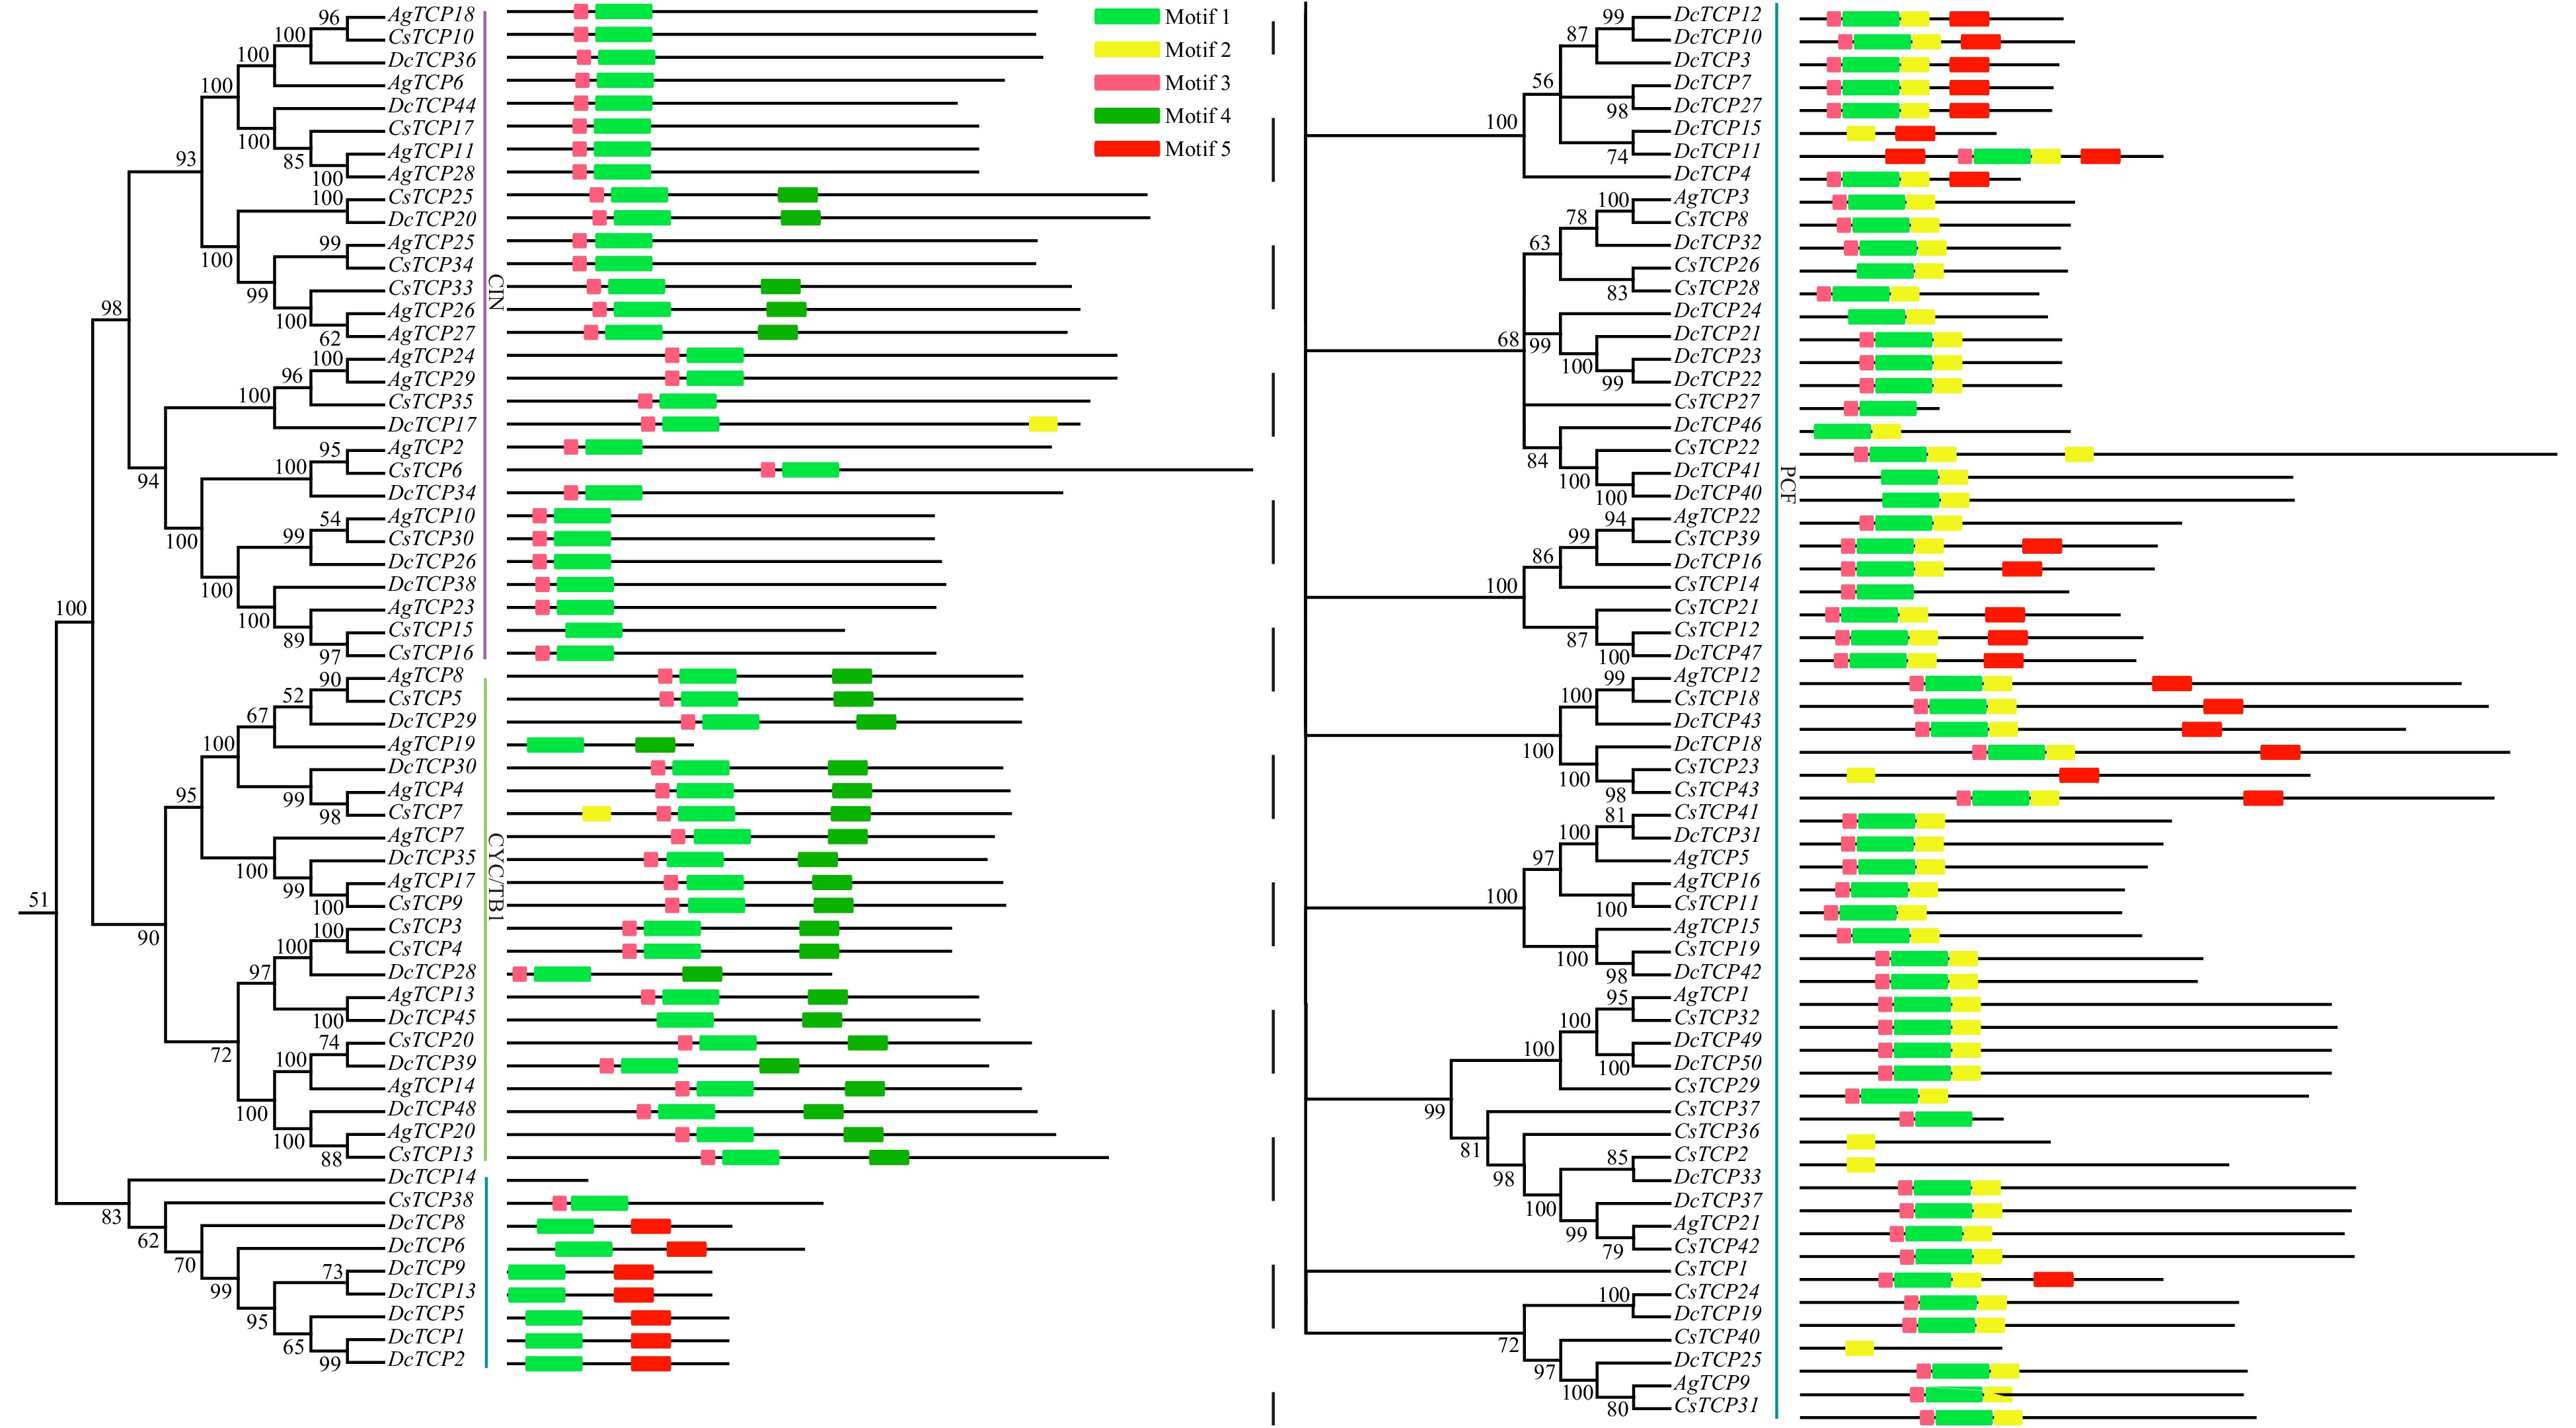
Figure 2. Conversed motifs in TCP family genes of three Apiaceae species.
-
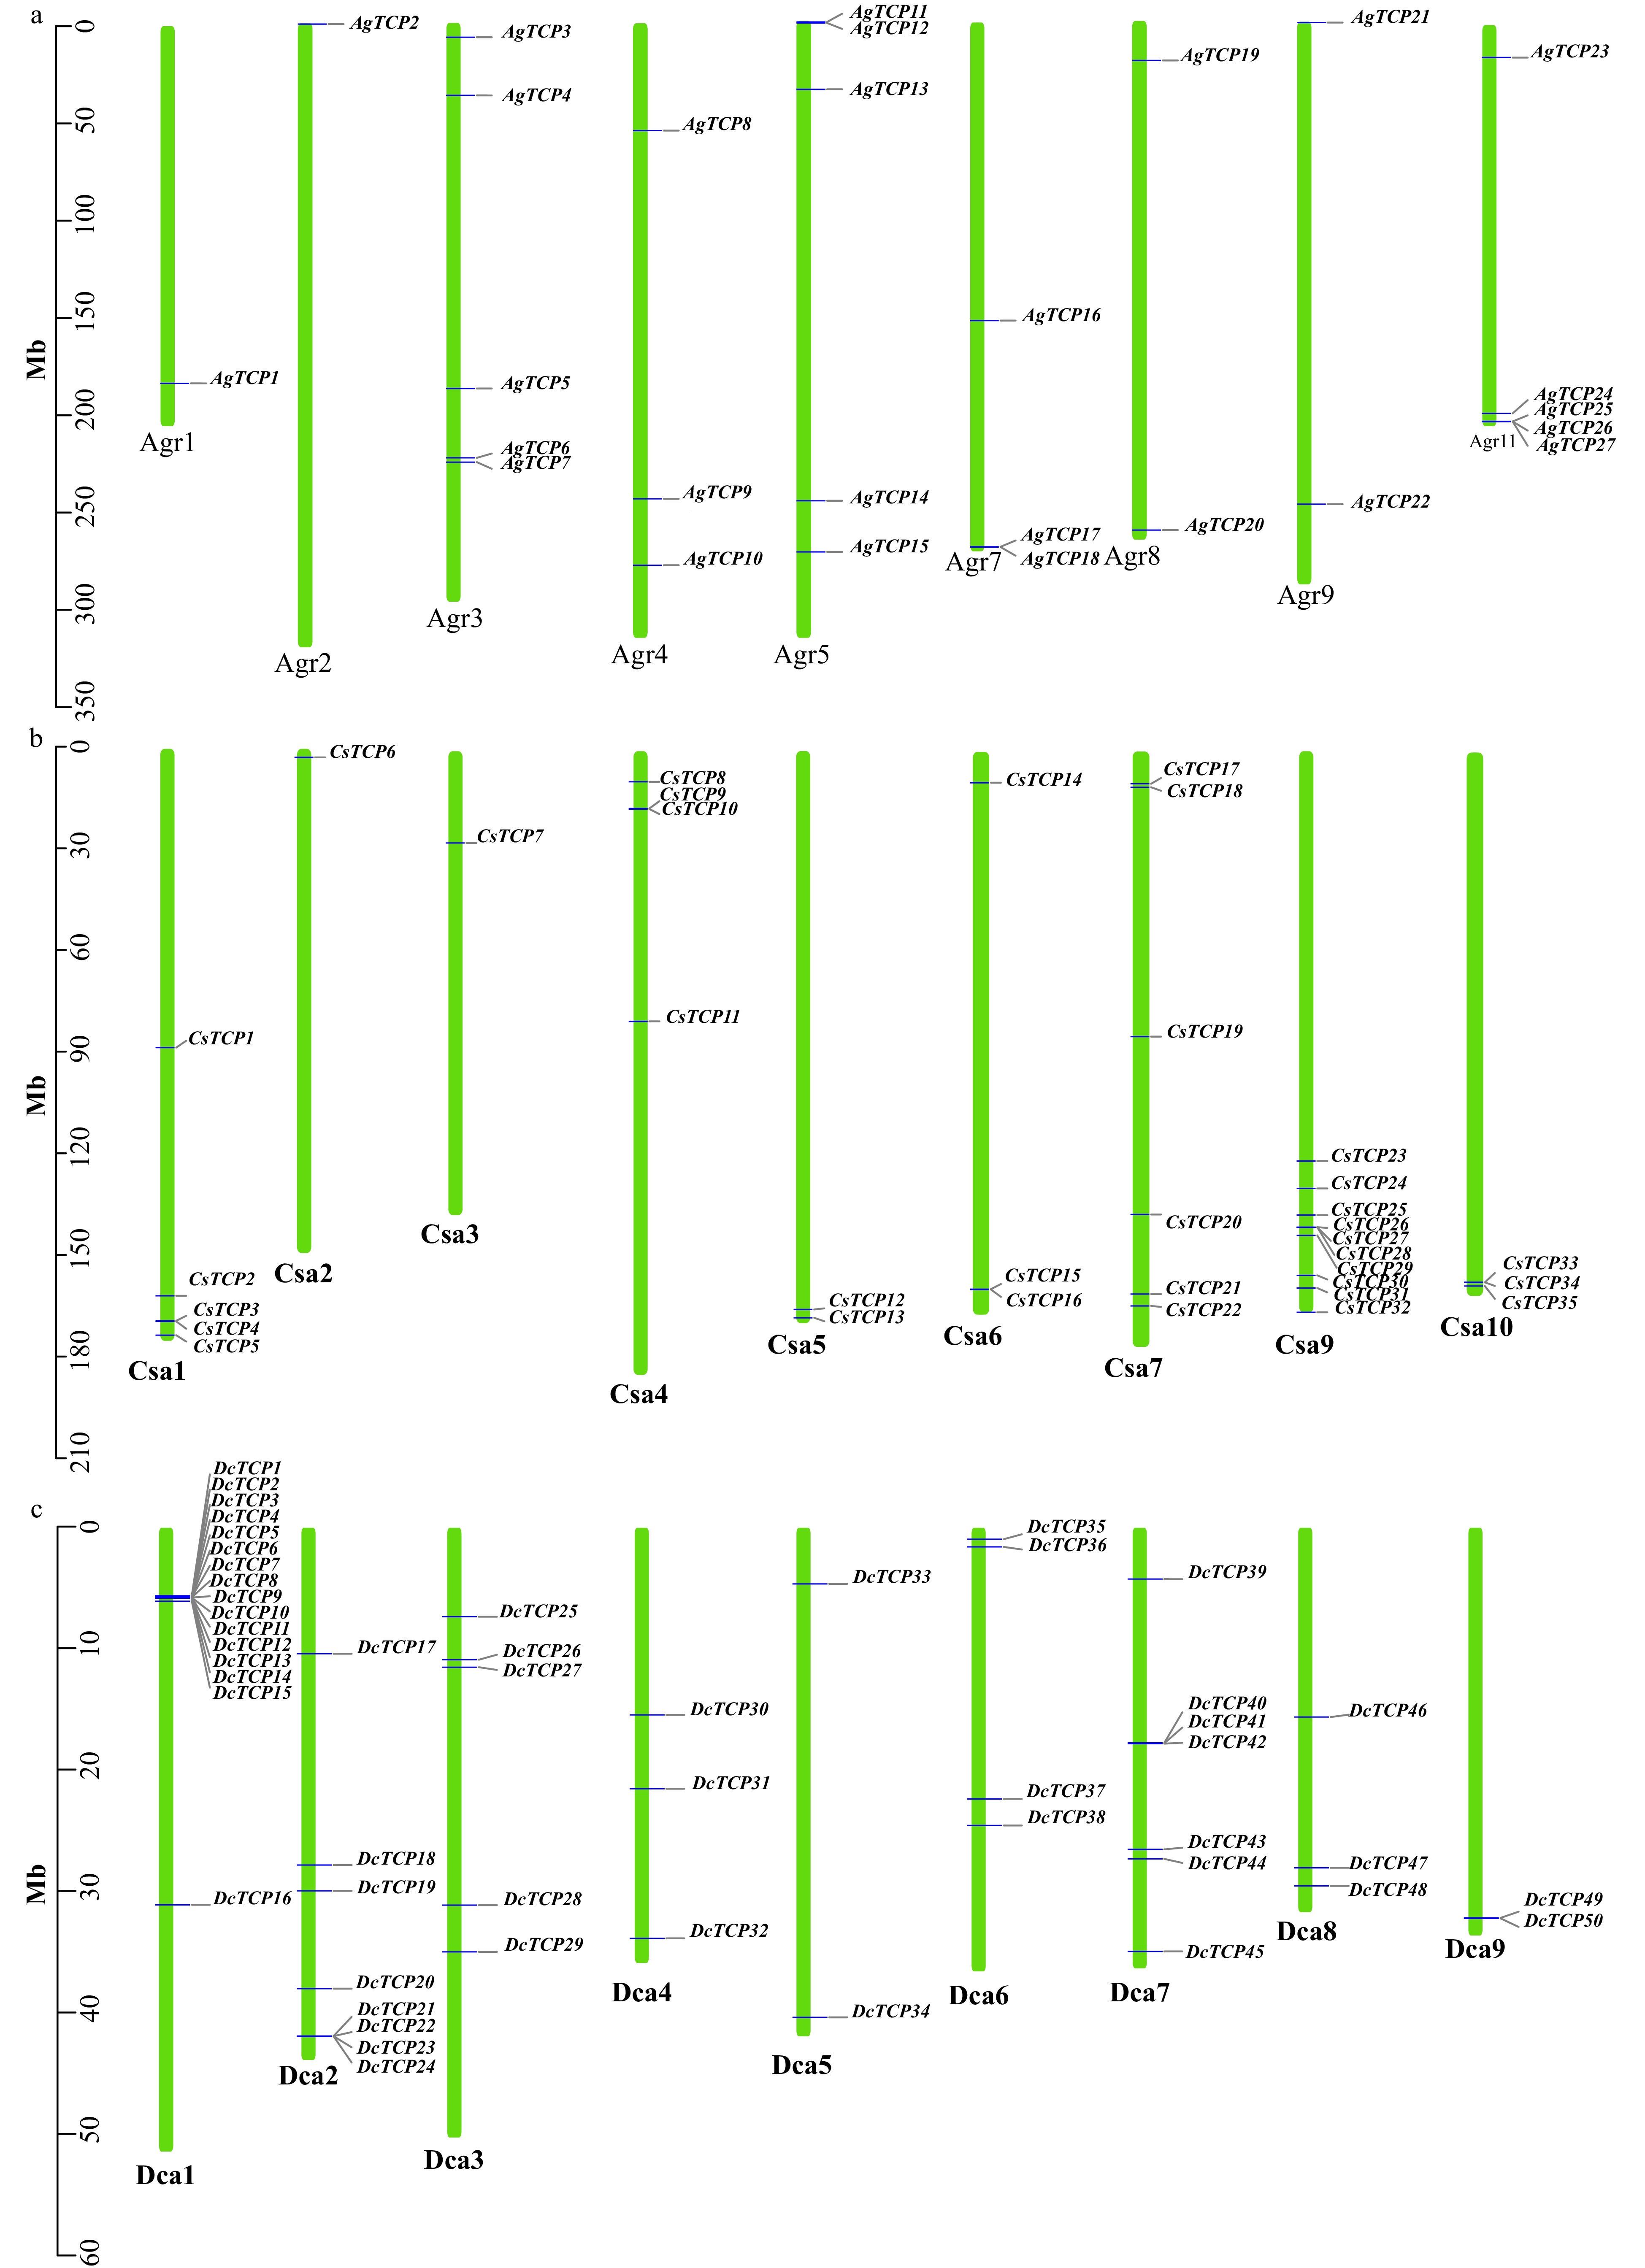
Figure 3. Distribution of TCP transcription factors on each chromosome in three Apiaceae species. (a) Celery, (b) Coriander, (c) Carrot.
-

Figure 4. Circle plot of orthologous TCP gene pairs among three Apiaceae species.
-
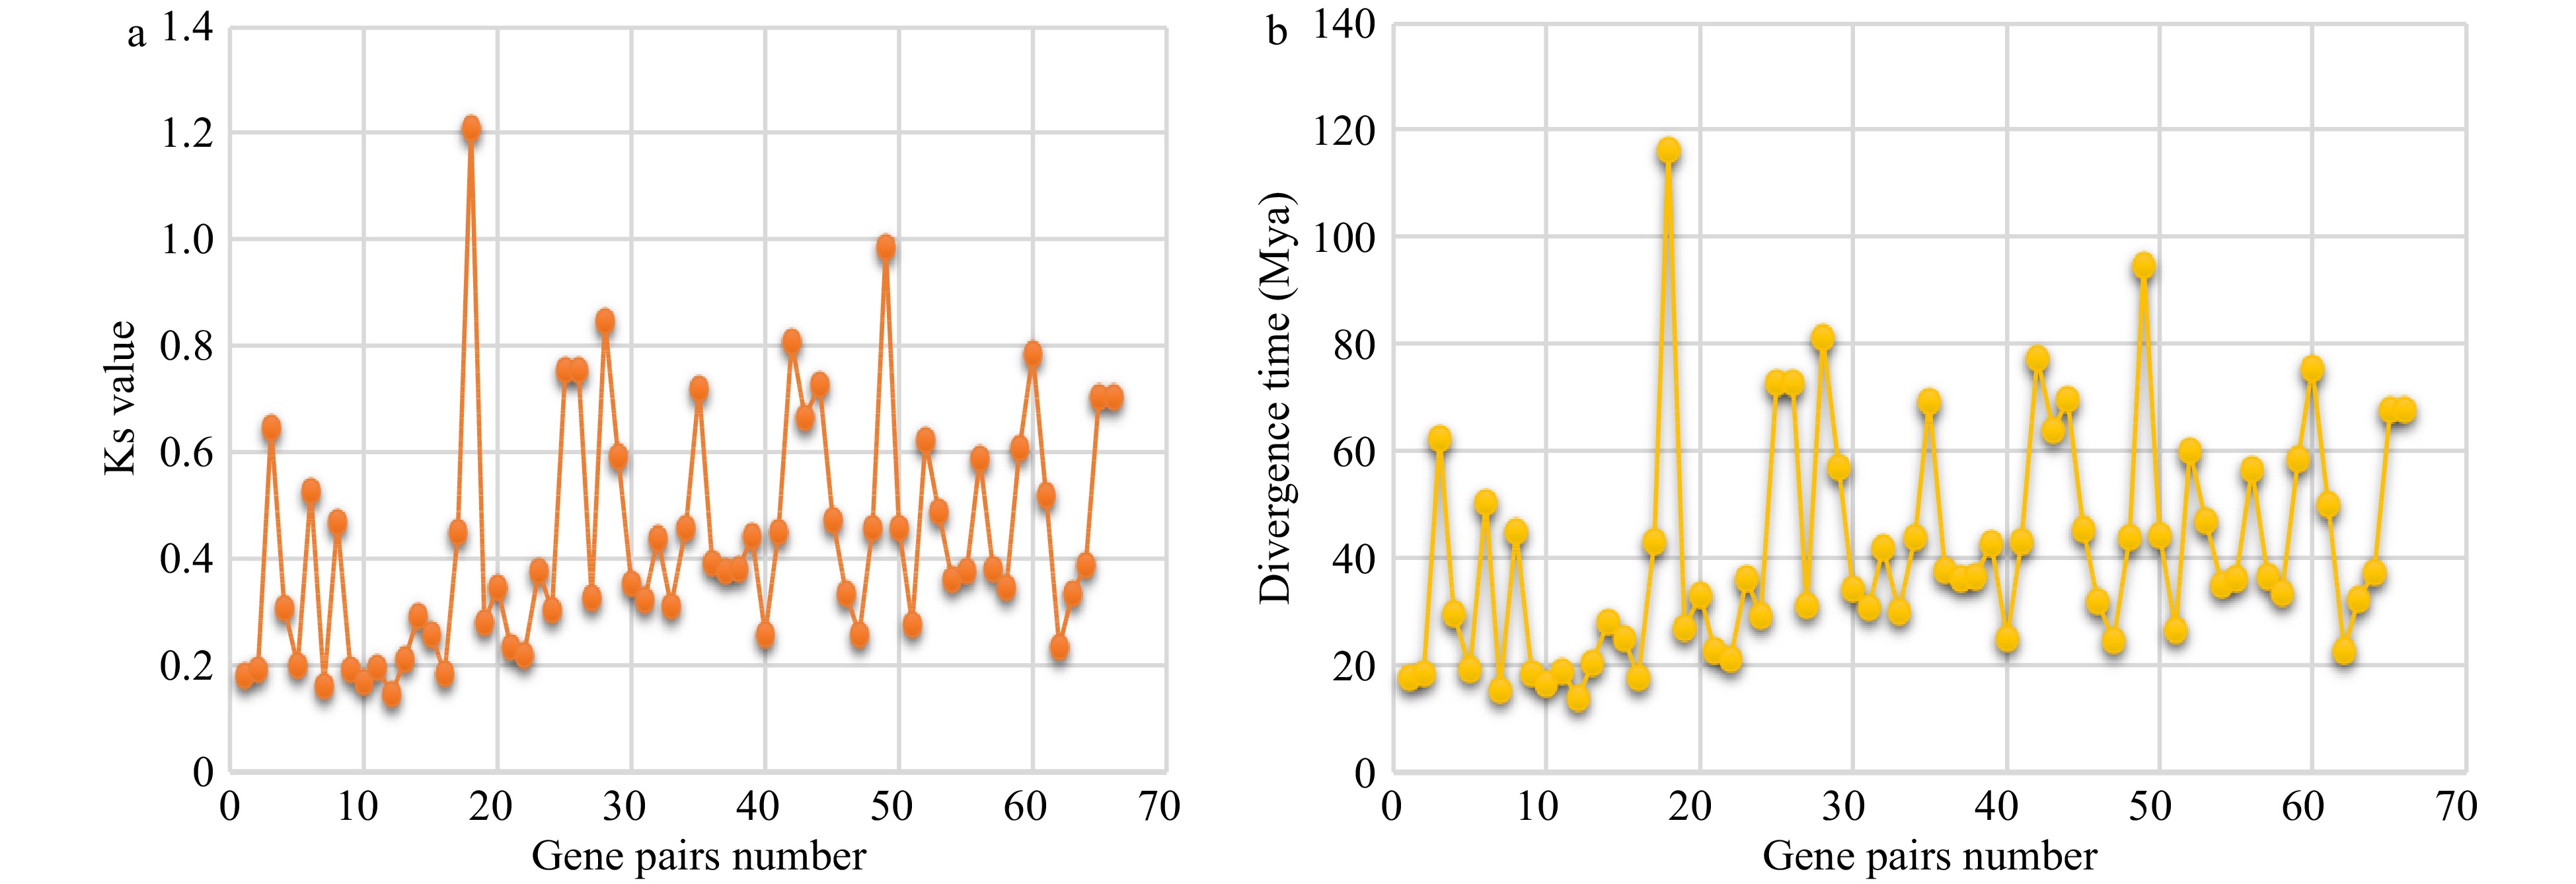
Figure 5. Ks and divergence time of TCP orthologs. Ks values (a) and divergence time estimation (b) of orthologous gene pairs between any two of three Apiaceae species.
-
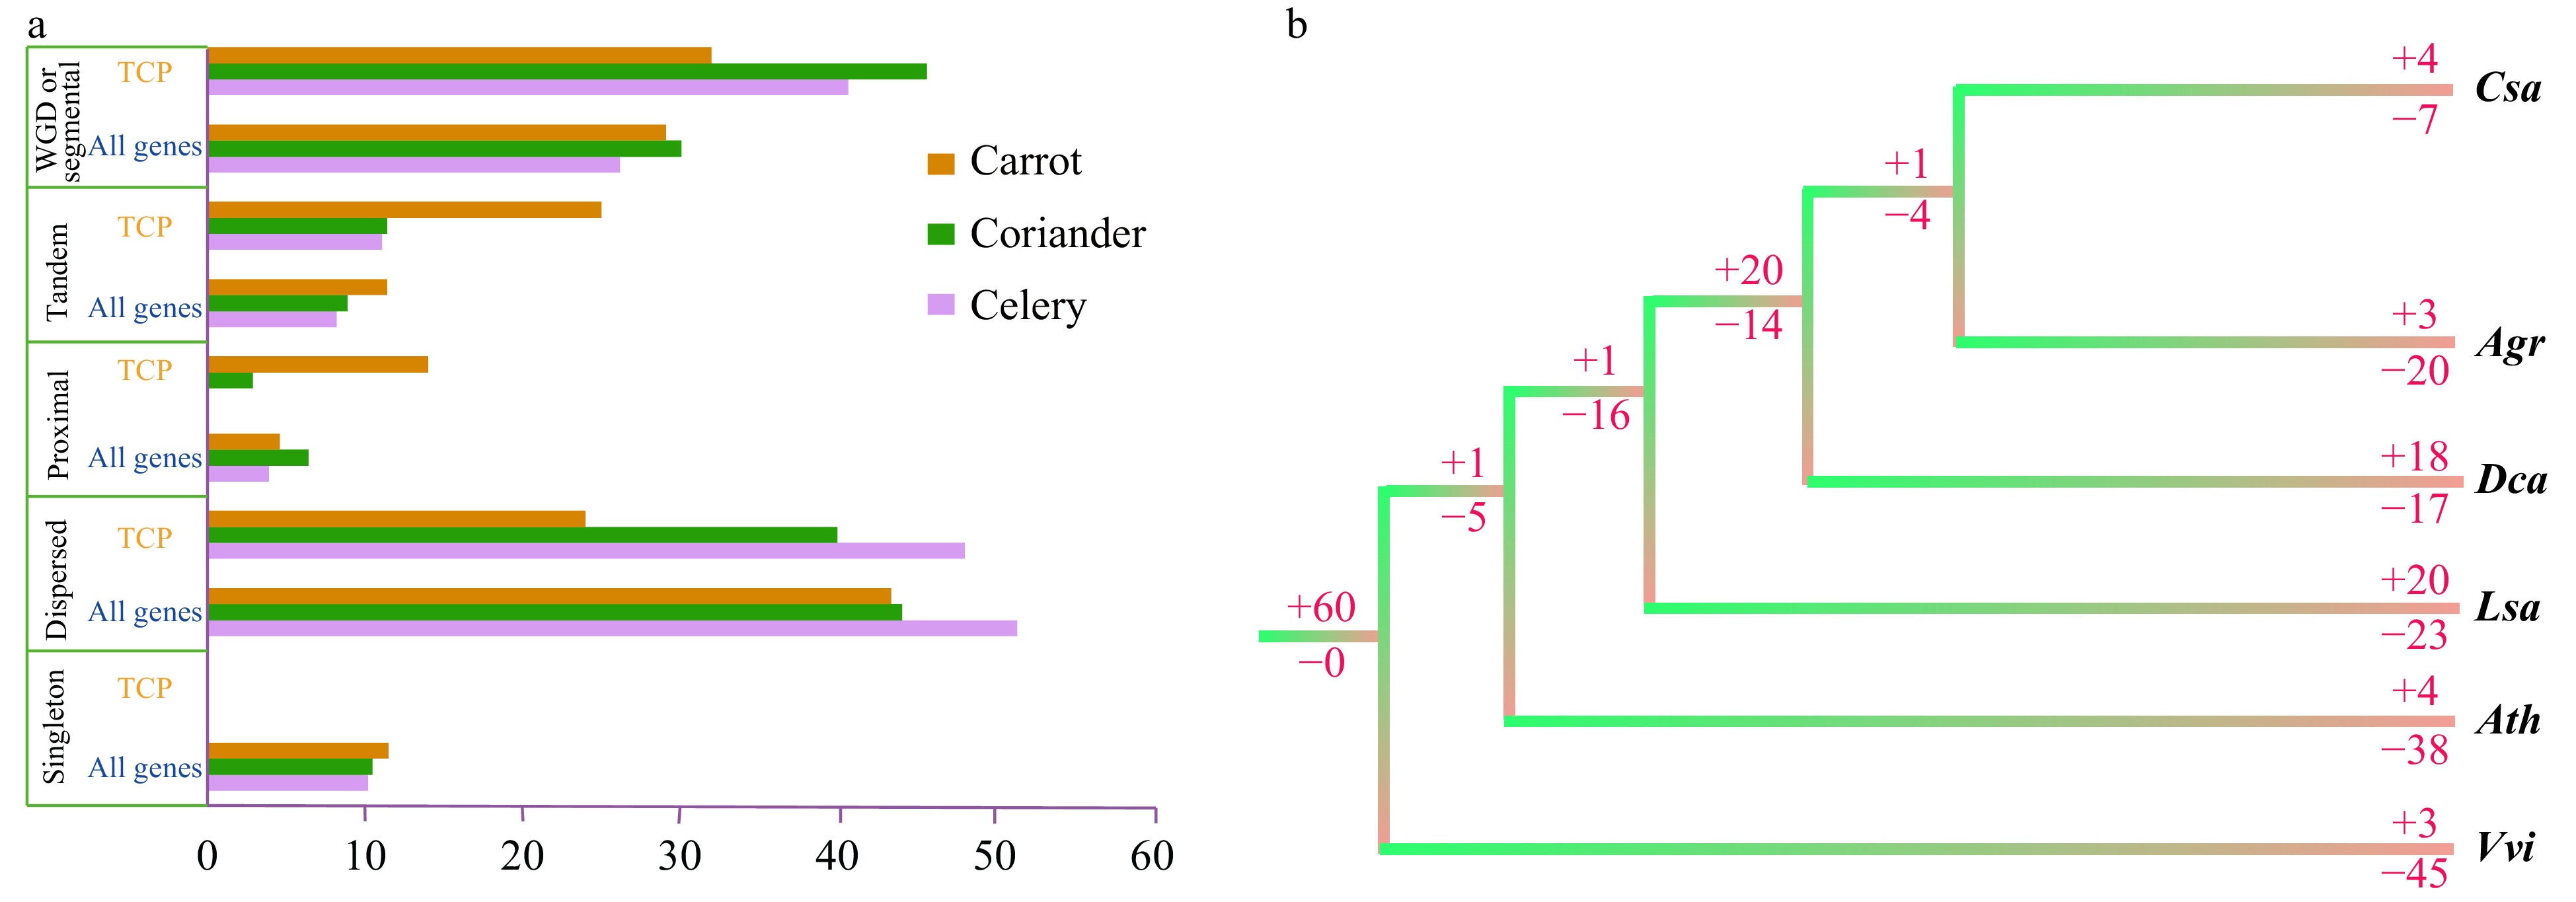
Figure 6. Duplication and loss of TCP family genes. (a) Percentage of duplication types for TCP family genes and genes in the whole genome of three Apiaceae species. (b) Duplication (+) or loss (−) of TCP family genes in three Apiaceae species and three other representative species. Numbers after '+' and '−' are the number of genes. Agr, Apium graveolens (celery); Ath, Arabidopsis thaliana (Arabidopsis); Csa, Coriandrum sativum (coriander); Dca, Daucus carota (carrot); Lsa, Lactuca sativa (lettuce); Vvi, Vitis vinifera (grape).
-
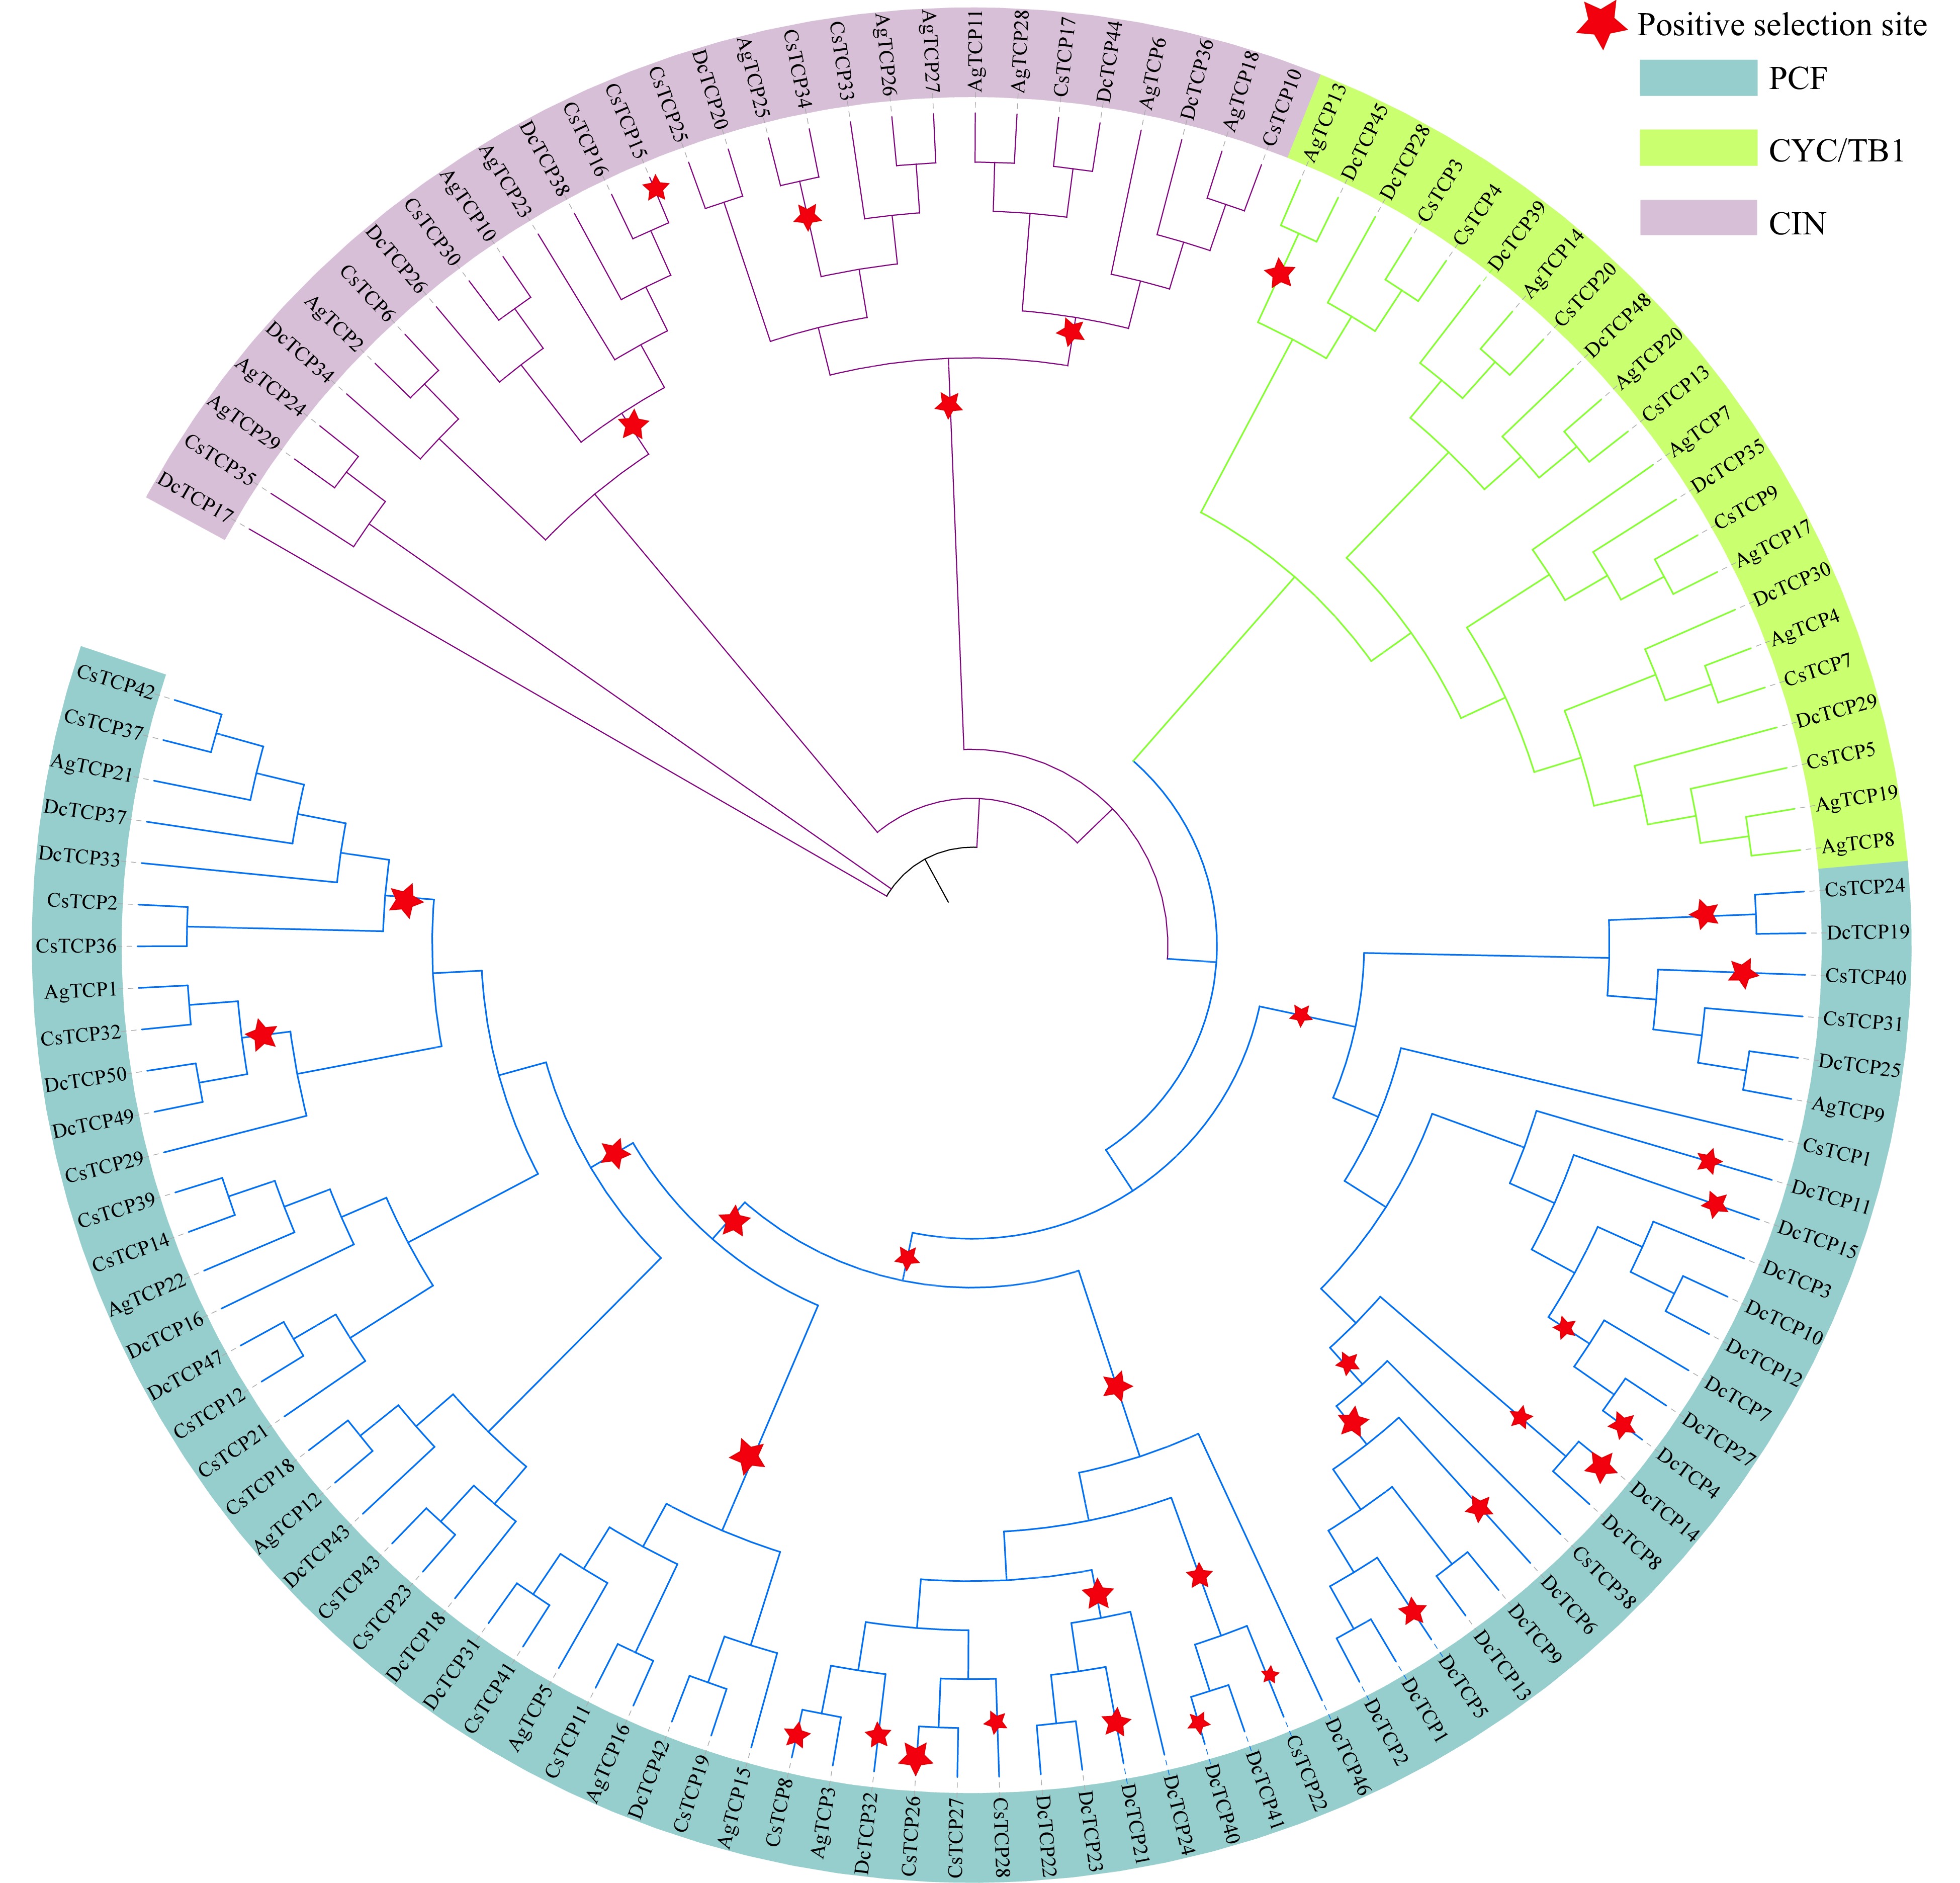
Figure 7. Positive selection of TCP family genes in celery, coriander and carrot. Red stars represent branches in which positive selection occurred. The maximum likelihood (ML) phylogenetic tree was constructed using PhyML software.
-
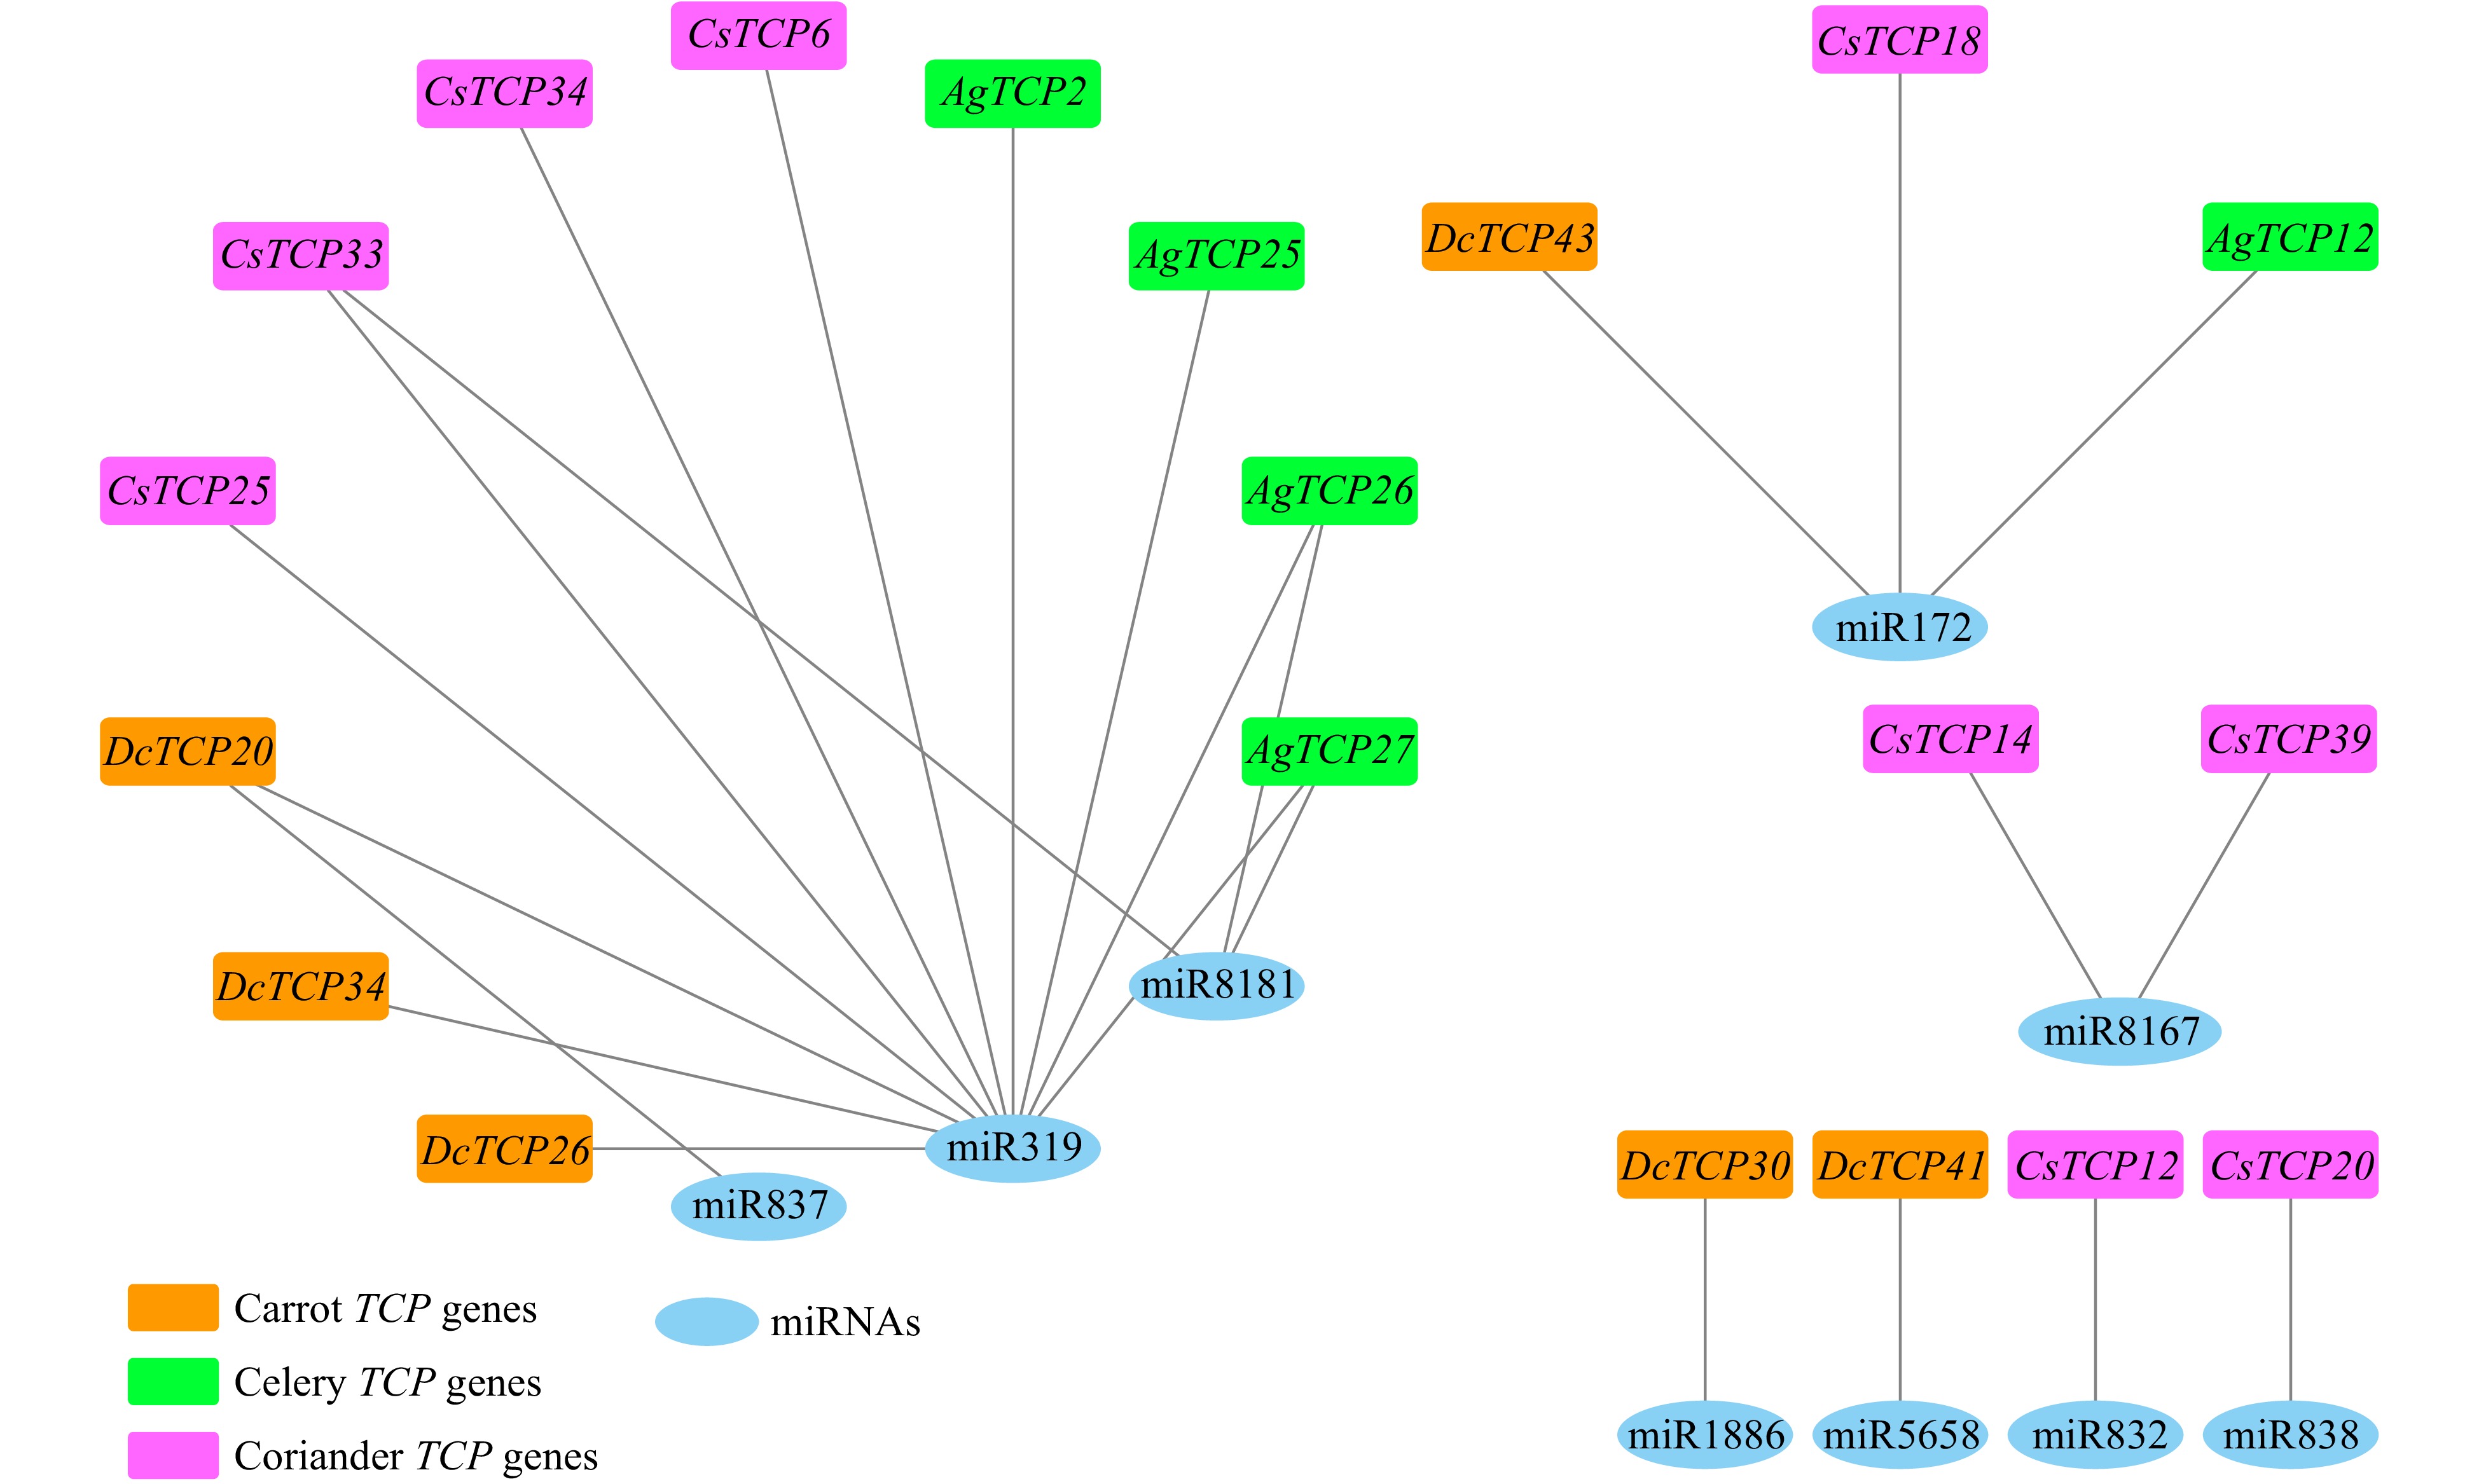
Figure 8. Interaction network of miRNAs and target TCP family genes in carrot, celery and coriander.
-
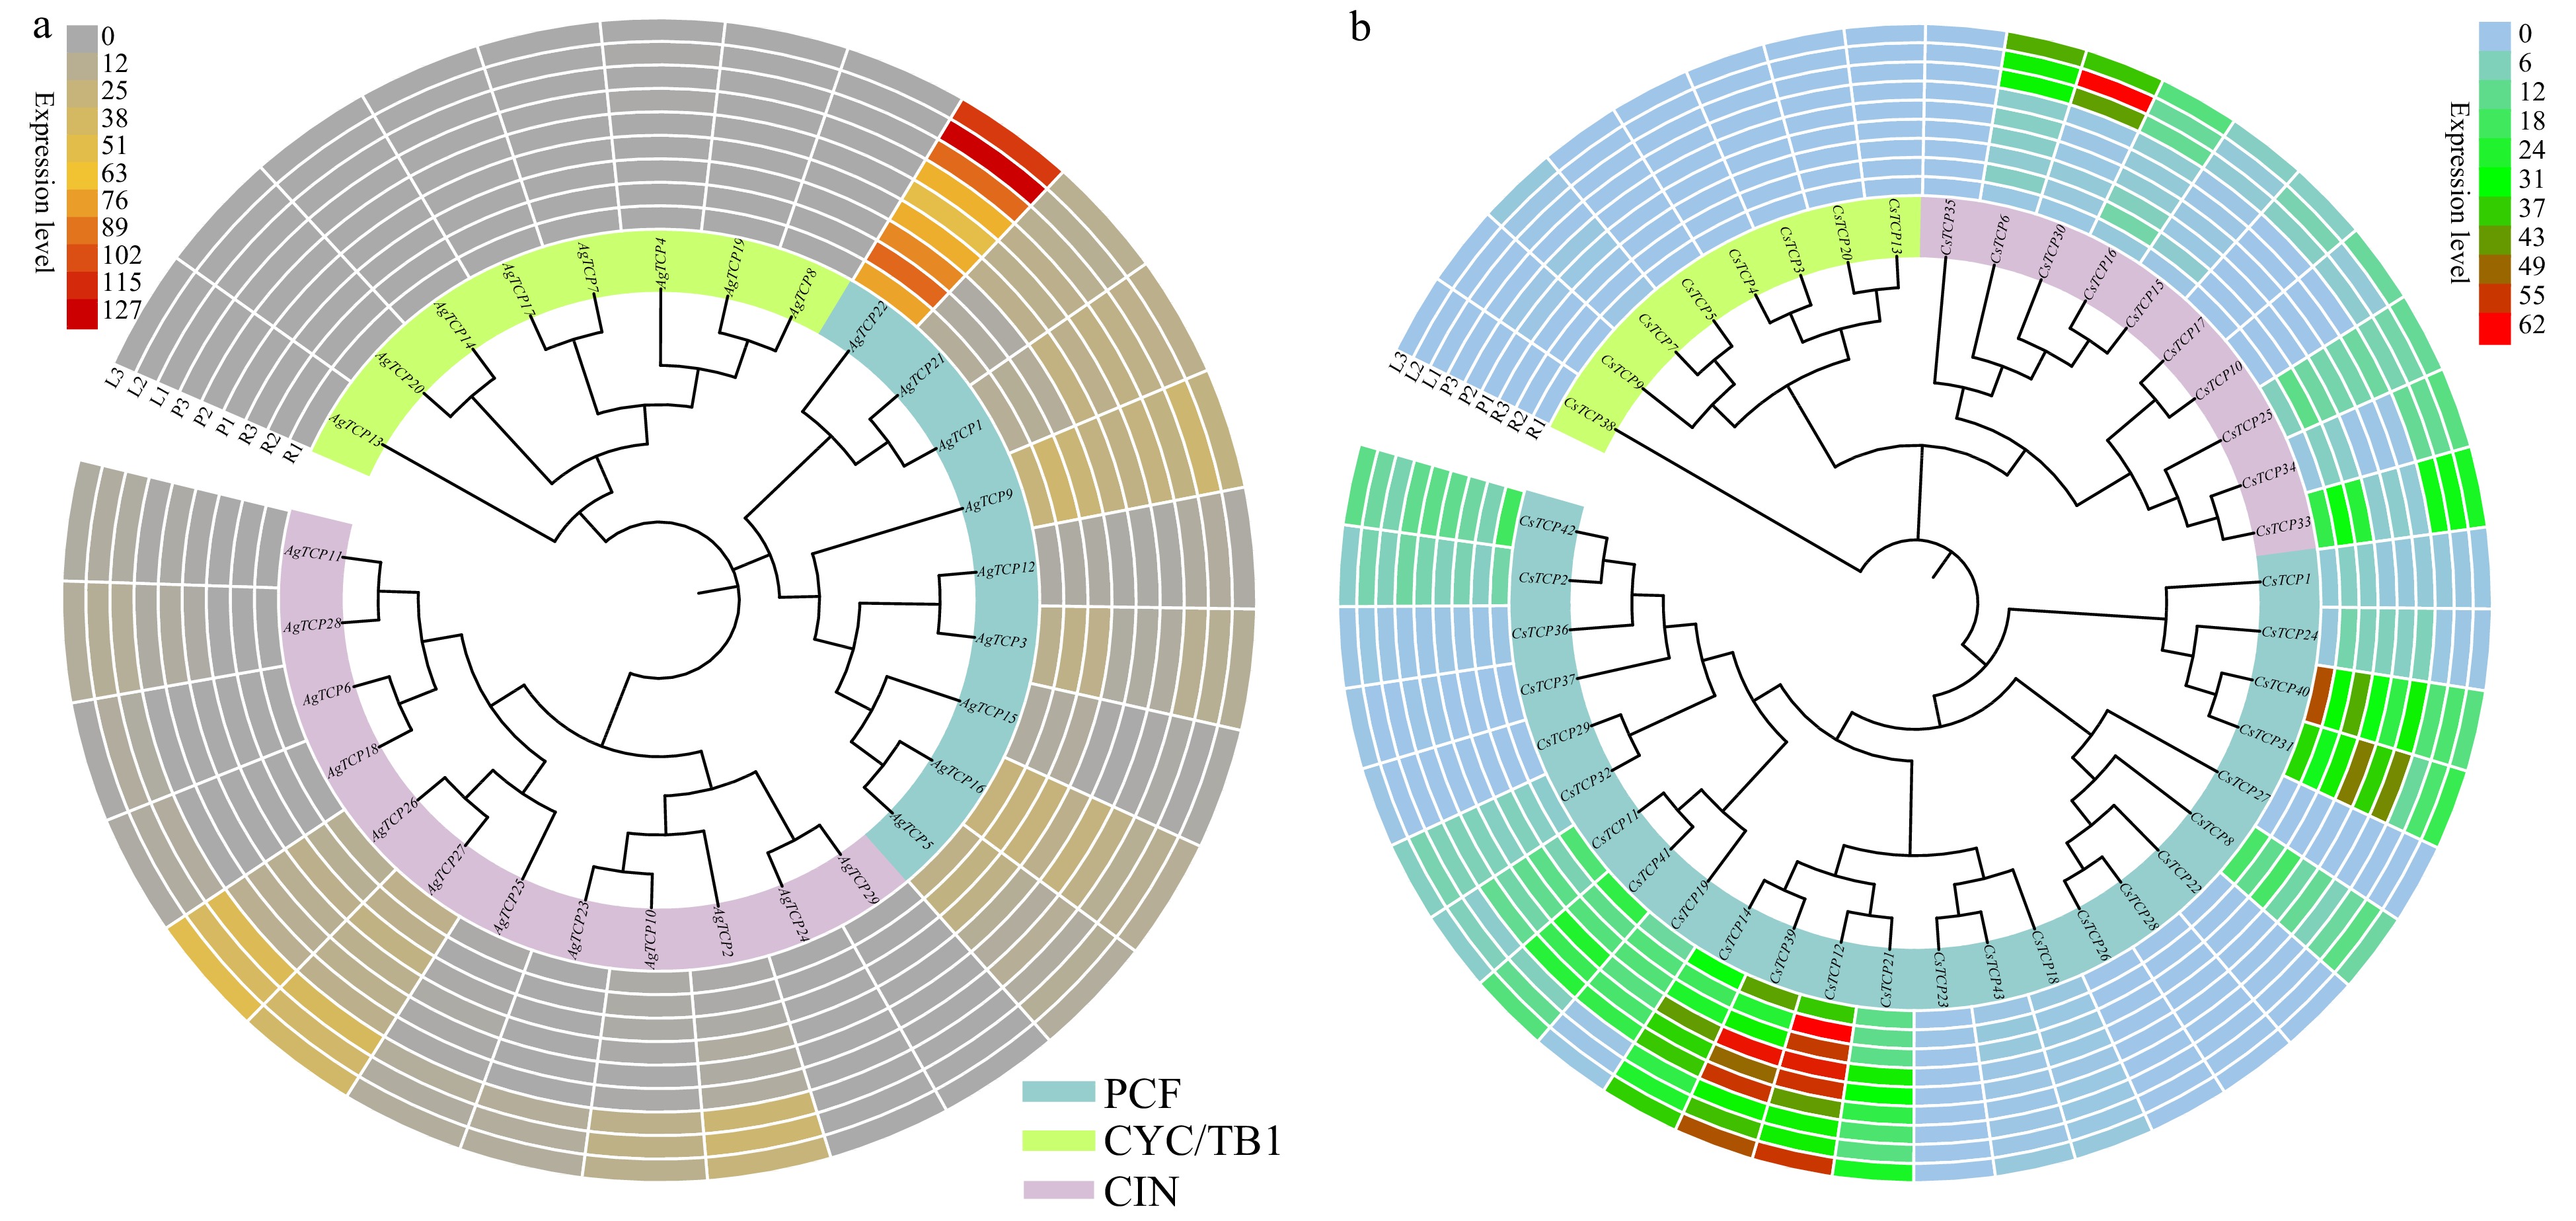
Figure 9. Expression of TCP family genes in three replicates of plant tissues including root (R1, R2 and R3), petiole (P1, P2 and P3), and leaf (L1, L2 and L3). Hierarchical gene expression clustering of TCP genes in celery (a) and coriander (b). Expression levels were calculated based on RPKM.
-
Duplication typea Categoryb A. graveolens C. sativum D. carota Singleton All genes 3,028 3,577 3,543 TCP 0 0 0 Percentage (%) 0 0 0 Dispersed All genes 15,258 14,963 13,378 TCP 13 14 12 Percentage (%) 48.15 40 24 Proximal All genes 1,167 2,161 1,428 TCP 0 1 7 Percentage (%) 0 2.86 14 Tandem All genes 2,426 3,032 3,501 TCP 3 4 15 Percentage (%) 11.11 11.43 30 WGD/segmental All genes 7,787 10,200 8,974 TCP 11 16 16 Percentage (%) 40.74 45.71 32 Total All genes 29,666 33,933 30,824 TCP 27 35 50 Note: a the classification of duplicate genes was conducted using the MCScanX program. WGD/segmental duplicates were inferred by the anchor genes in collinear blocks. Tandem duplicates were defined as paralogs that were adjacent to each other on chromosomes. Proximal duplicates were paralogs near each other, while interrupted by several other genes. Dispersed duplicates were paralogs that were neither near each other on chromosomes, nor do they showed conserved synteny. b TCP indicated the TCP family genes. Percentage (%) indicated the percentage of TCP family gene number among all genes. Table 1. The identification of duplicated type for TCP family genes and all genes in A. graveolens, C. sativum and D. carota.
Figures
(9)
Tables
(1)