-
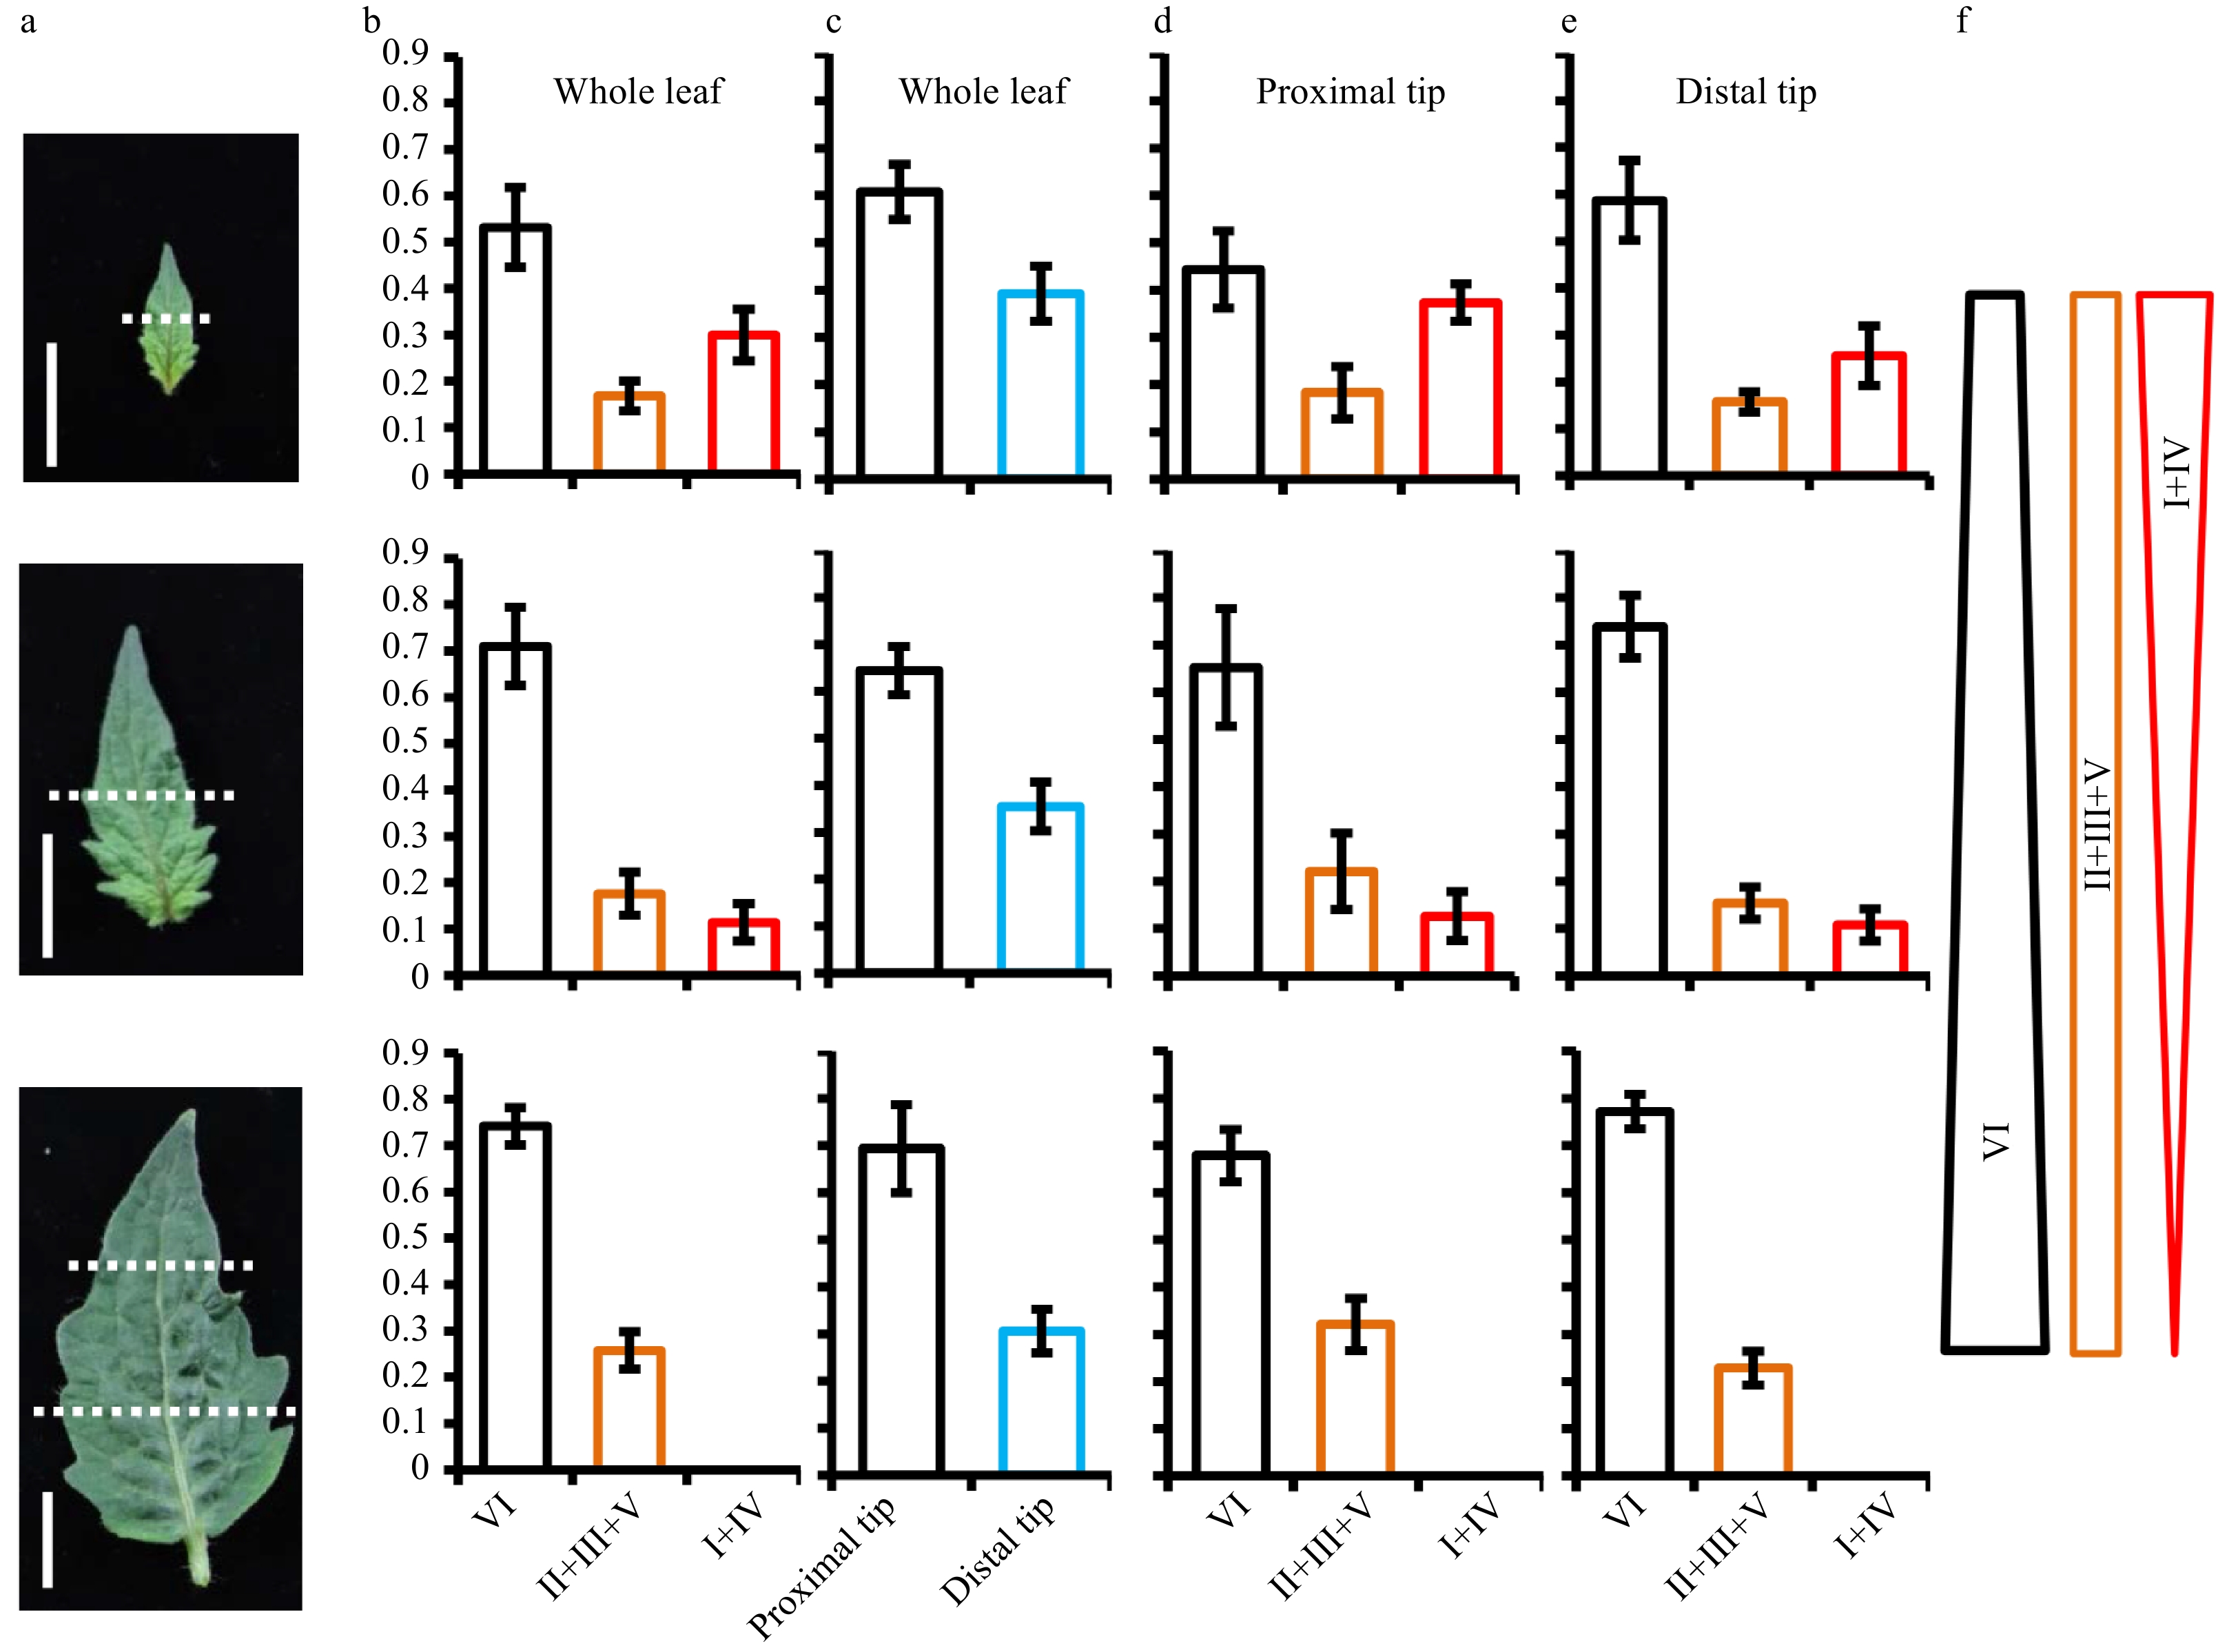
Figure 1. Spatiotemporal distribution of trichomes in the developing leaf. (a) Leaves at three different stages were used for analyzing the spatiotemporal distribution of trichomes. At the first and second stage, leaves were divided into two sections (proximal region and distal region) with approximate equal length and the dotted lines show the boundary of proximal region and distal region. At the third stage, leaves were divided into three parts (distal, middle, and proximal) with approximate equal length and the upper and lower parts of leaves were used to quantify the trichome number. Bars: 1 cm. (b) The percentage of each category trichome on the whole leaves. (c) The proportion of trichomes on the proximal region and distal region of whole leaves. (d−e) The percentage of each category trichome on the proximal region (d) and distal region (e) of leaves. (f) The schematic diagram summarizing the changing trend of each category of trichome over the leaf expansion. Type II, III and V were grouped into one category (marked as II+III+V); type I and IV were grouped into one category (marked as I+IV); type VI was a separate category. Five leaves at different stages were used to quantify the trichome number. The bars represent the standard deviation (SD) of 5 biological replicates.
-
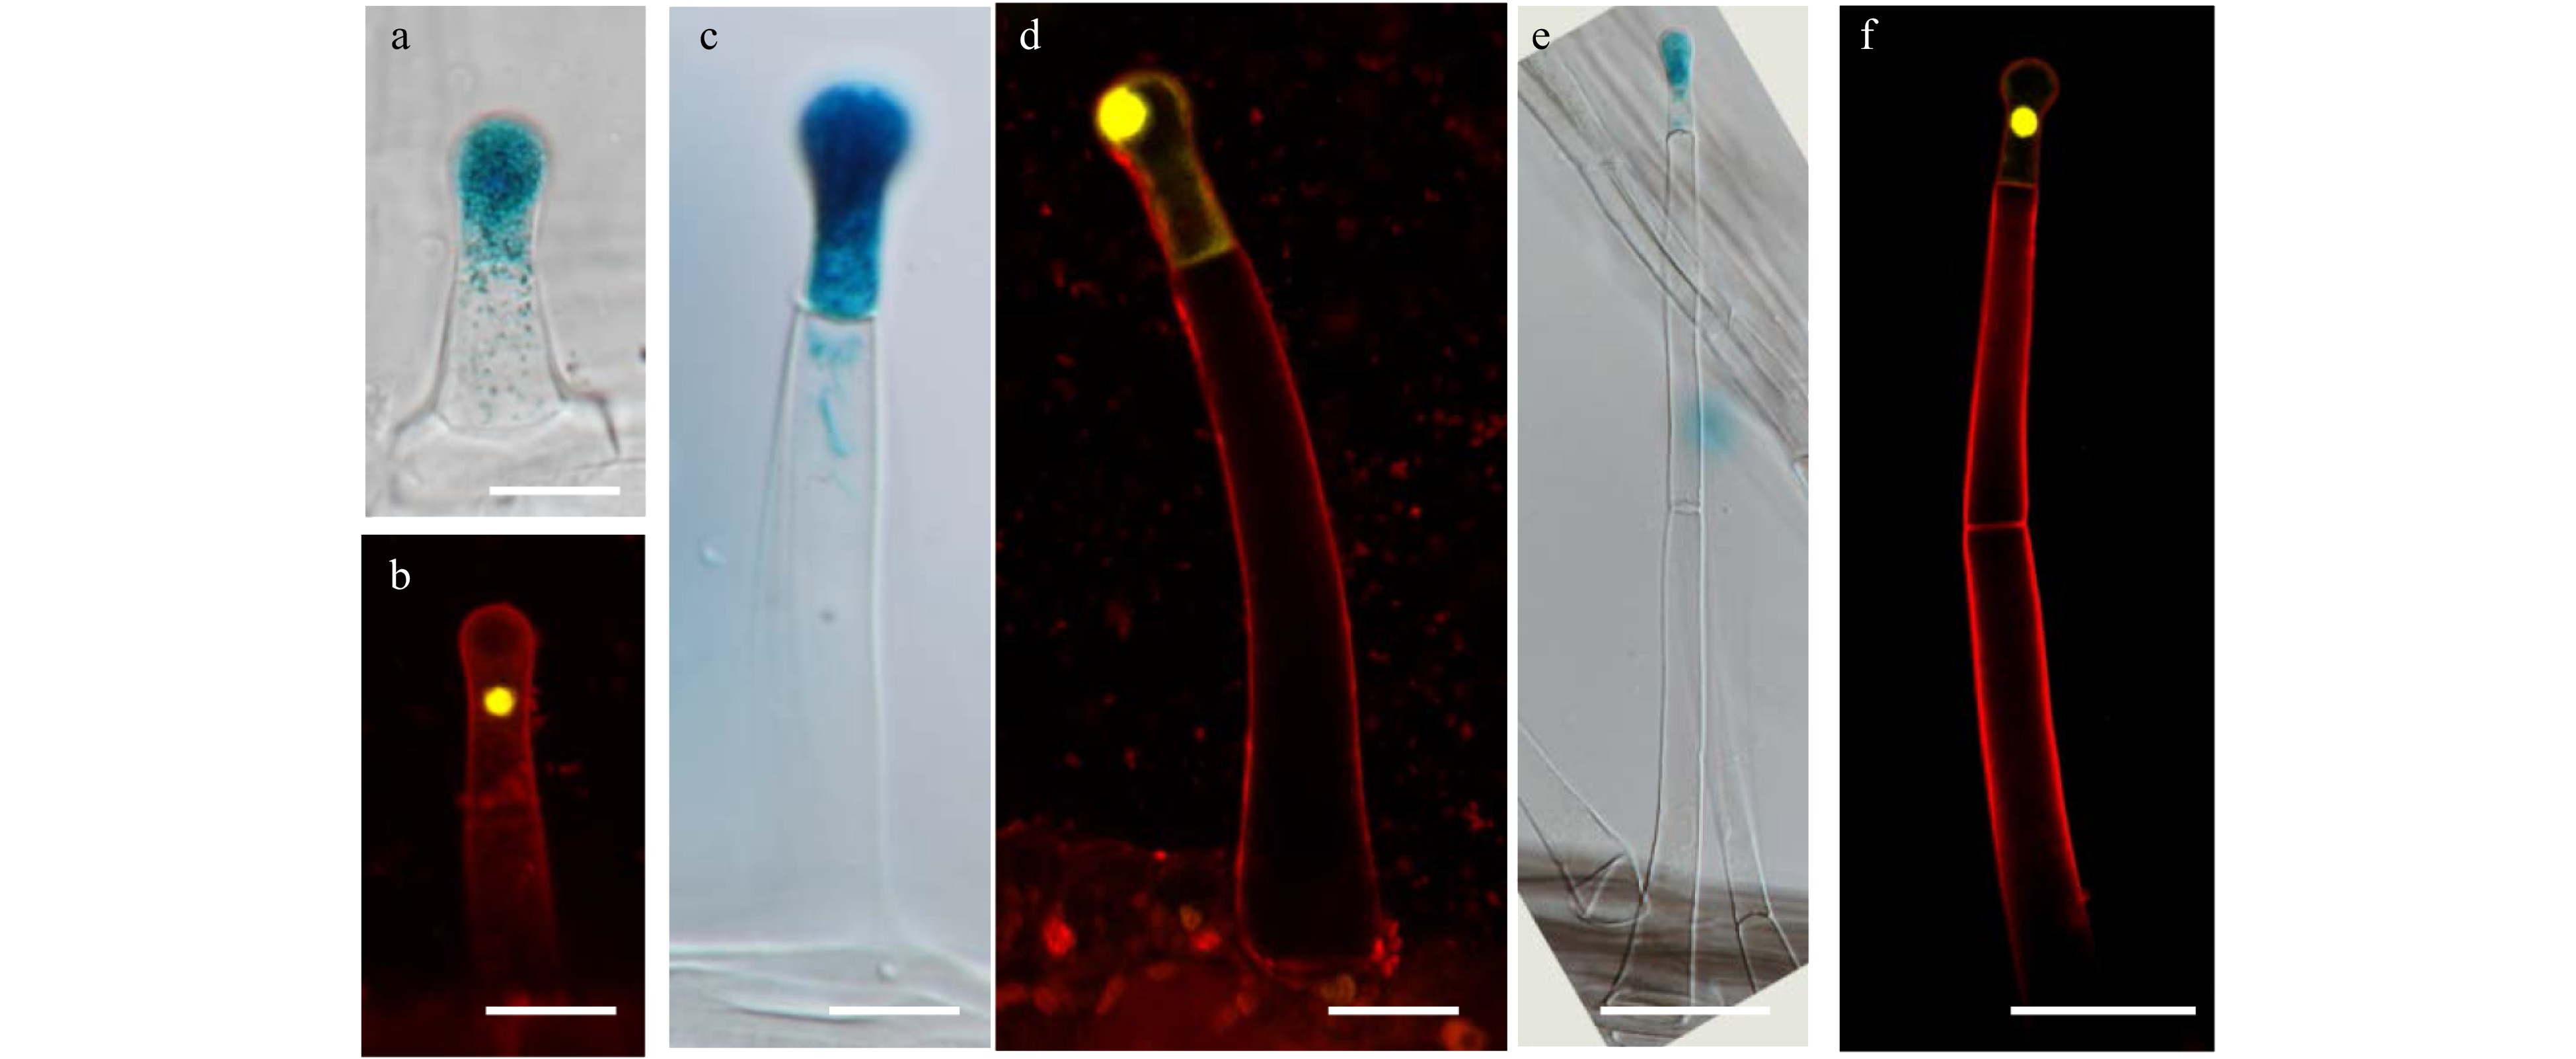
Figure 2. The expression of GUS and YFP driven by pSlAT2 in type I/IV trichomes. (a) GUS is expressed in the top cell of the trichome at the two-cell stage. The picture was taken by differential interference contrast microscope (DIC). Bar: 20 μm. (b) YFP is expressed in the top cell of the trichome at the two-cell stage. The sample was stained with 5 μg/ml propidium iodide (PI) (red fluorescence). Bar: 20 μm. (c−d) GUS (c) and YFP (d) are expressed in the top cell of type I/IV trichomes with one stalk cell. Bar: 20μm. (e−f) GUS (e) and GFP (f) are expressed in the top cell of the type I/IV trichomes with two stalk cells. Bar: 50 μm.
-
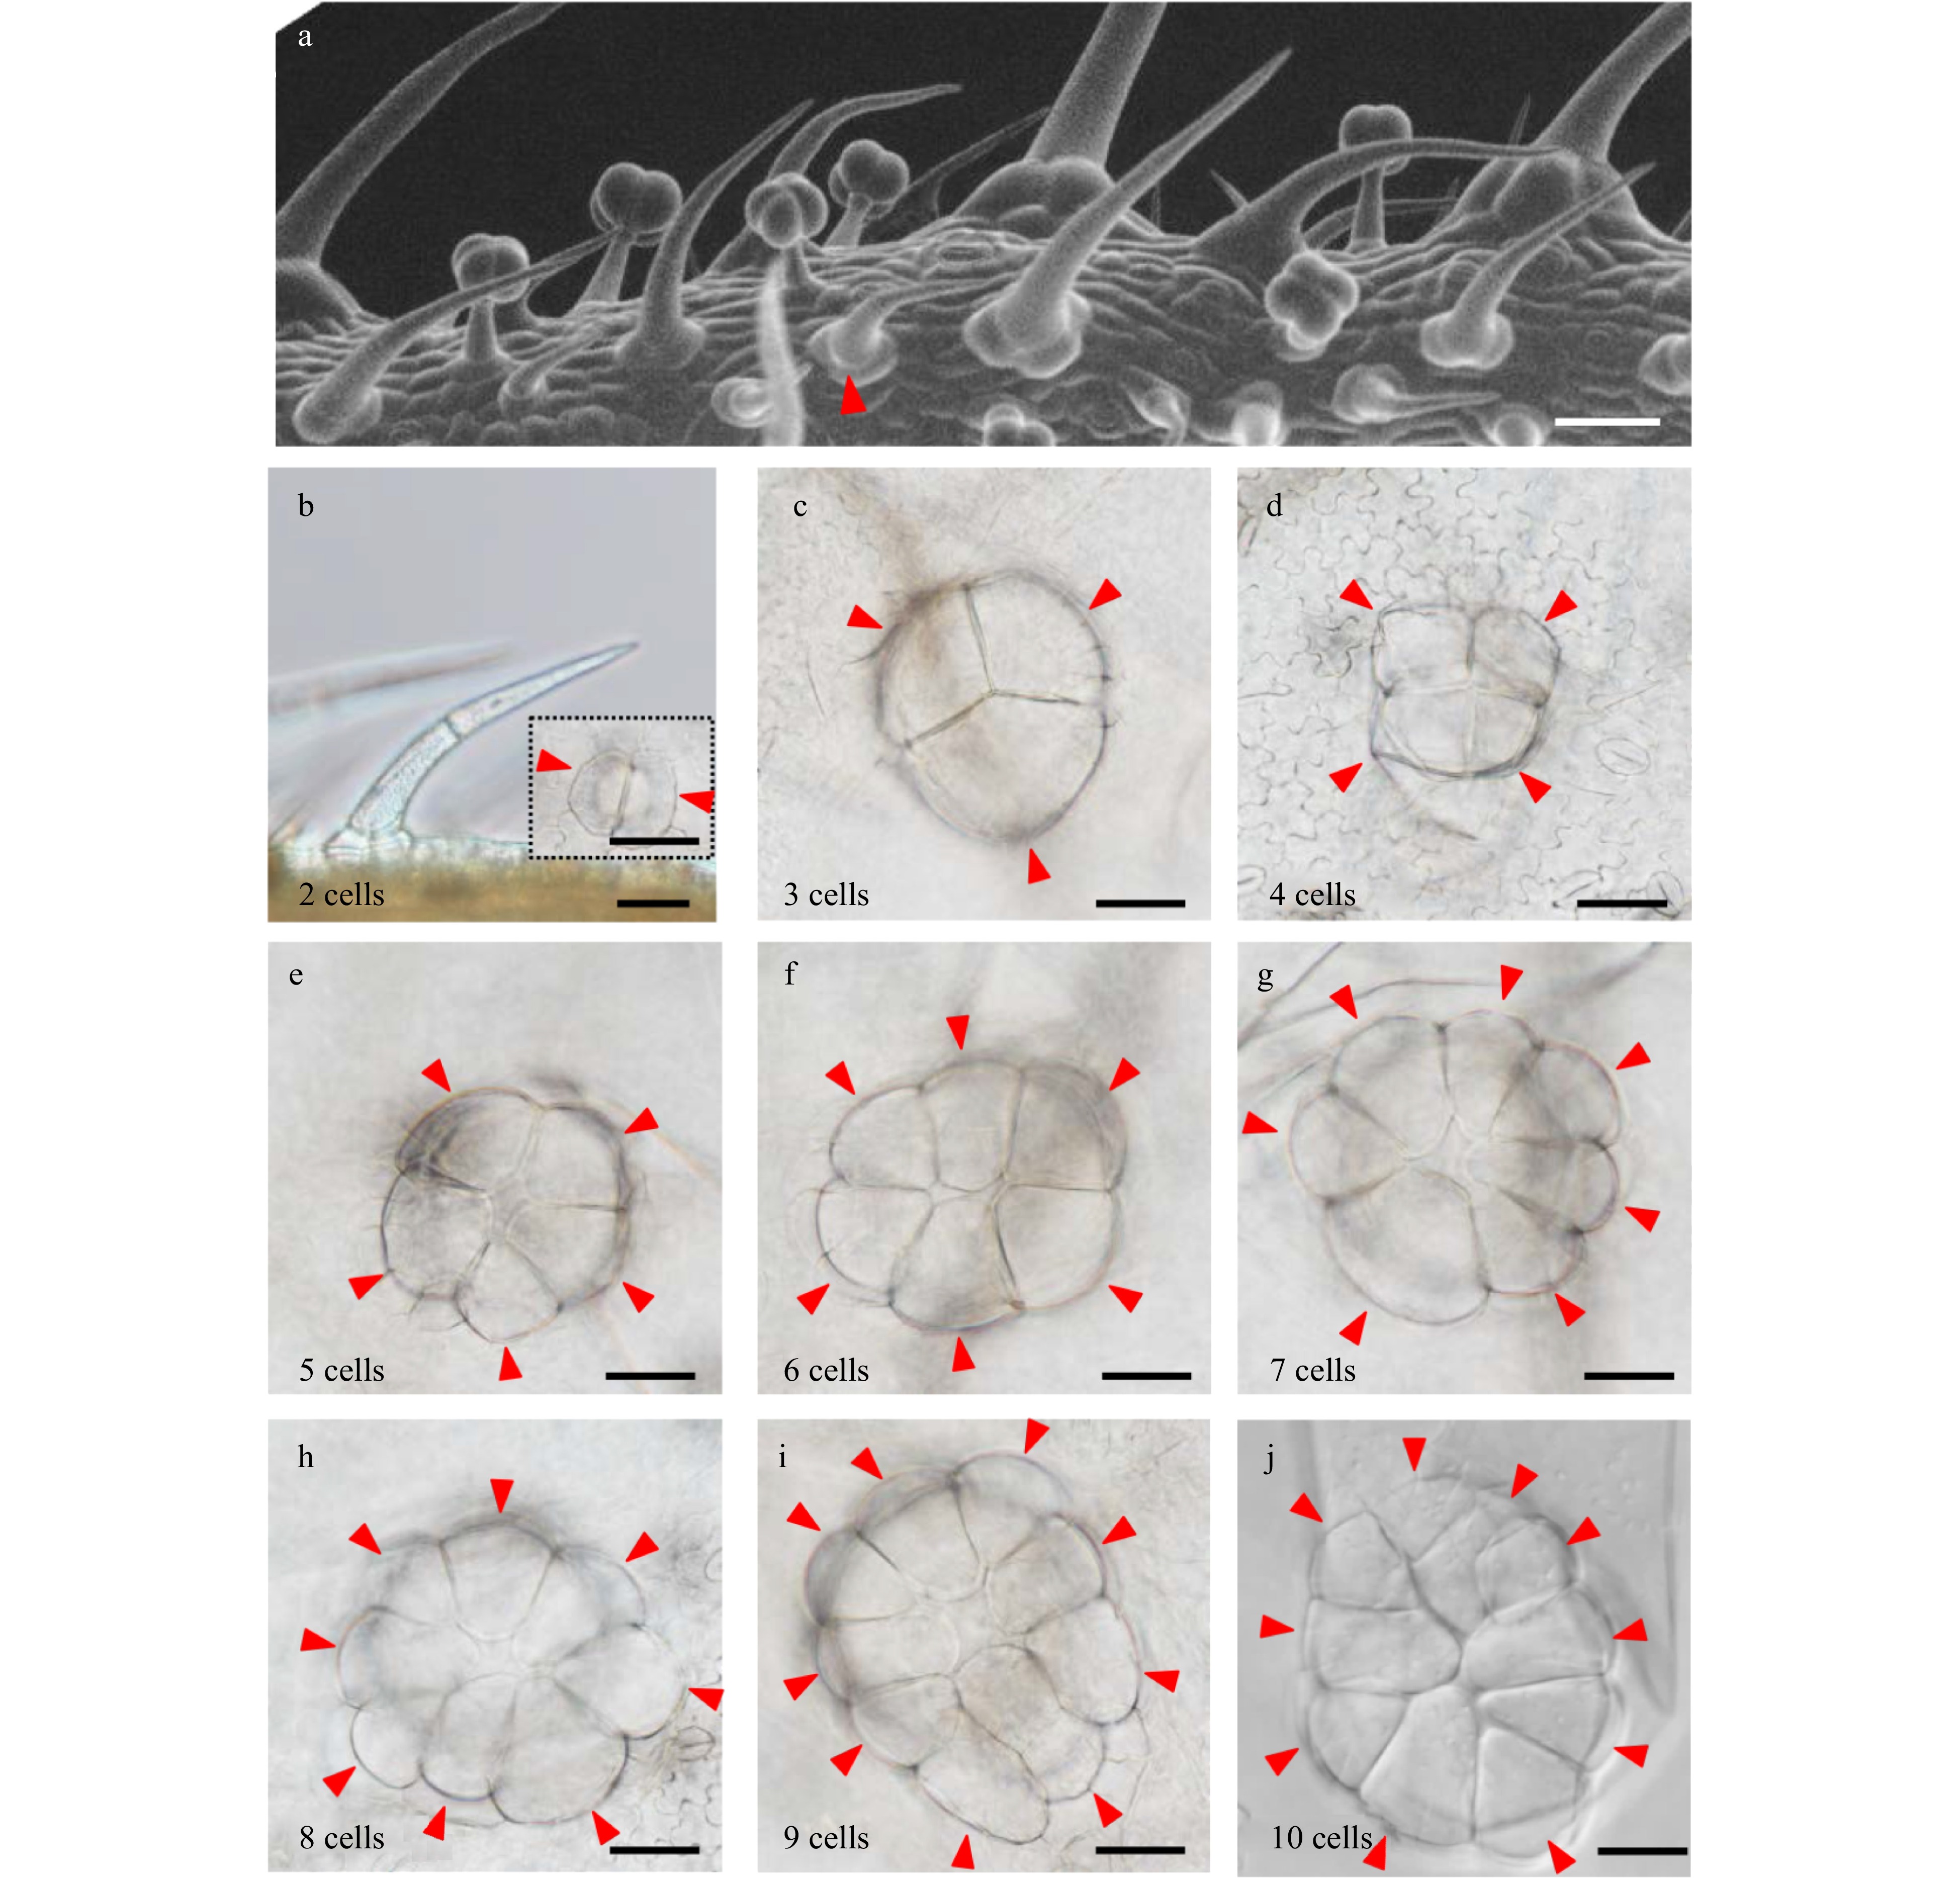
Figure 3. Number and arrangement of trichome base cells. (a) Observation of the trichome base at different developmental stages by SEM. The red triangles show the trichome with two stalk cells and two base cells. Bar: 40 μm. (b) Observation of the trichome with two stalk cells and two base cells by DIC. The picture surrounded by black dotted lines shows the base with two cells. The red triangles show the base cell of trichomes. Bars: 40 μm. (c−j) Trichome bases with three to ten cells. The numbers in the lower left corner of the picture show the number of the base cell. Bars: 40 μm.
-
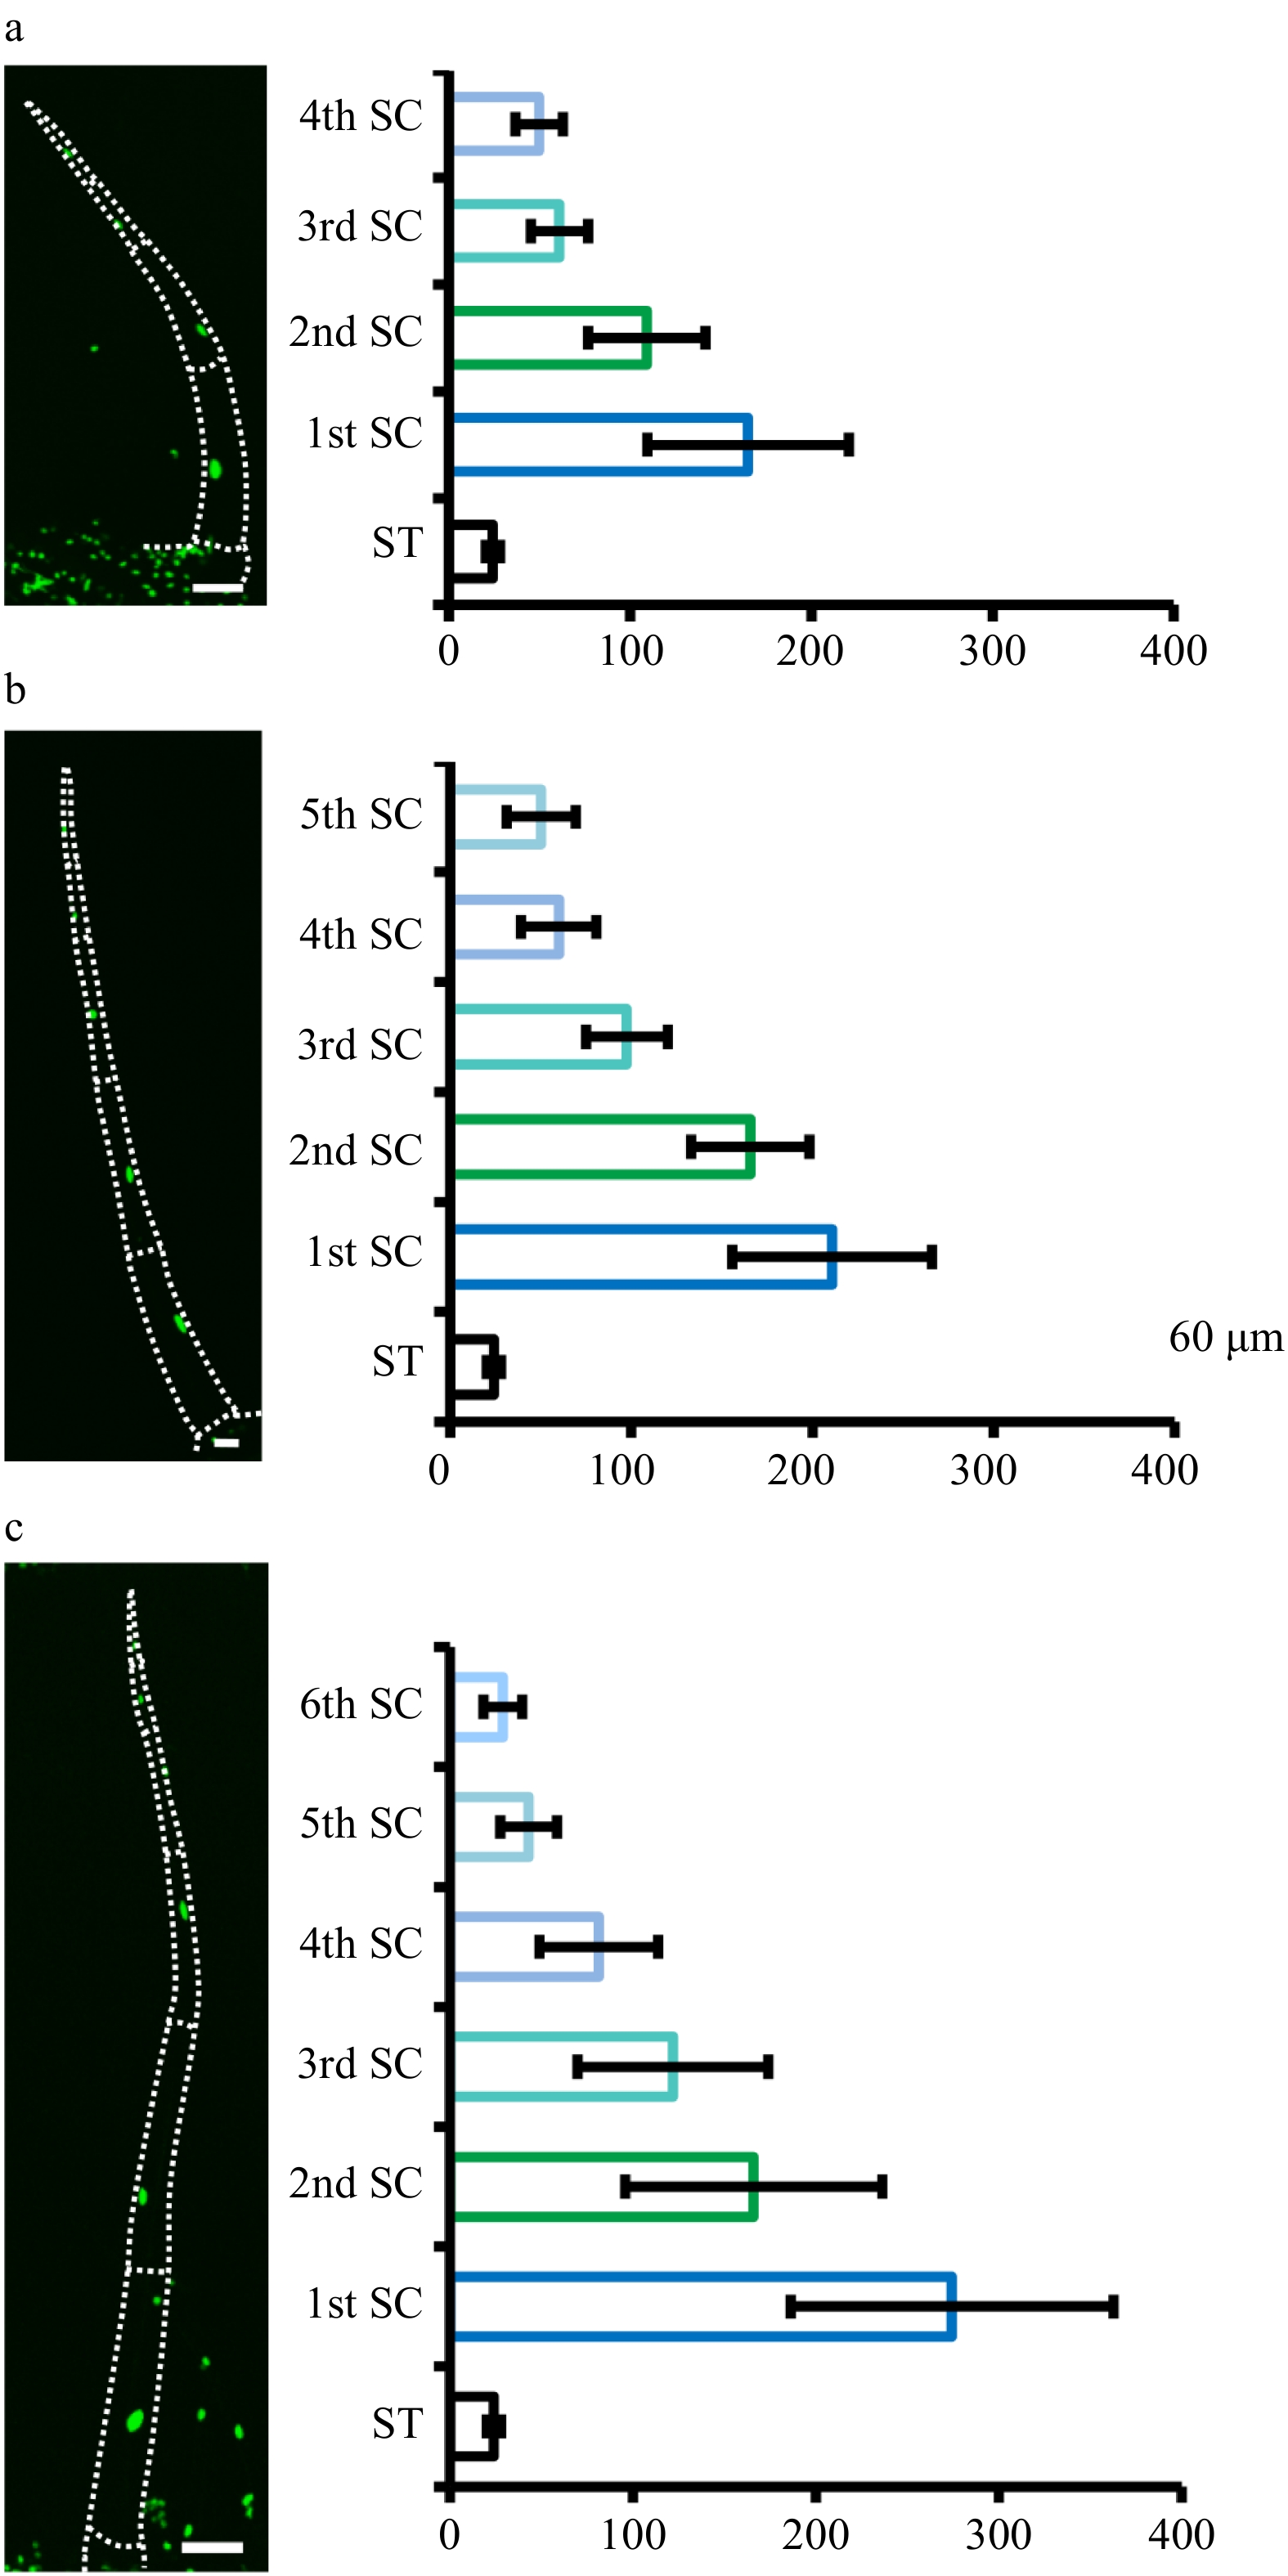
Figure 4. Quantification of nuclear size of type II/III. Quantification of nuclear size of type II/III trichomes with four (a), five (b) and six (c) stalk cells. Pictures were taken on transgenic plants expressing 35S::H2B-GFP (OE-H2B-GFP) under confocal microscope. The dotted lines show the outline of trichomes. The bar charts show the statistical results of nuclear size. The nuclei of the stomata (ST) are the control. The stalk cells (SC) towards the leaf epidermis are marked as the first stalk cell (1st SC) and the next as the second stalk cell (2nd SC), and so on. The error bars on the charts represent the standard deviation (SD) of more than ten biological replicates.
-
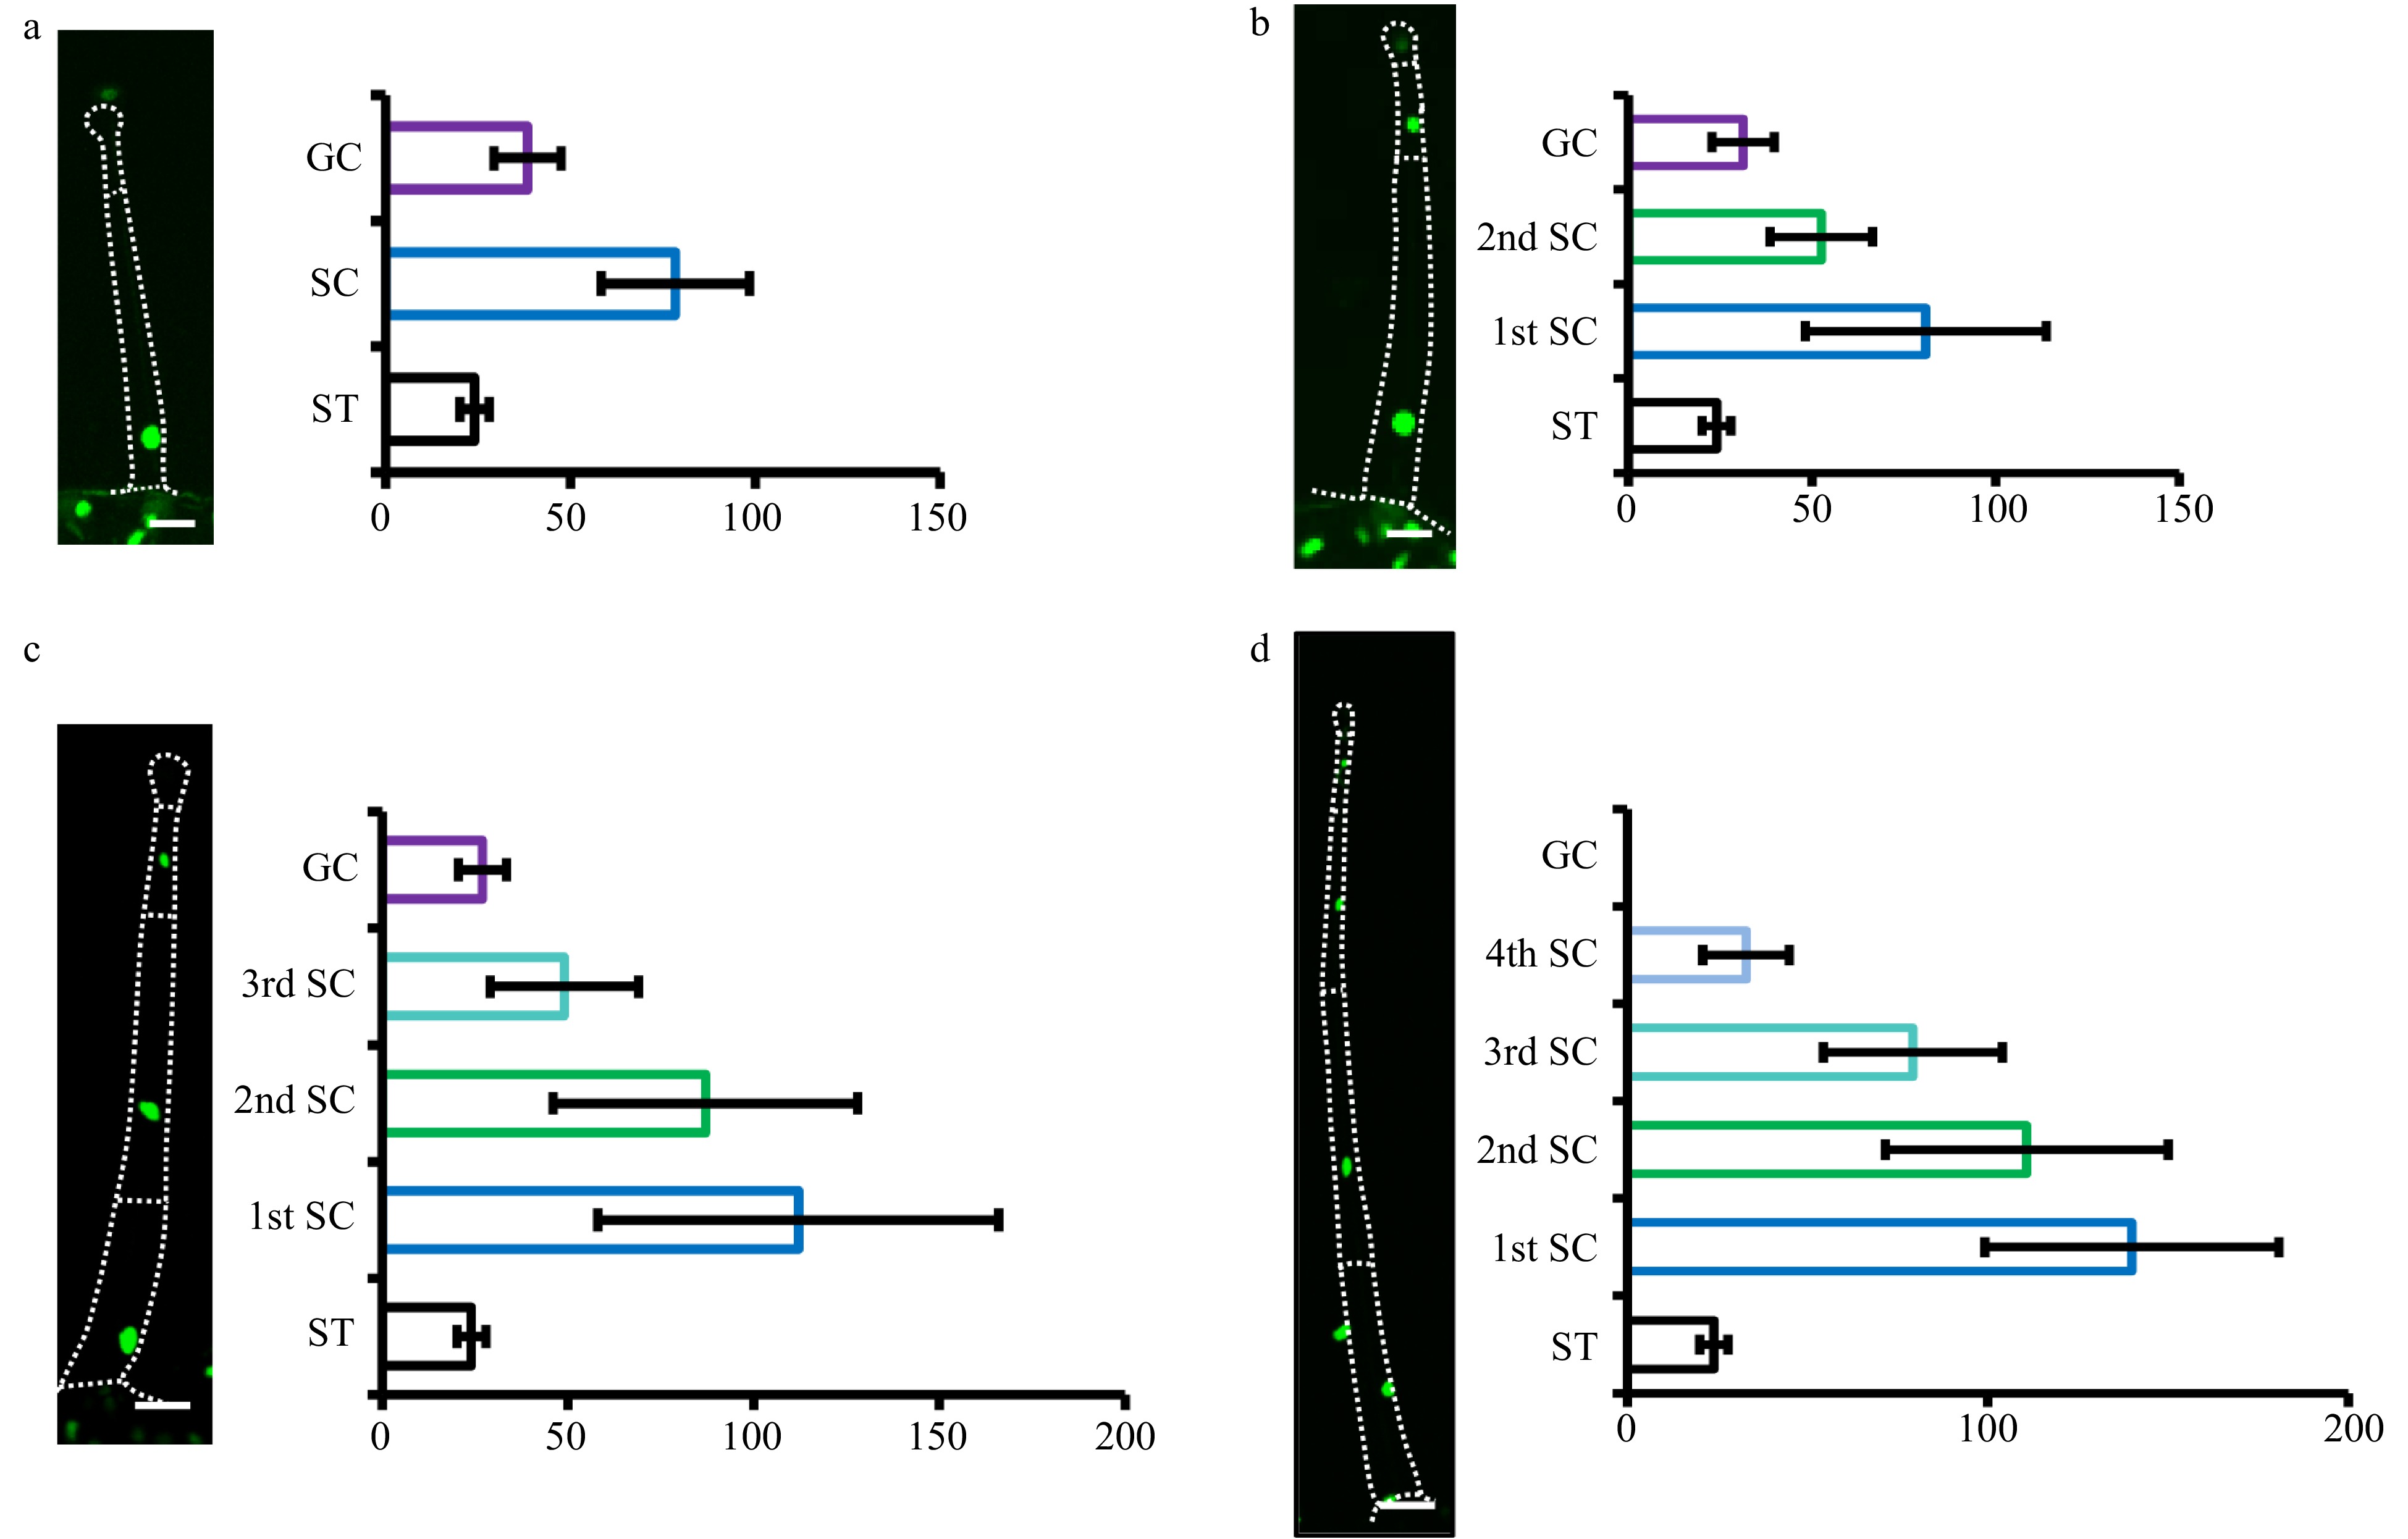
Figure 5. Quantification of nuclear size of type I/IV. The nuclei of type I/IV trichomes with one to four stalk cells were quantified (a−d). Pictures were taken on transgenic OE-H2B-GFP plants under confocal microscope. The dotted lines show the outline of trichomes. The gland cells and stalk cells of type I/IV trichomes with one to three stalk cells were analyzed, while only stalk cells of type I/IV trichomes four stalk cells were analyzed, as GFP fluorescence was difficult to detect in the gland of type I/IV trichomes with four stalk cells. The nuclei of the stomata (ST) are the control. The stalk cells (SC) towards the leaf epidermis were marked as the first stalk cell (1st SC) and the next one as the second stalk cell (2nd SC), and so on. The gland cells were labeled as GC. The error bars on the charts represent the standard deviation (SD) of more than ten biological replicates.
-
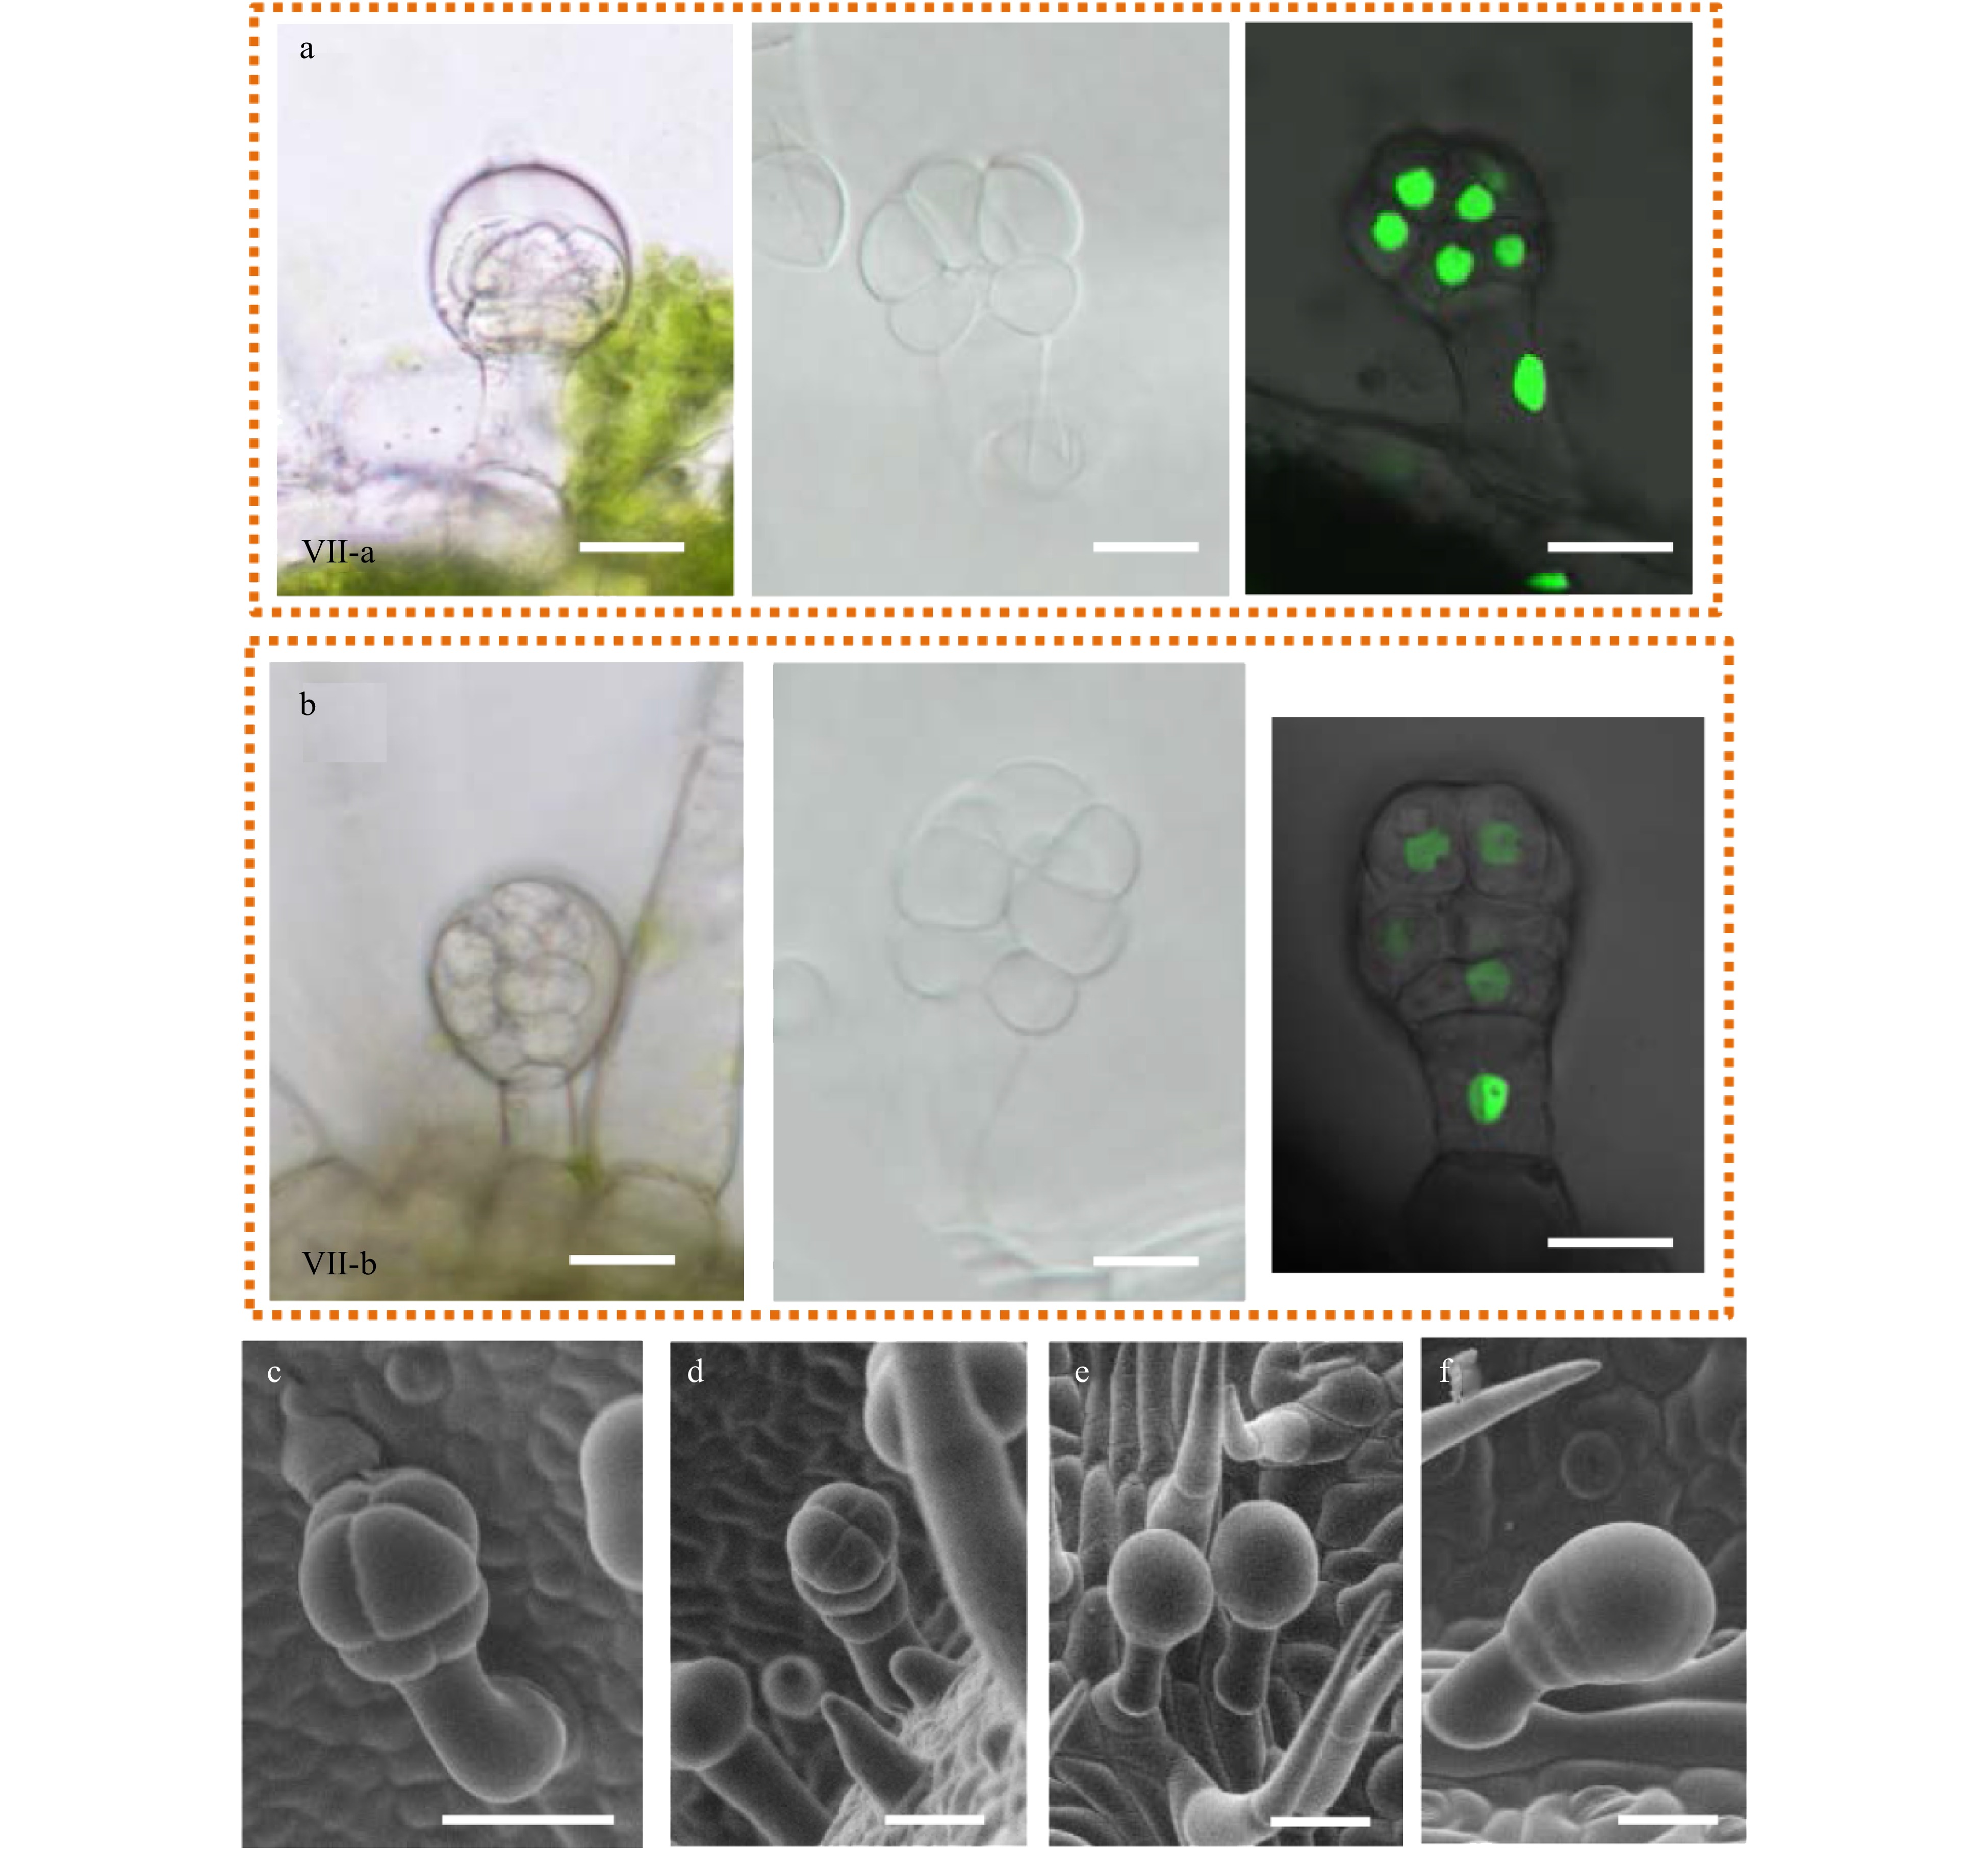
Figure 6. The morphology of type VII glandular trichomes. (a−b) The morphology of type VII glandular trichomes was observed by DIC (left and middle pictures) and confocal microscope (right picture). The left pictures were taken on the fresh section and the middle pictures were taken on the decolored leaves. The right pictures were taken on the leaves from OE-H2B-GFP transgenic plants. Two different types of VII trichomes were found, named as type VII-a (a) and type VII-b (b). (c−f) Type VII trichomes with different morphology were observed under SEM.
Figures
(6)
Tables
(0)