-
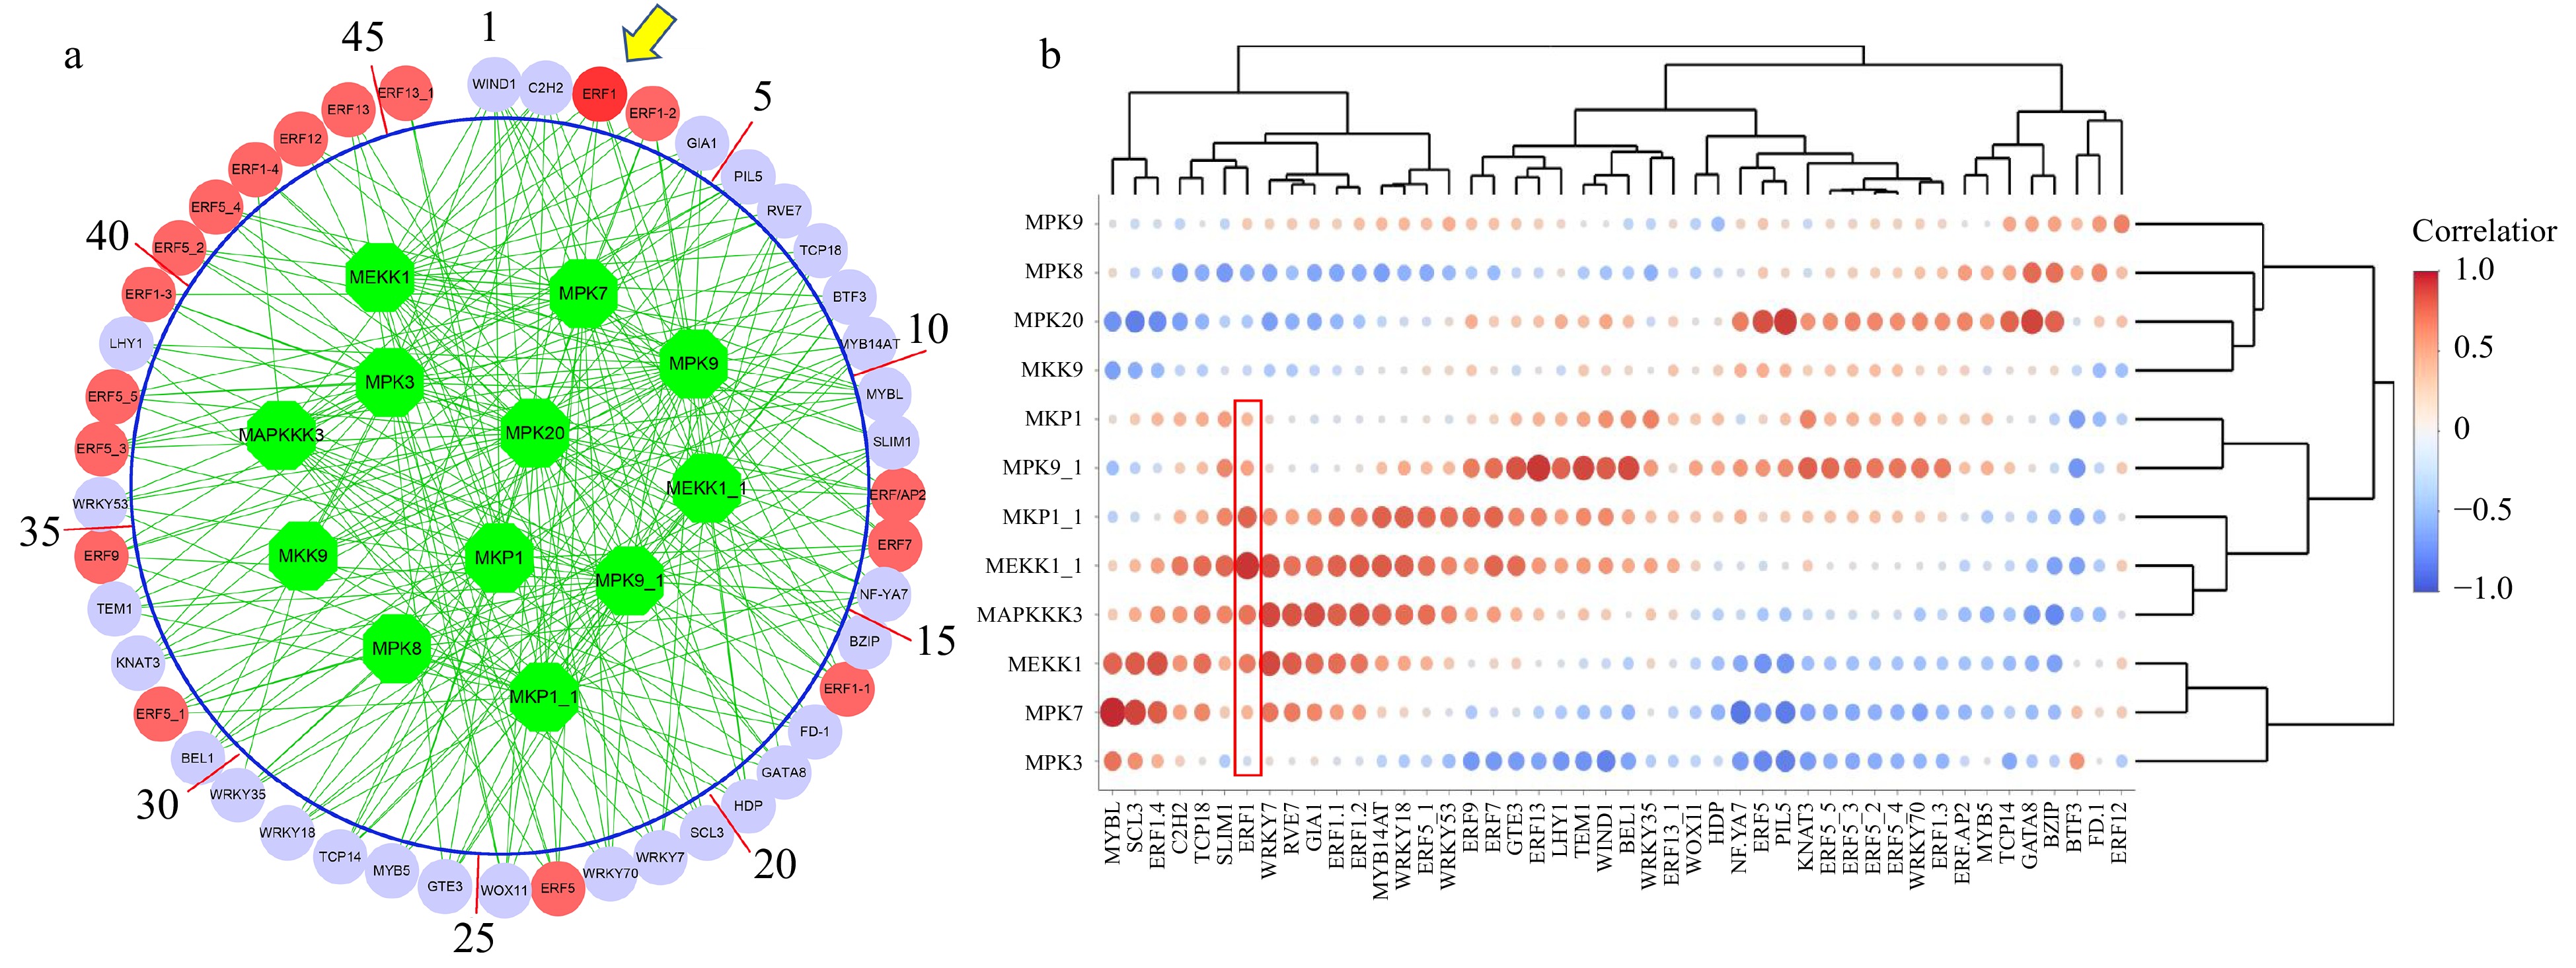
Figure 1. The association between MAKP signaling transduction pathway and transcription factors. (a) The association network was inferred by the Algorithm for Reconstruction of Gene Regulatory Network (ARACNE). Green circles represent MAPK signaling transduction pathway genes. Red circles represent ERF family genes, while lilac circles represent other regulatory genes inferred. (b) The heatmap of the logged correlation p-values (with a base of 10) between MAPK signaling transduction pathway genes and transcription factors. The sizes of the dots in the heatmap are negatively proportional to the p-values.
-
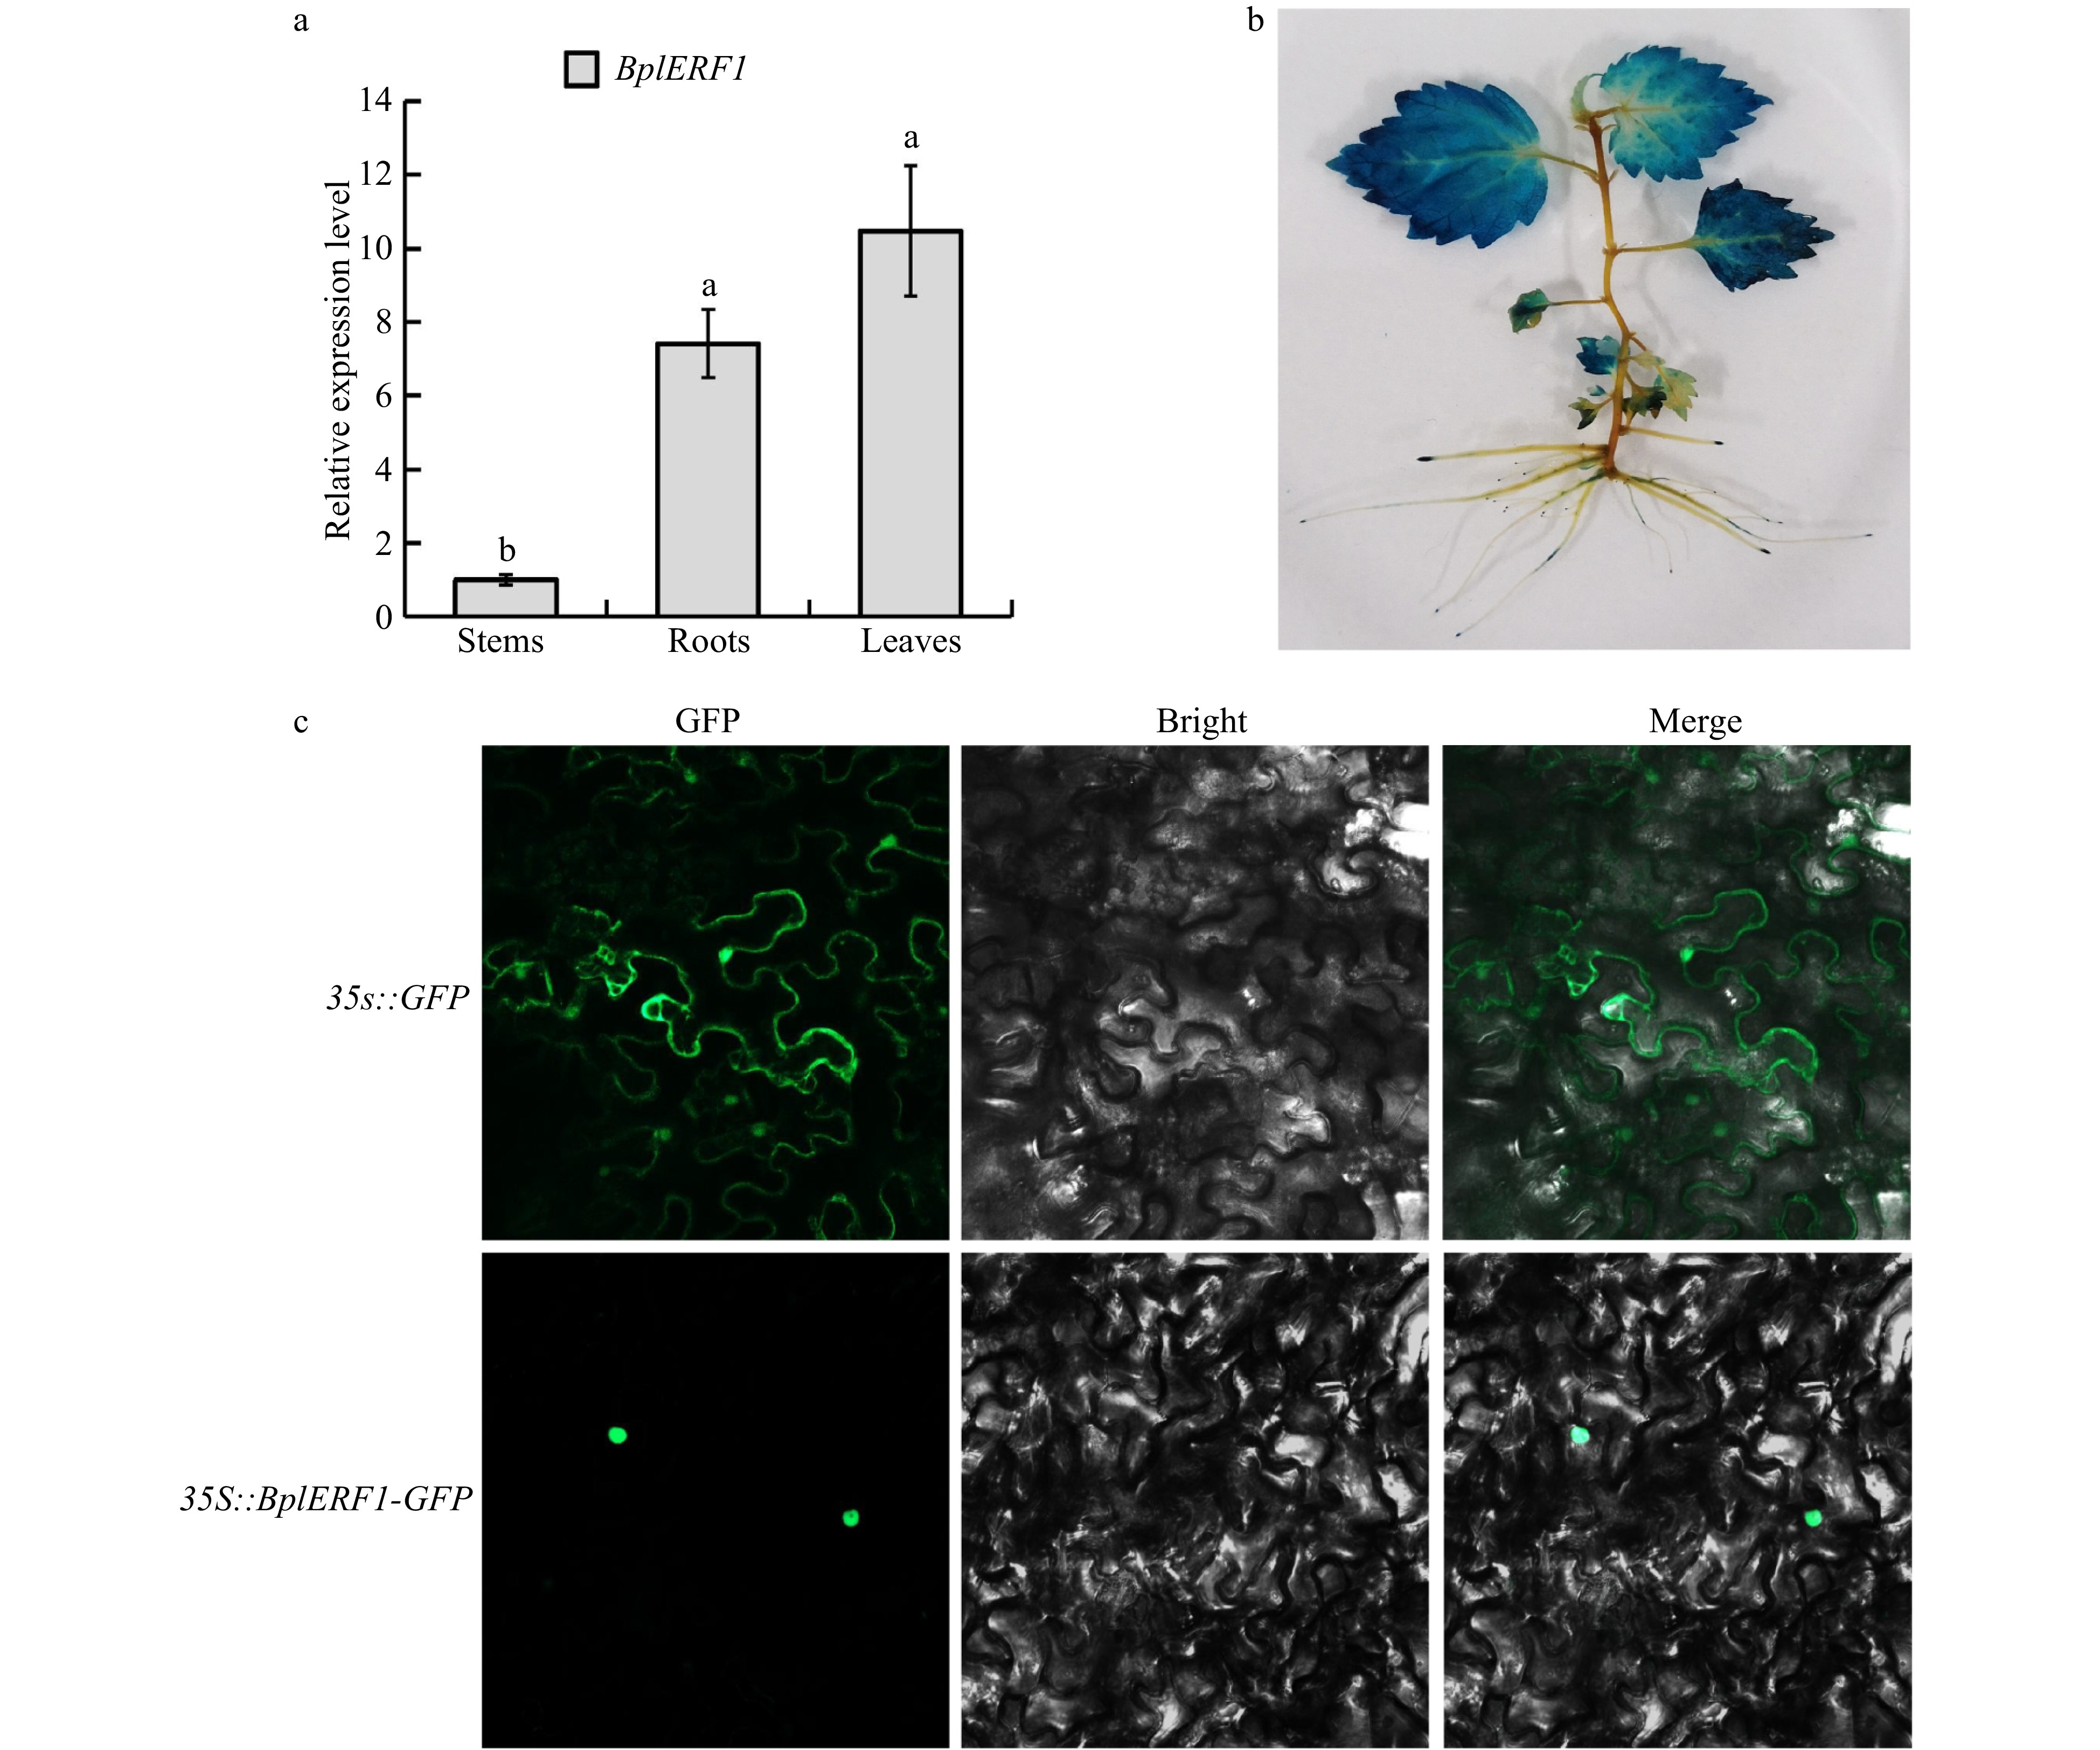
Figure 2. Tissue-specific expression patterns of BplERF1 gene and subcellular localization of BplERF protein. (a) Expression patterns and temporal, tissue-specific expression pattern of BplERF1 in the two-month-old wild-type Betula platyphylla plants measured by RT-qPCR under normal conditions. One-way ANOVA was performed to test the significant differences among tissues with a threshold F statistic (0.05). Multiple comparisons of BplERF1 expression levels in roots, stems and leaves were carried out by the Fisher's LSD method, and statistically significant differences are denoted by different lowercase letters. (b) GUS staining of the pBI101-BplERF1pro::GUS transgenic lines. (c) Subcellular localization of BplERF1 proteins in the onion epidermis cells. Two plasmid constructs, pBI121-35S::BplERF1-GFP and 35S::GFP (control), were used to transform tobacco epidermal cells. Images were obtained using a confocal laser scanning fluorescence microscope.
-
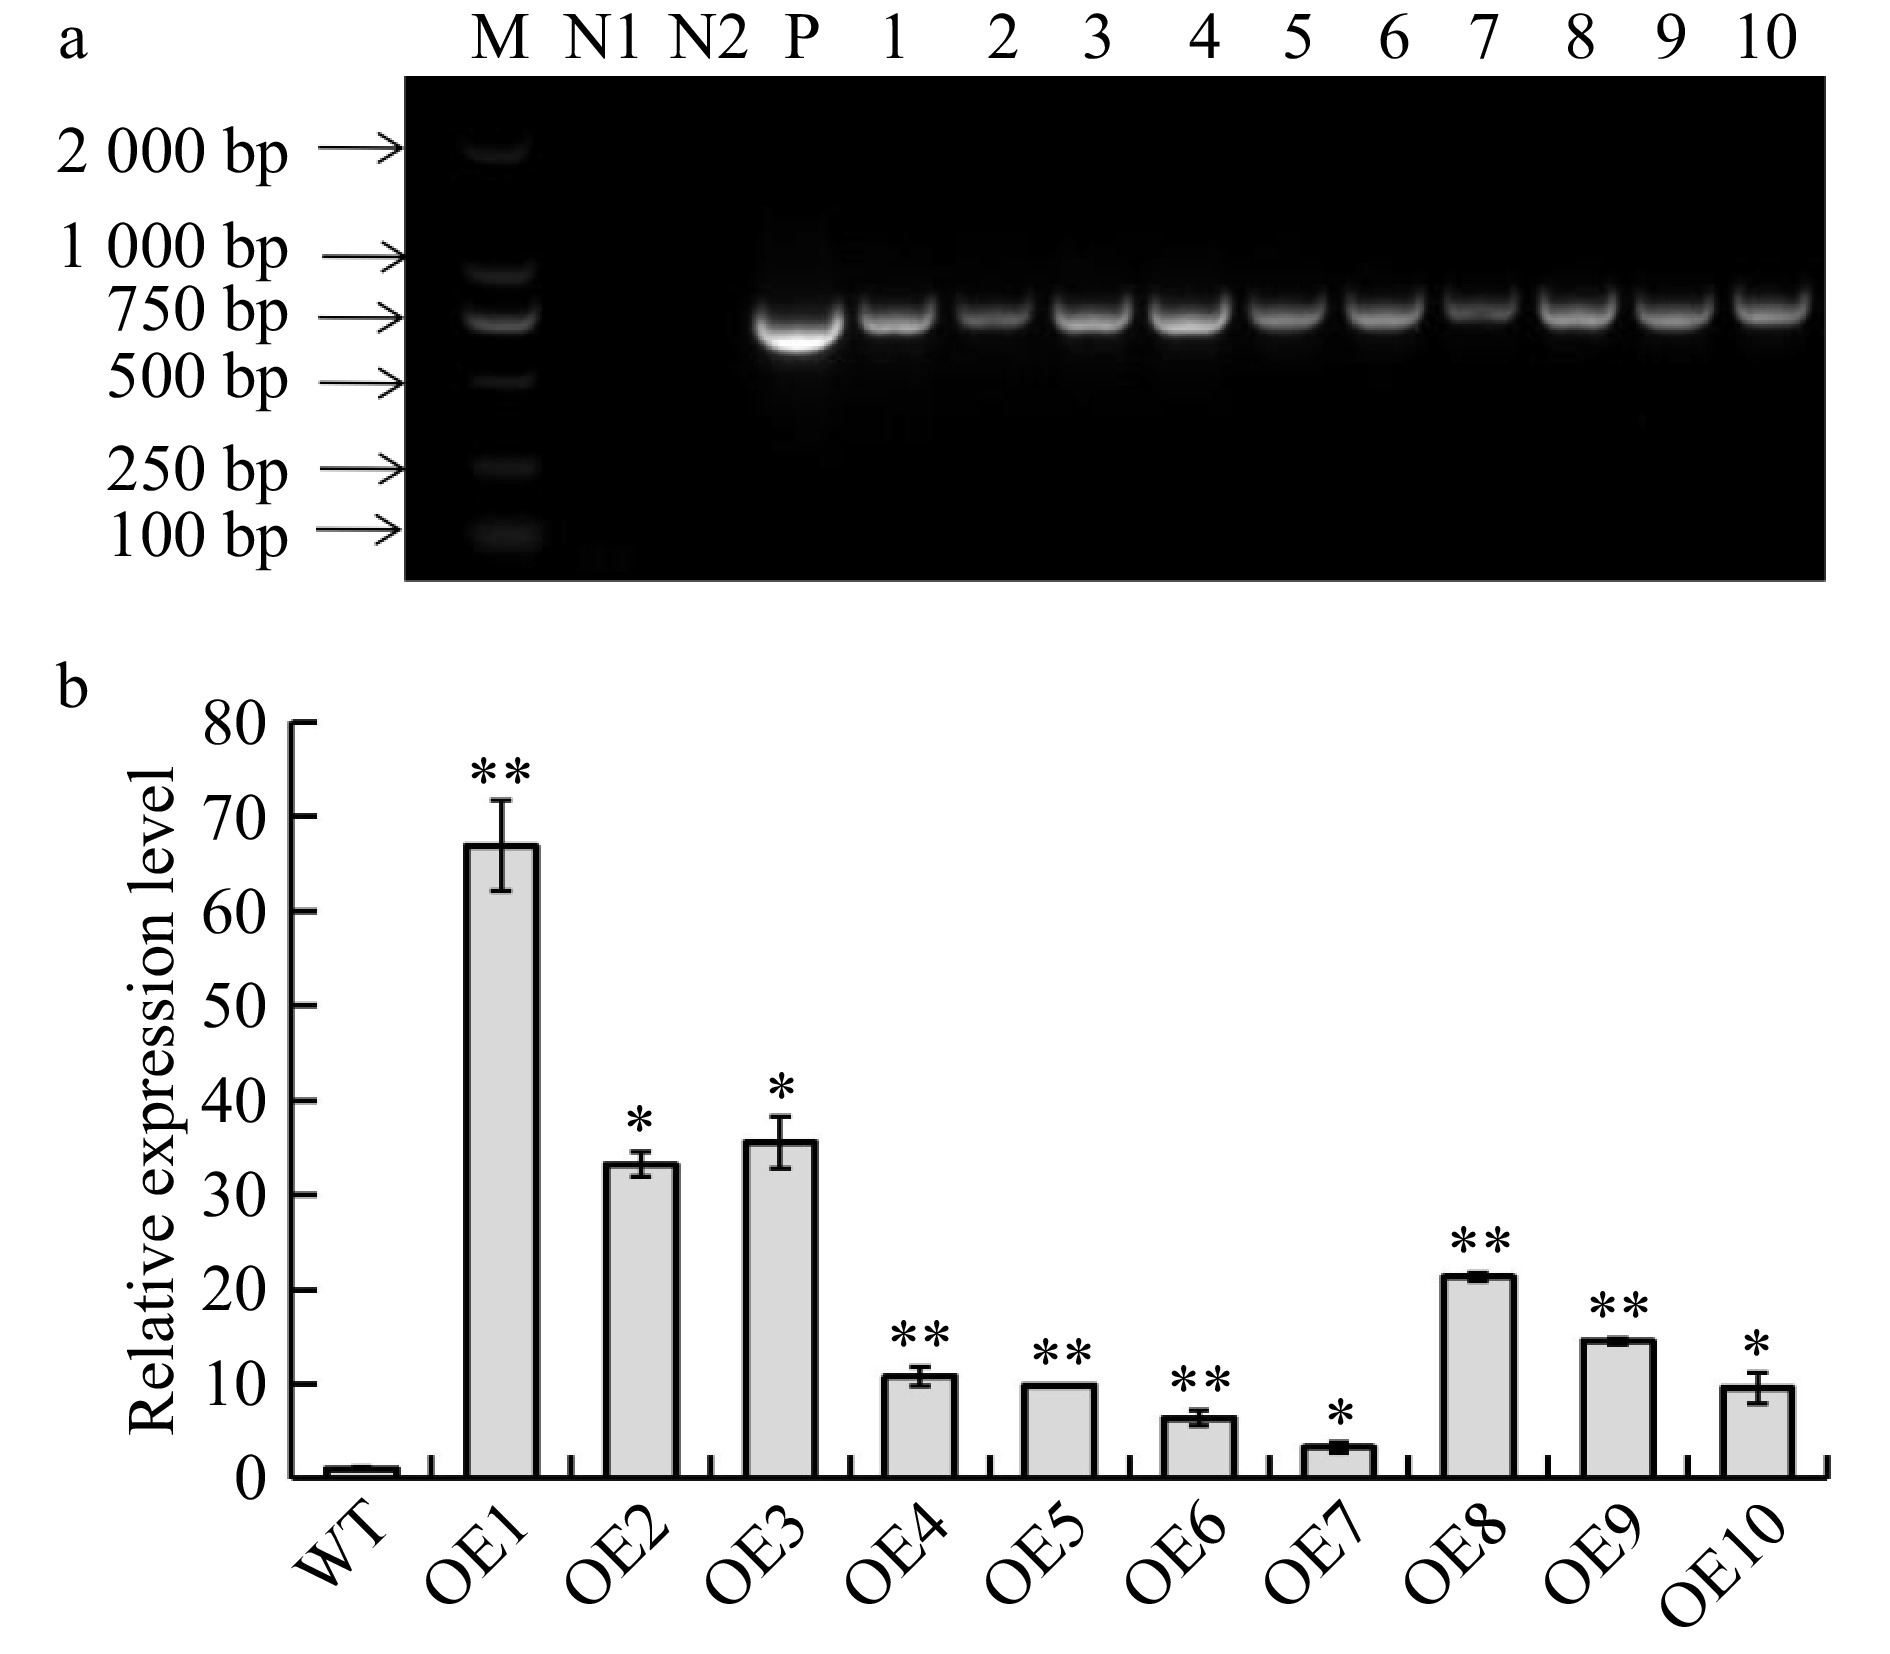
Figure 3. Identification and validation of BplERF1 transgenic lines. (a) Identification BplERF1 transgene in the transgenic lines using PCR with specifically designed primer pair. M: DL2000 Marker; N1: distilled water; N2: wild-type genomic DNA; P: positive plasmid carrying BplERF1. 1−10: Genomic DNA of transgenic lines. (b) RT-qPCR detection of cDNA from different transgenic lines. The relative expression levels in other transgenic lines were normalized using that of wild type, which was set as 1. Asterisks indicate levels of the significant difference of BplERF1 overexpression lines in comparison with wild type. Three biological replicates were used to calculate the means and standard deviations of each transgenic line, which are shown as bar heights and error bars, respectively (Student's t test, *p < 0.05, **p < 0.01).
-
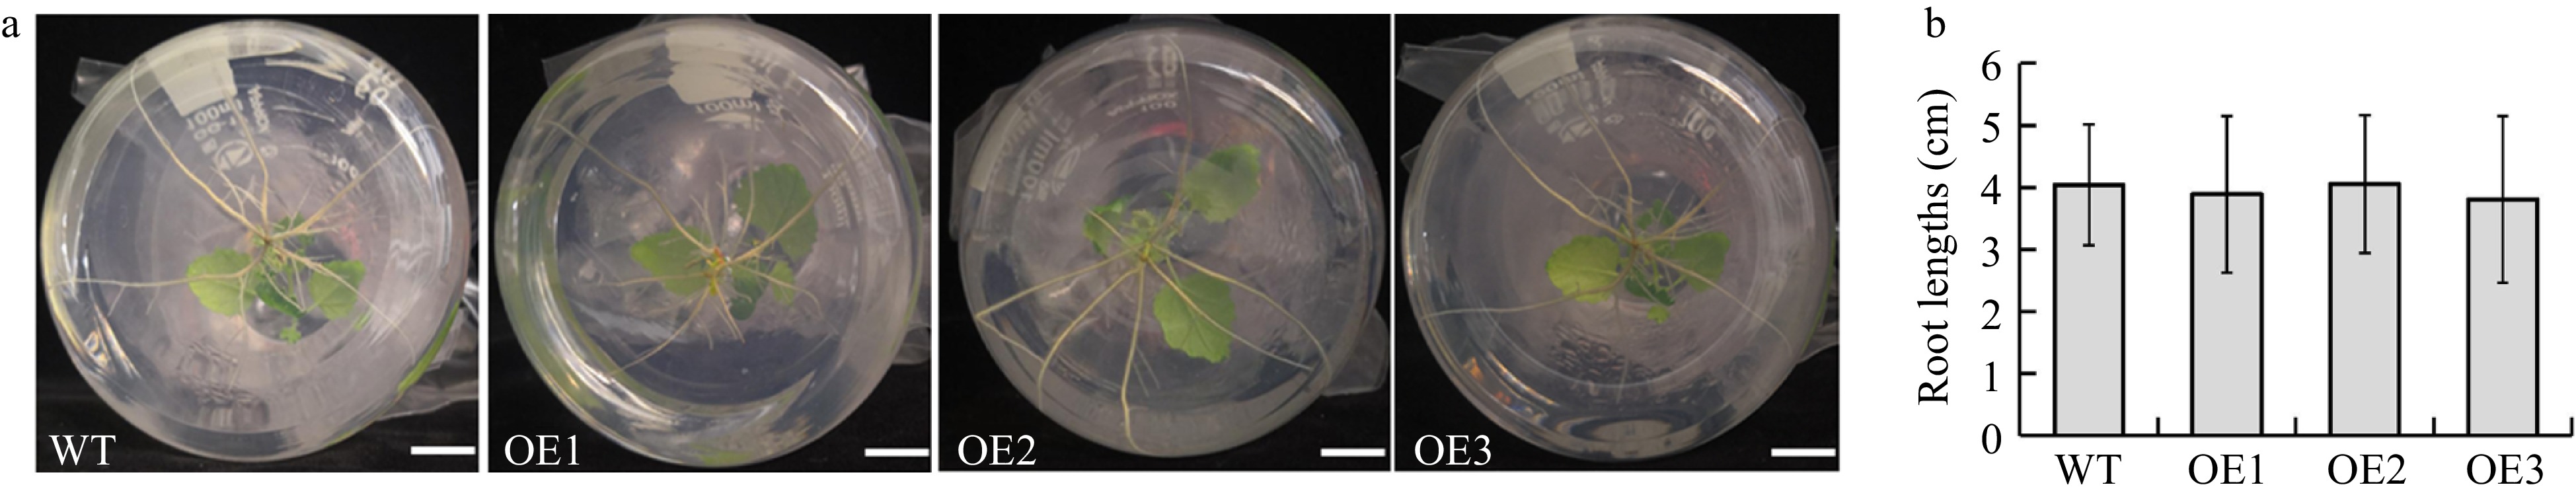
Figure 4. Comparison of root lengths between BplERF1 transgenic lines and wild type. (a) Morphological phenotypes of roots in BplERF1 transgenic lines and wild type plants. Bar represents 1 cm. (b) The root lengths of BplERF1 transgenic lines and wild type. Values are mean ± SD with 20 replicates.
-
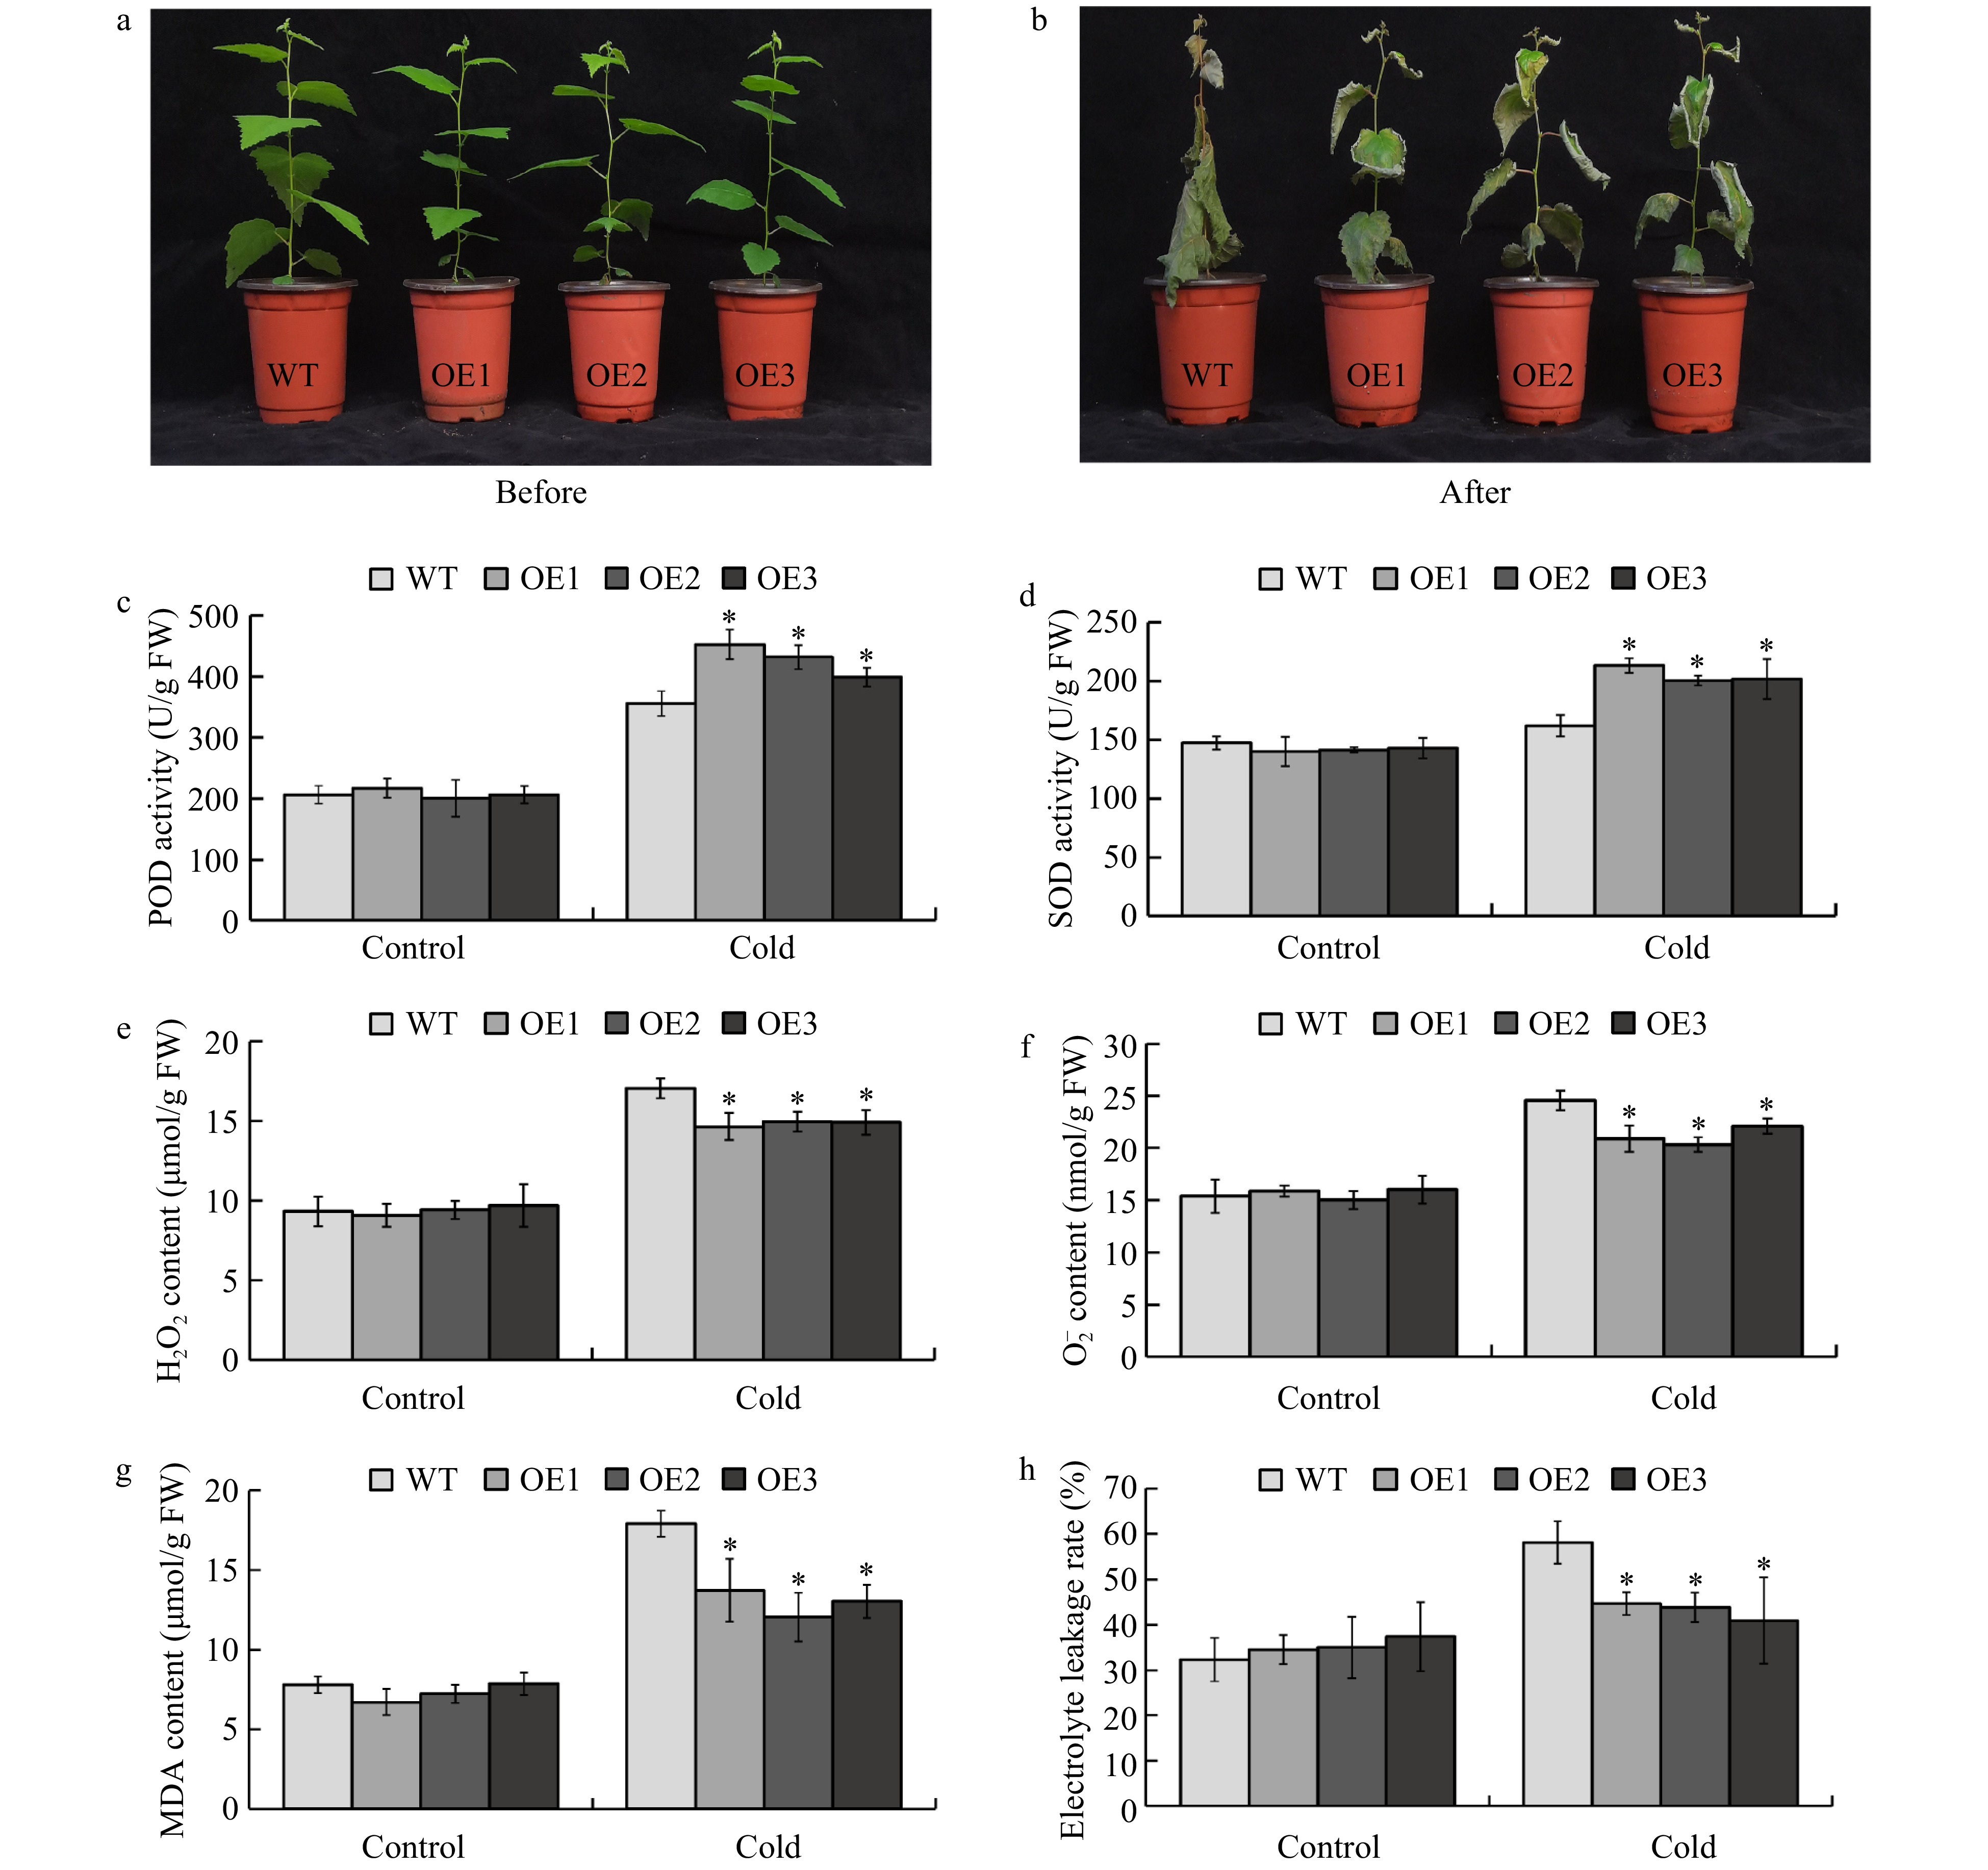
Figure 5. Overexpression of BplERF1 conferred augmented cold tolerance of transgenic lines through enhancing the scavenging capability. (a−b) Phenotypic performance of two-month-old BplERF1 transgenic lines and wild-type after a 4 °C for overnight treatment followed by a −5 °C freeze for 2 h. Photos were taken immediately before the cold treatment and after the cold treatment with a 10-d recovery. (c) POD activity. (d) SOD activity. (e) H2O2 content. (f)
${\rm O}_2^- $ content. (g) MDA content. (h) Electrolyte leakage. Three biological replicates were sampled and measured immediately after freezing treatment. An asterisk indicates a statistically significant difference between a treated group and a control group determined by Student's t test (p < 0.05). -
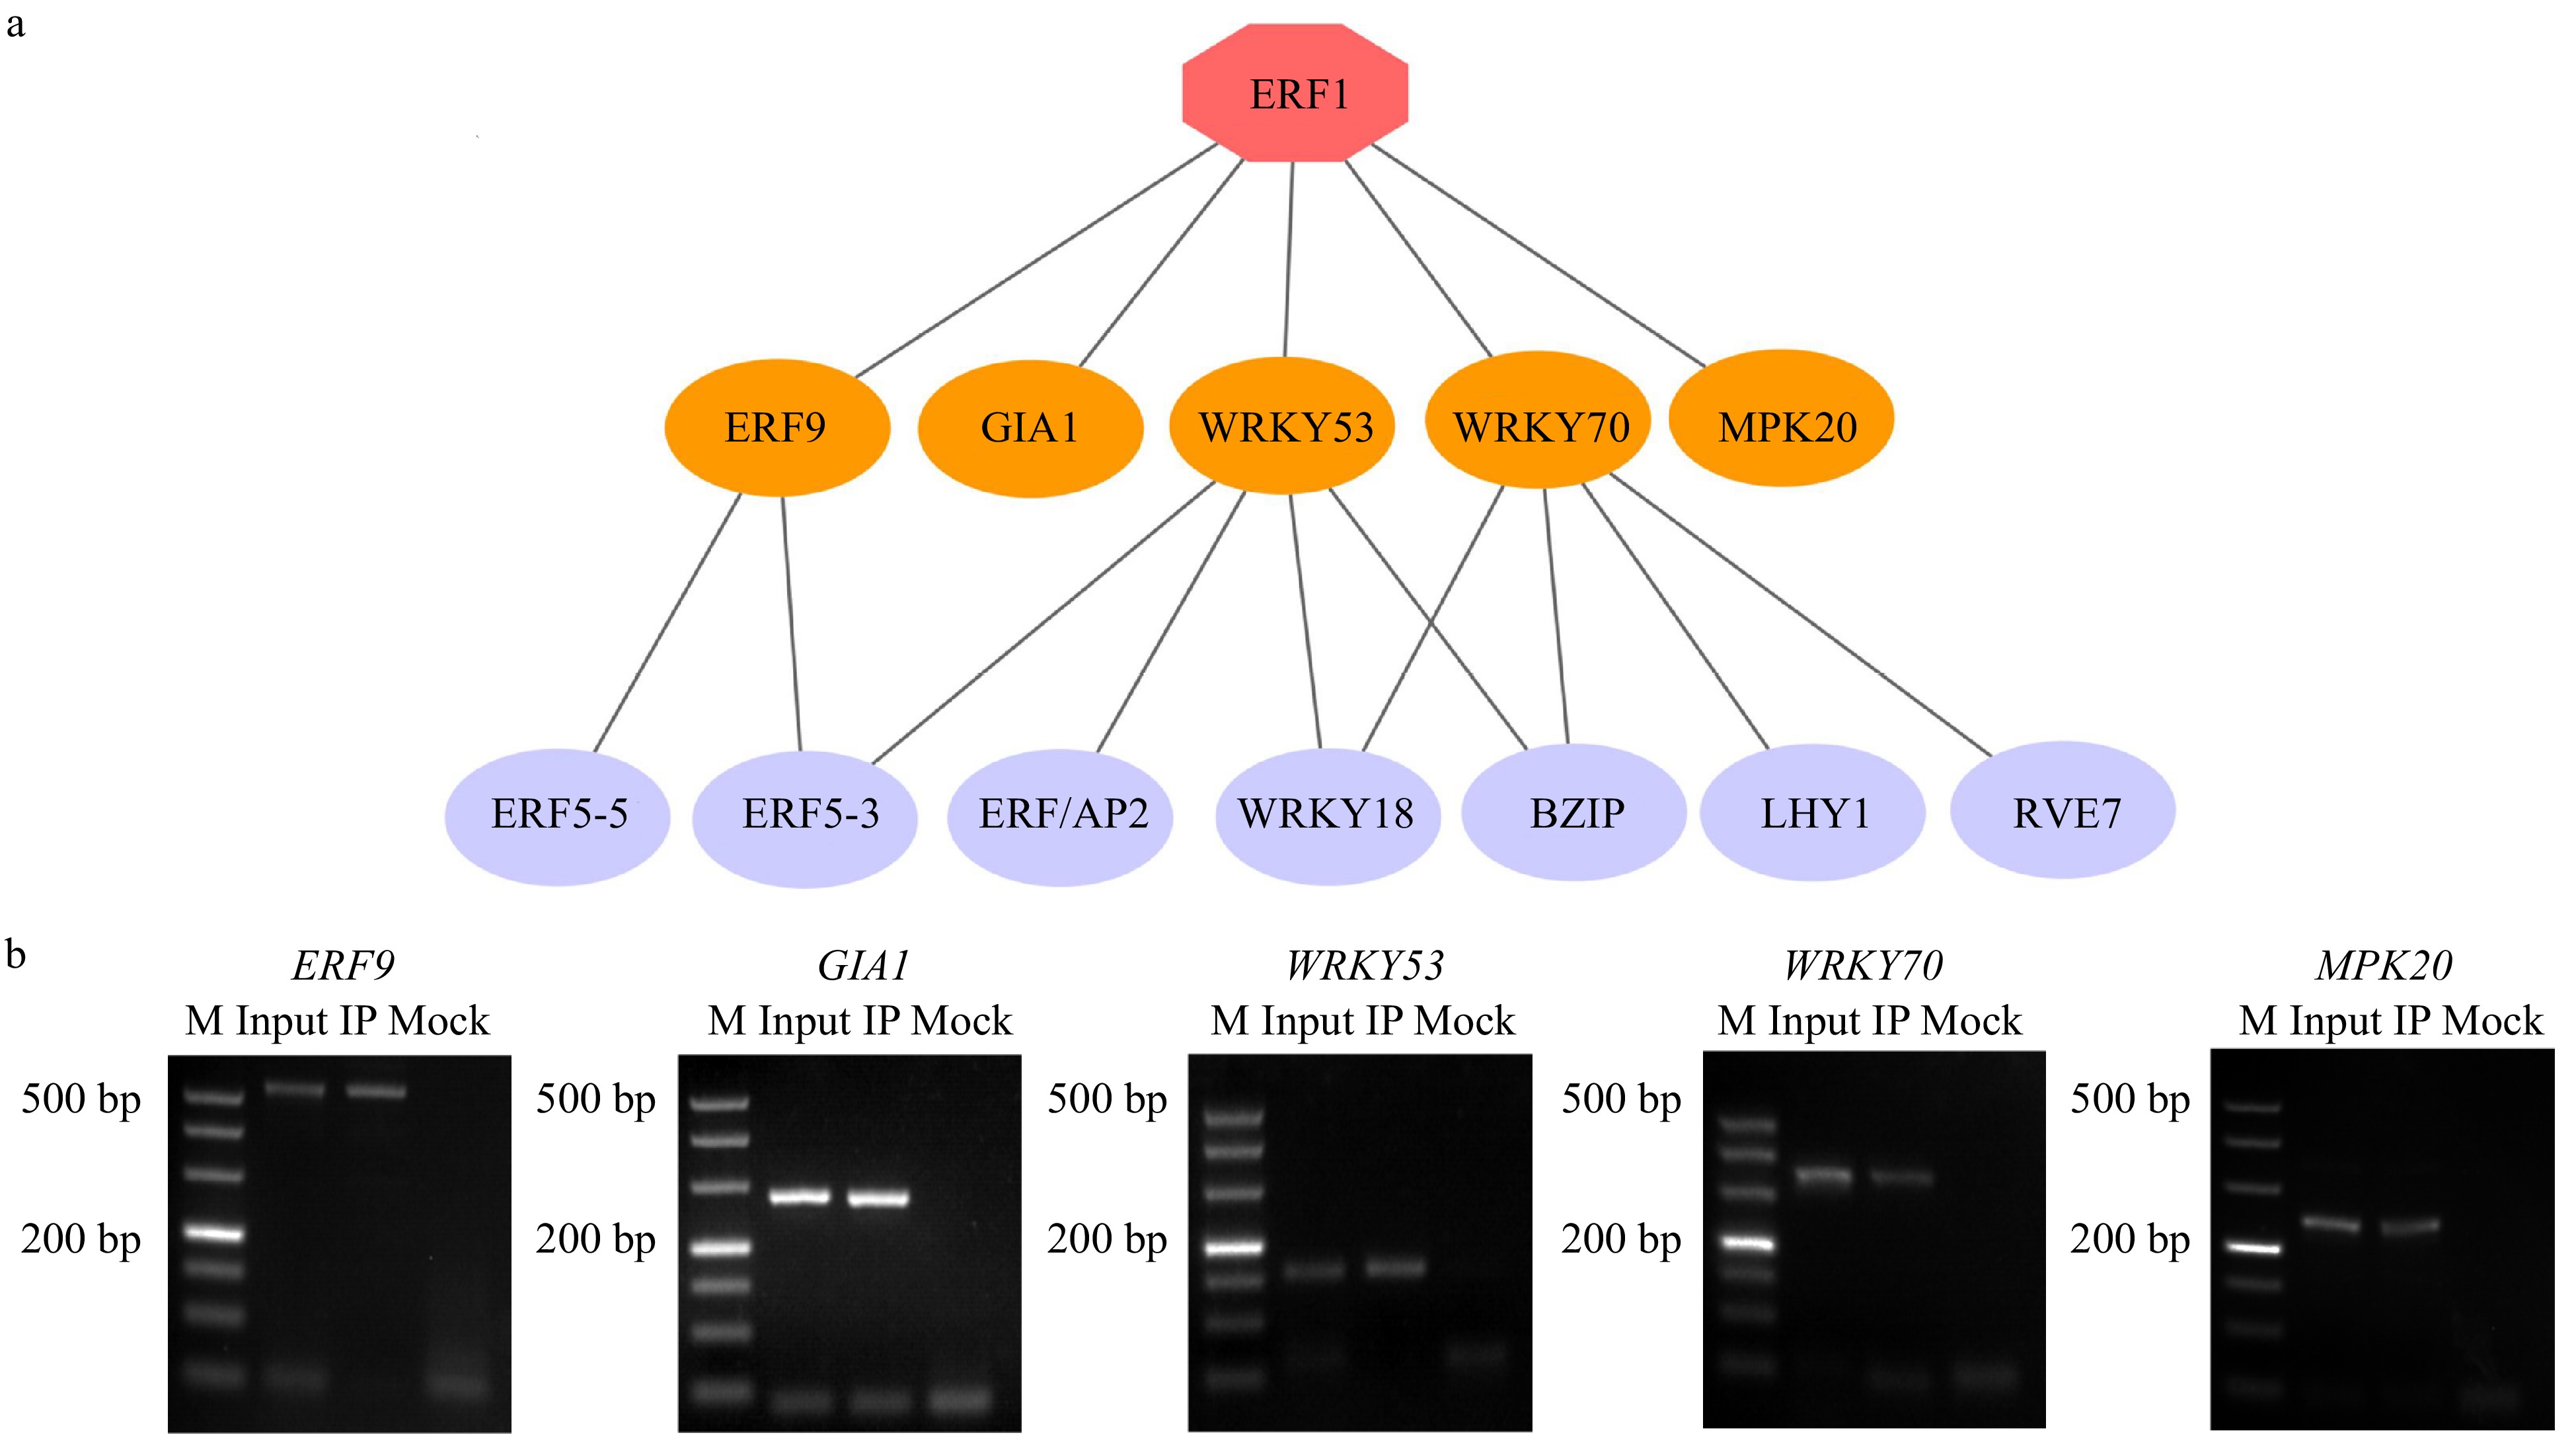
Figure 6. Construction of BplERF1-mediated multilayered gene regulatory network (ML-hGRN) in Betula platyphylla. (a) ML-hGRN-mediated by BplERF1 predicted using the Top-down GGM algorithm. Each orange oval represents a direct target gene of BplERF1. Each lilac oval represents an indirect gene of BplERF1. (b) ChIP-PCR analysis of the association of BplERF1 with its five putative target gene promoters in vivo using an anti-GFP tag antibody. M: DL500 Marker, the band is 500 bp, 400 bp, 300 bp, 200 bp, 150 bp, 100 bp, 50 bp from top to bottom.
-
Cold treatments
(wild type at 4 °C)Up regulated genes Down regulated genes Total DEGs 1 h versus 0.5 h 2,193 2,256 4,449 1.5 h versus 1 h 813 517 1,330 2 h versus 1.5 9 58 67 2.5 h versus 2 h 3 2 5 3 h versus 2.5 h 10 2 12 24 h versus 6 h 2,573 2,569 5,142 2 d versus 24 h 179 240 419 4 d versus 2 d 41 51 92 7 d versus 4 d 0 0 0 14 d versus 7 d 134 311 445 Table 1. Differentially expressed genes in leaves of Betula Platyphylla under cold treatment.
-
Sequences Core sequences Motif prediction TCAACAGGAT
AGTCAGCATACNGTTR
TGACMYBCORE
WRKY71OSTable 2. BplERF1-binding sites (cis-elements) identified by TF-centered Y1H method.
Figures
(6)
Tables
(2)