-
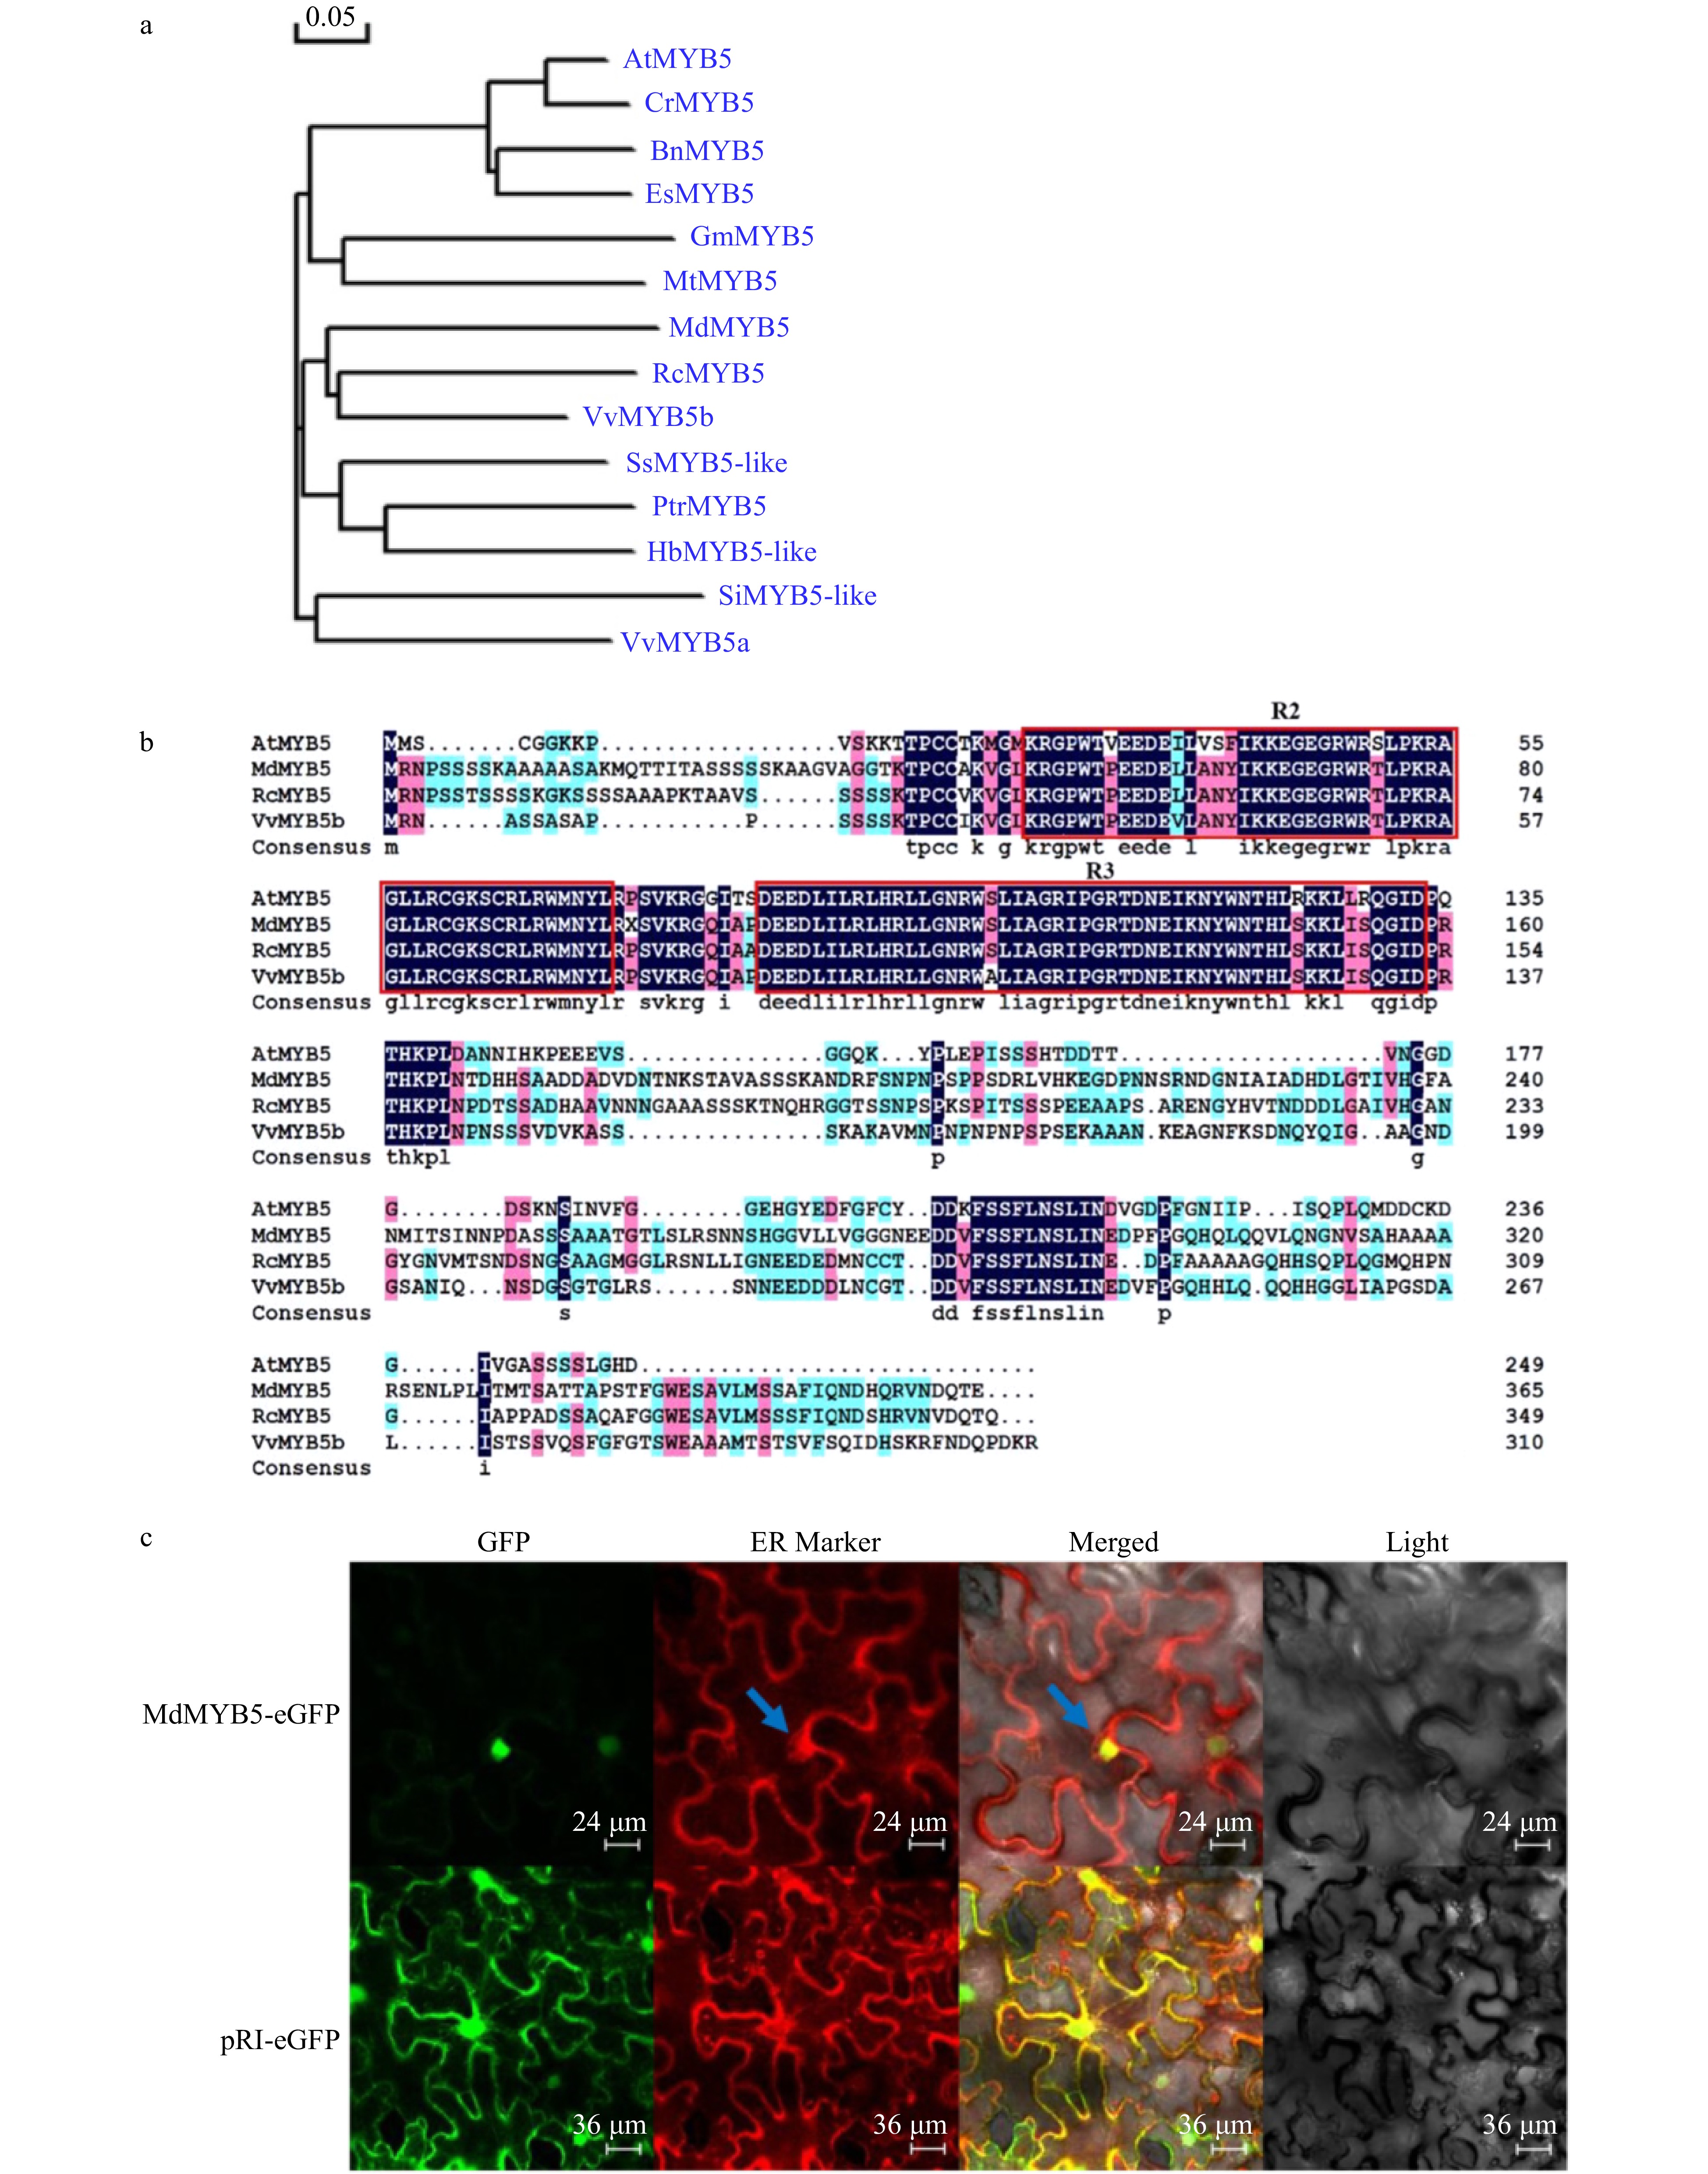
Figure 1. Isolation and characterization of MdMYB5 from apple. (a) Phylogenetic analysis of MdMYB5 compared with AtMYB5 orthologs. Si (Sesamum indicum); Vv (Vitis vinifera); Es (Eutrema salsugineum); Bn (Brassica napus); Cr (Capsella rubella); Rc (Rosa chinensis); Md (Malus domestica); Hb (Hevea brasiliensis); Ptr (Populus trichocarpa); Ss (Syzygium samarangense); Mt (Medicago truncatula); Gm (Glycine max); At (Arabidopsis thaliana). (b) The conserved R2R3 domain in MdMYB5, AtMYB5, RcMYB5 and VvMYB5b. (c) Subcellular localization of MdMYB5-eGFP in the epidermal cells of tobacco (the blue arrow indicates the location of the endoplasmic reticulum).
-
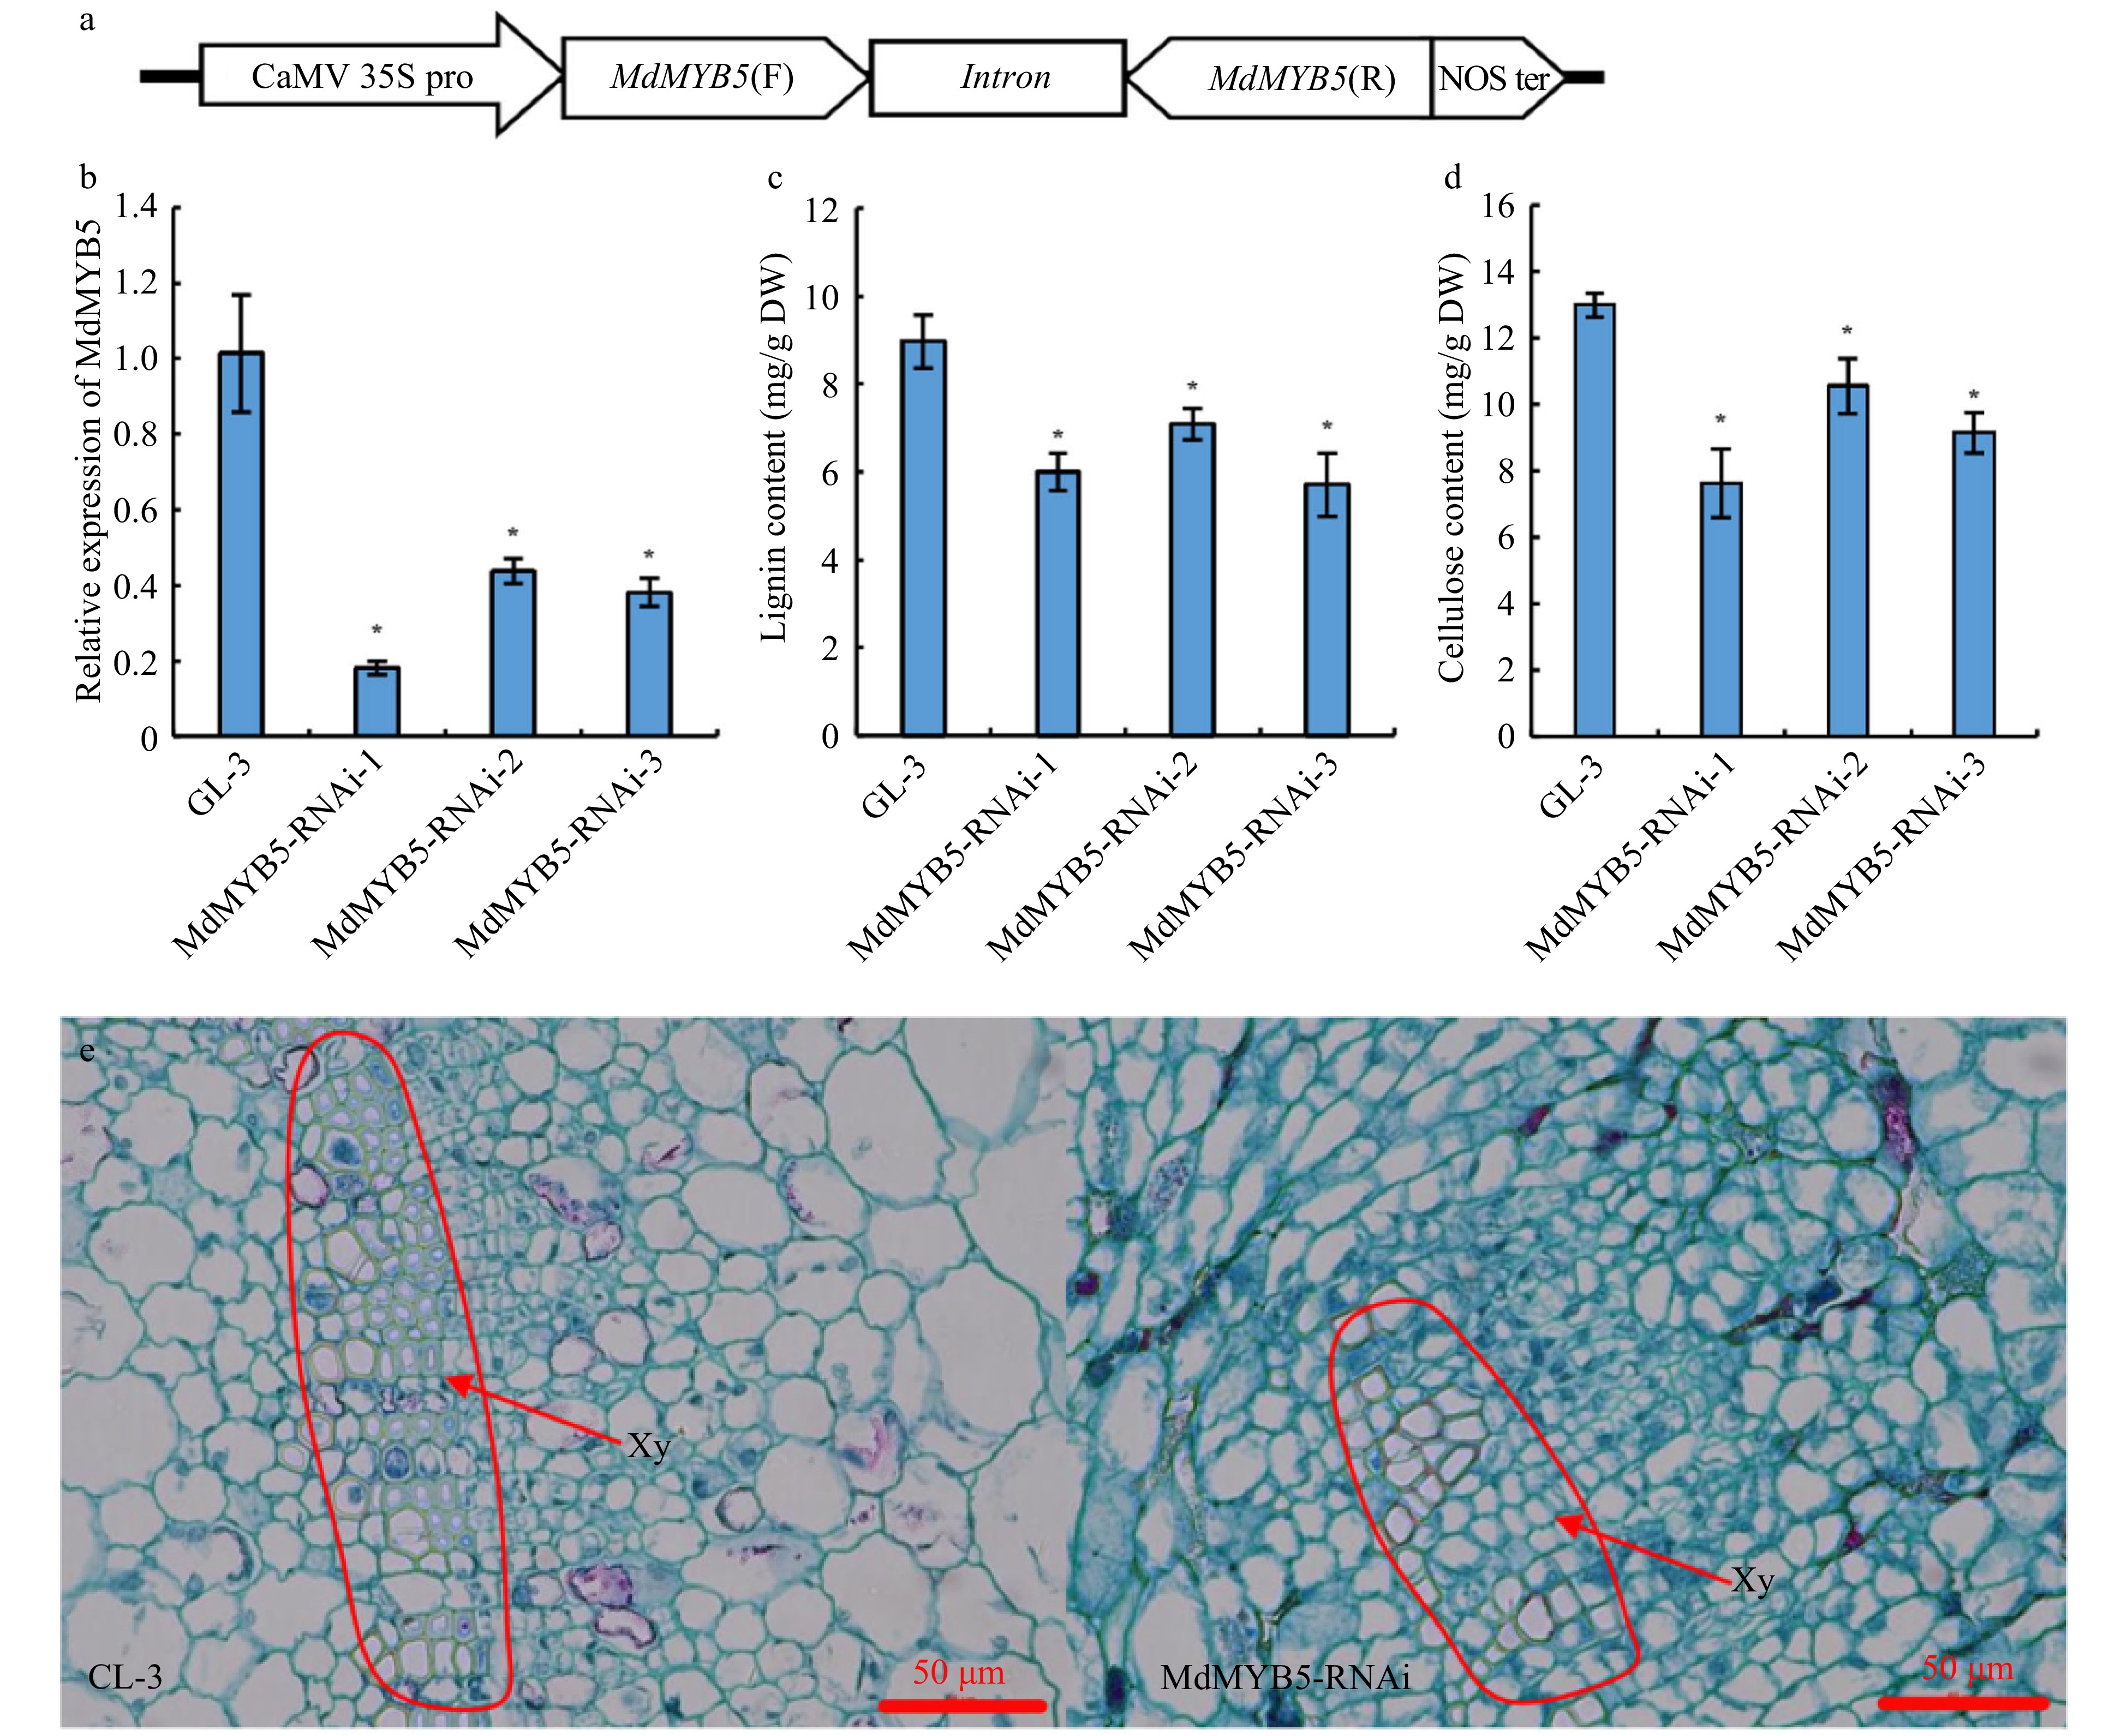
Figure 2. The formation of secondary cell wall was 'blocked' in MdMYB5-RNAi apple tissue cultures. (a) Schematic showing the RNAi vector for MdMYB5 gene. (b) Transcriptional levels of MdMYB5 in RNAi apple tissue cultures. The error bars indicate the standard deviation (SD, n = 3). * Indicates significant differences between the MdMYB5-RNAi apple tissue cultures and GL-3 (p < 0.05, based on t-test). (c) Lignin content in MdMYB5-RNAi apple tissue cultures. (d) Cellulose content in MdMYB5-RNAi apple tissue cultures. (e) The observation of transverse sections by microscopy, which were taken from the basal stems of GL-3 and MdMYB5-RNAi apple tissue cultures. The red arrow indicates the thickened secondary cell wall. Xy = xylem.
-
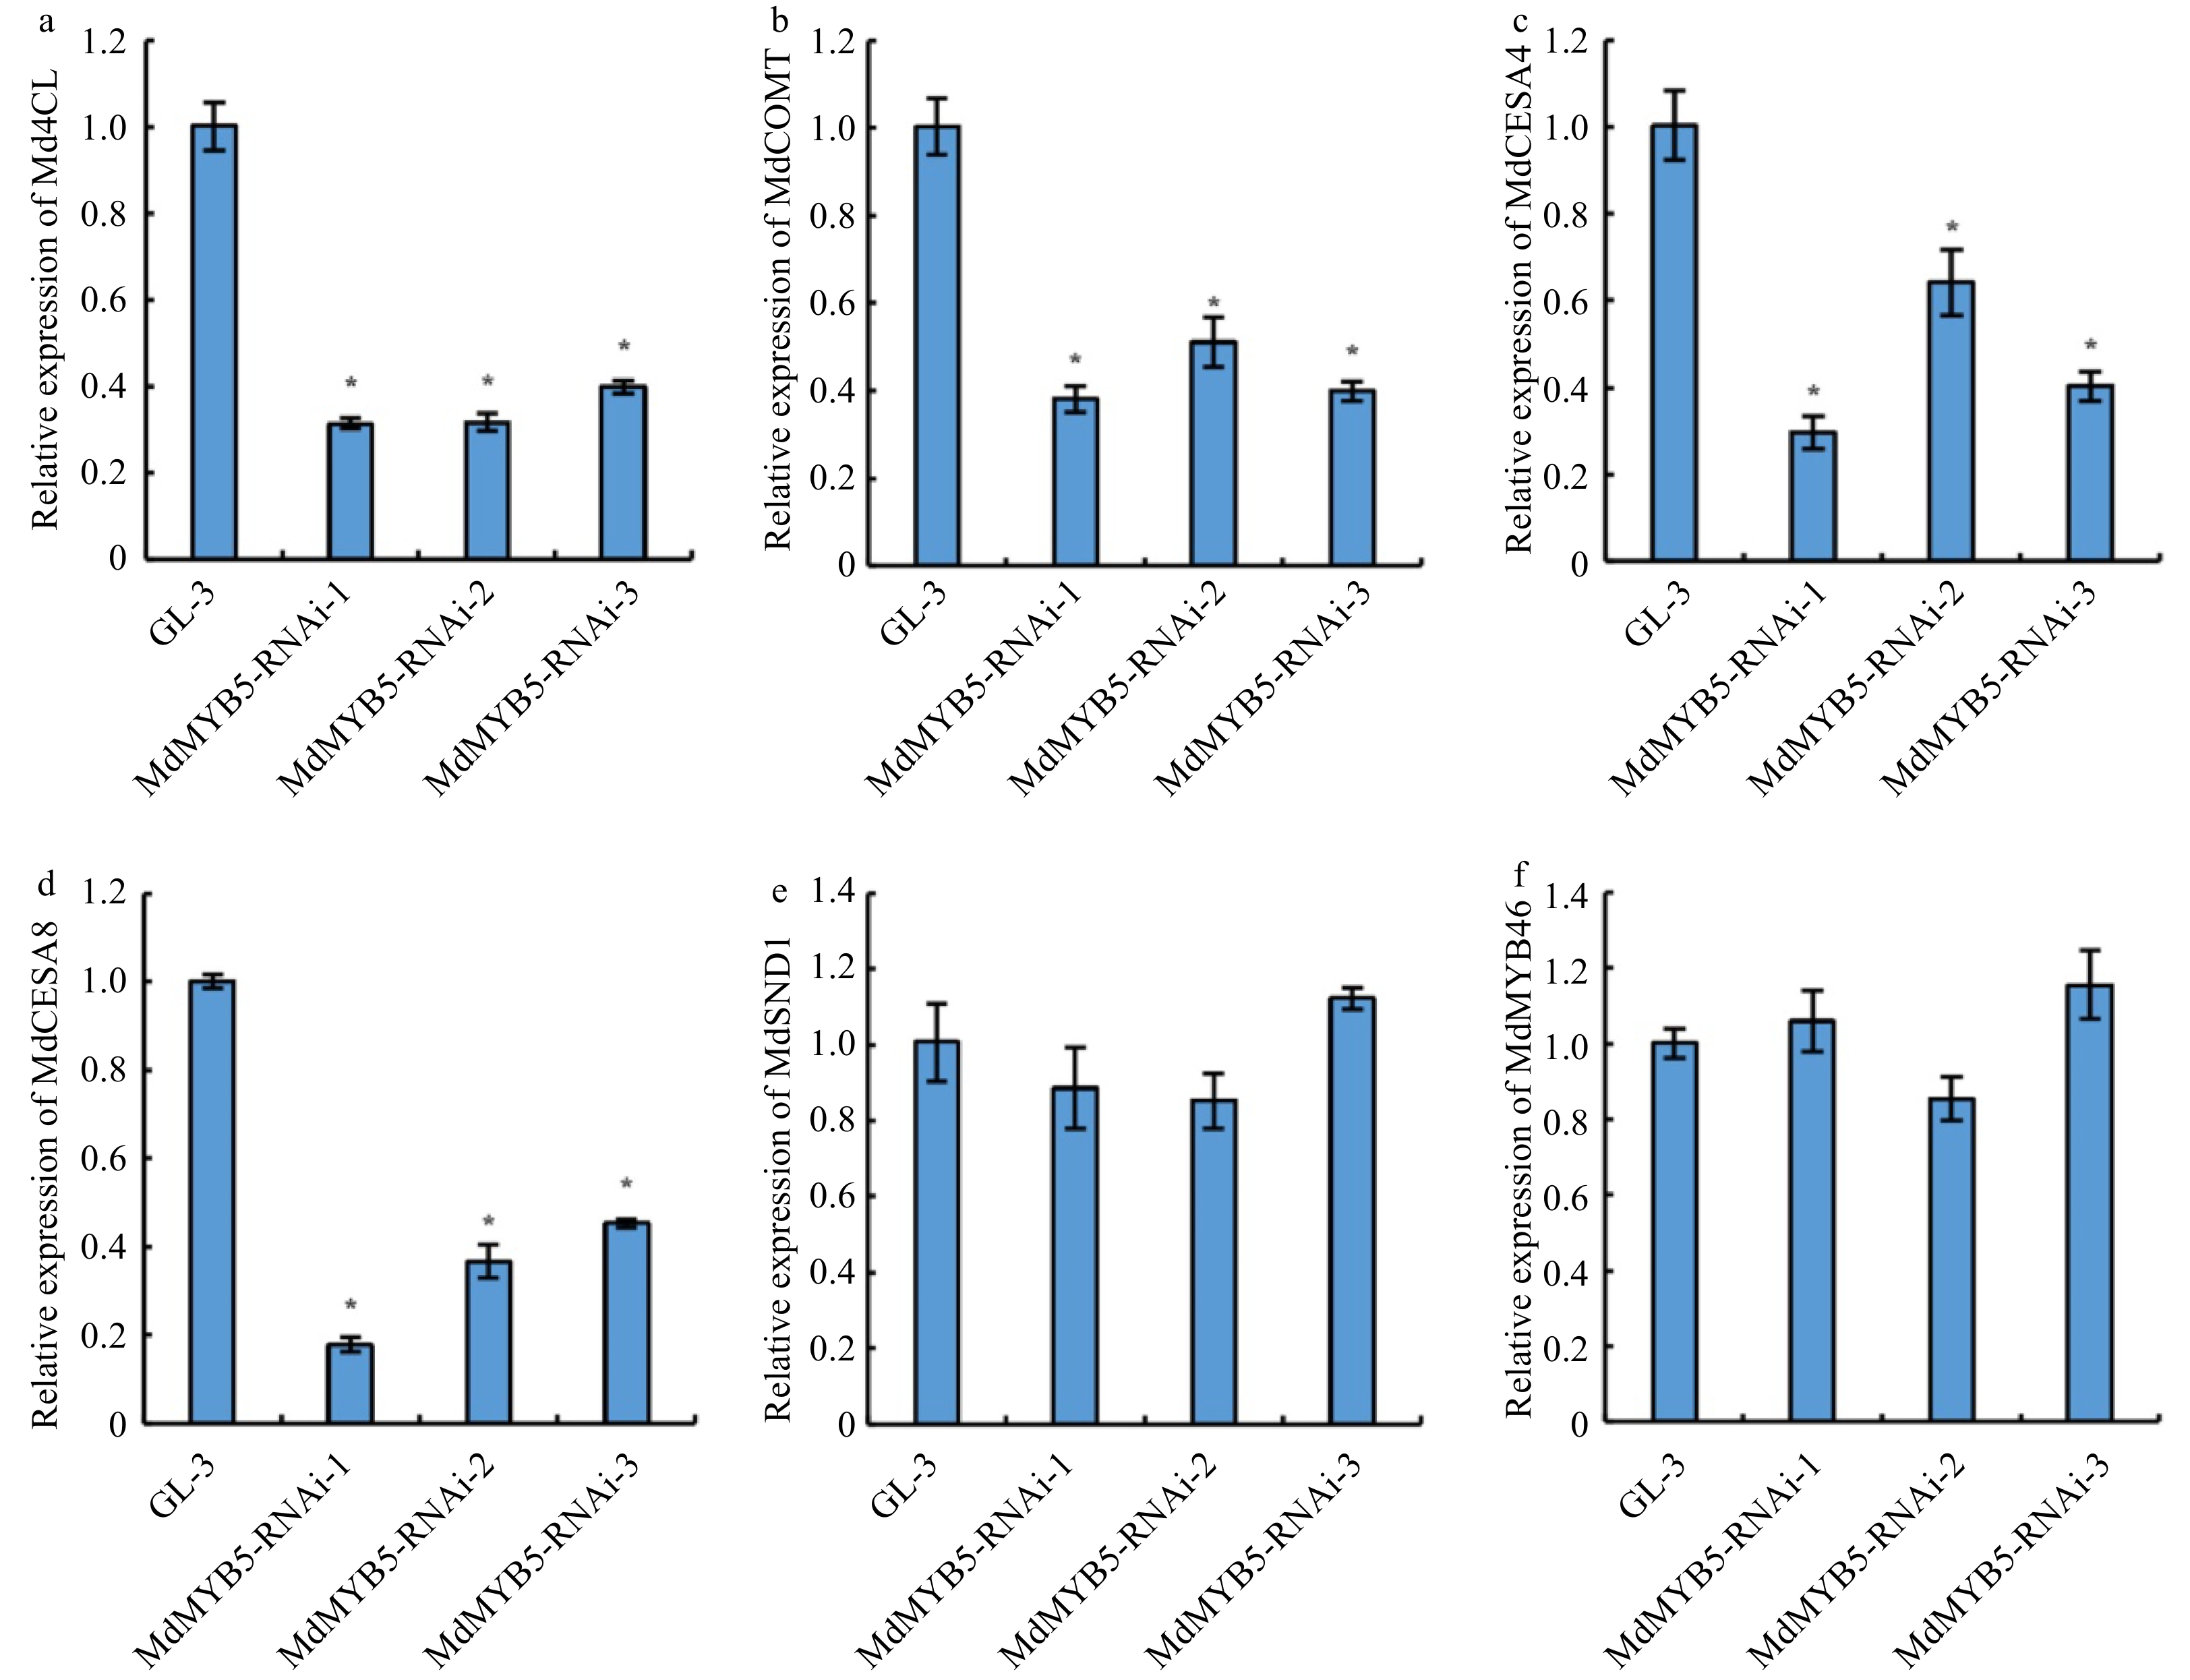
Figure 3. Transcriptional levels of lignin and cellulose biosynthesis related genes in MdMYB5-RNAi apple tissue cultures. (a−f) The error bars indicate the standard deviation (SD, n = 3). * Indicates significant differences between GL-3 and the MdMYB5-RNAi apple lines (p < 0.05, based on t-test).
-
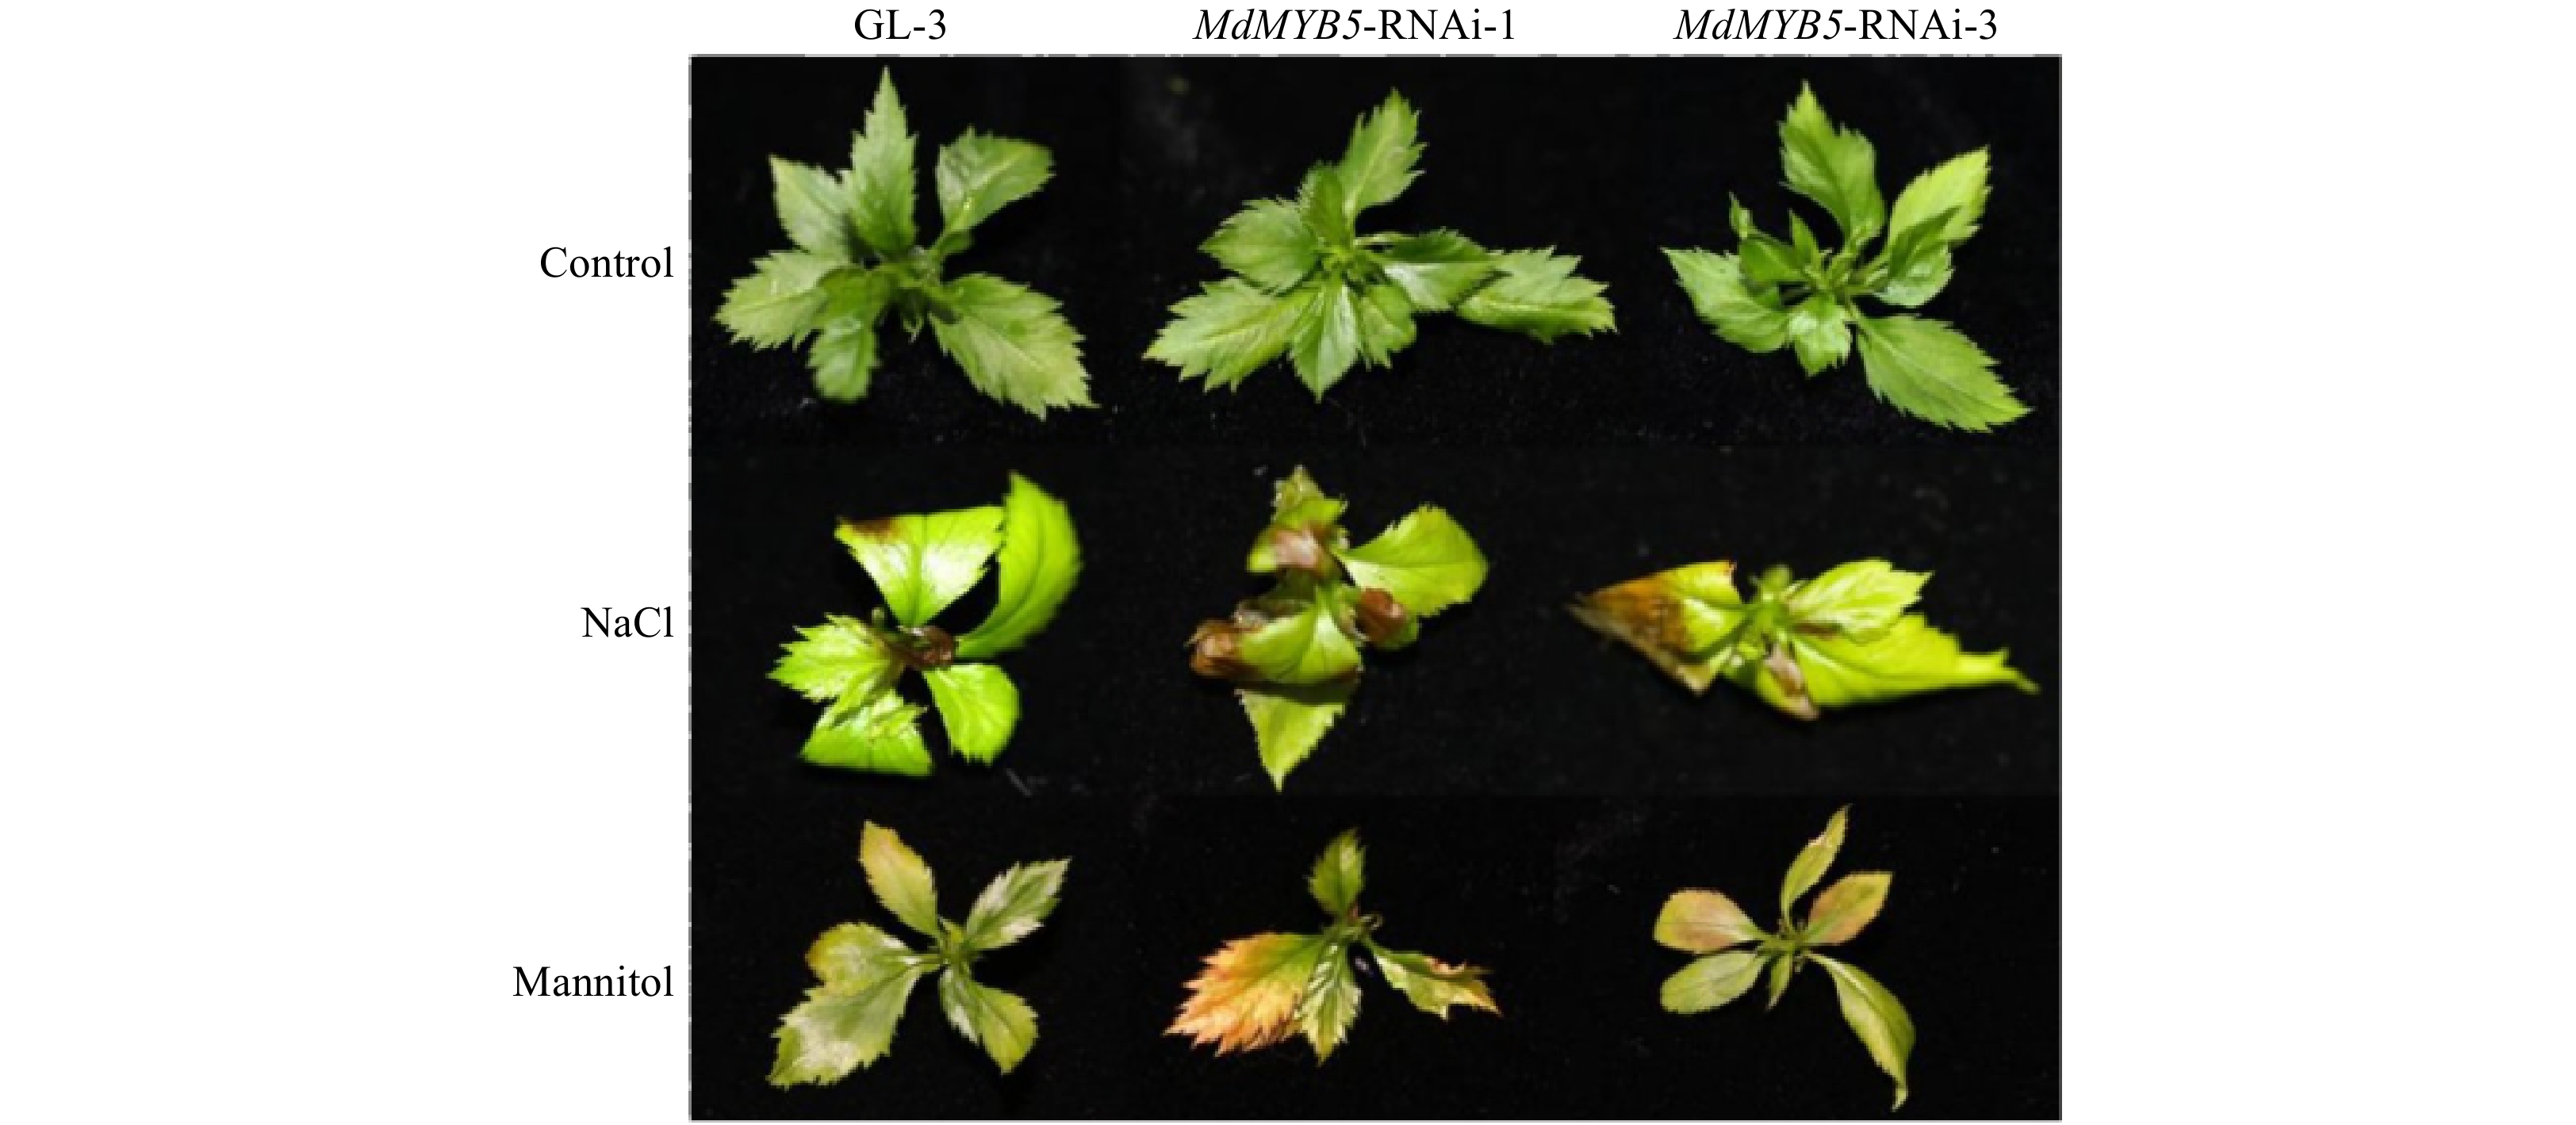
Figure 4. The phenotype of MdMYB5-RNAi apple tissue cultures under salt and osmotic stress.
-
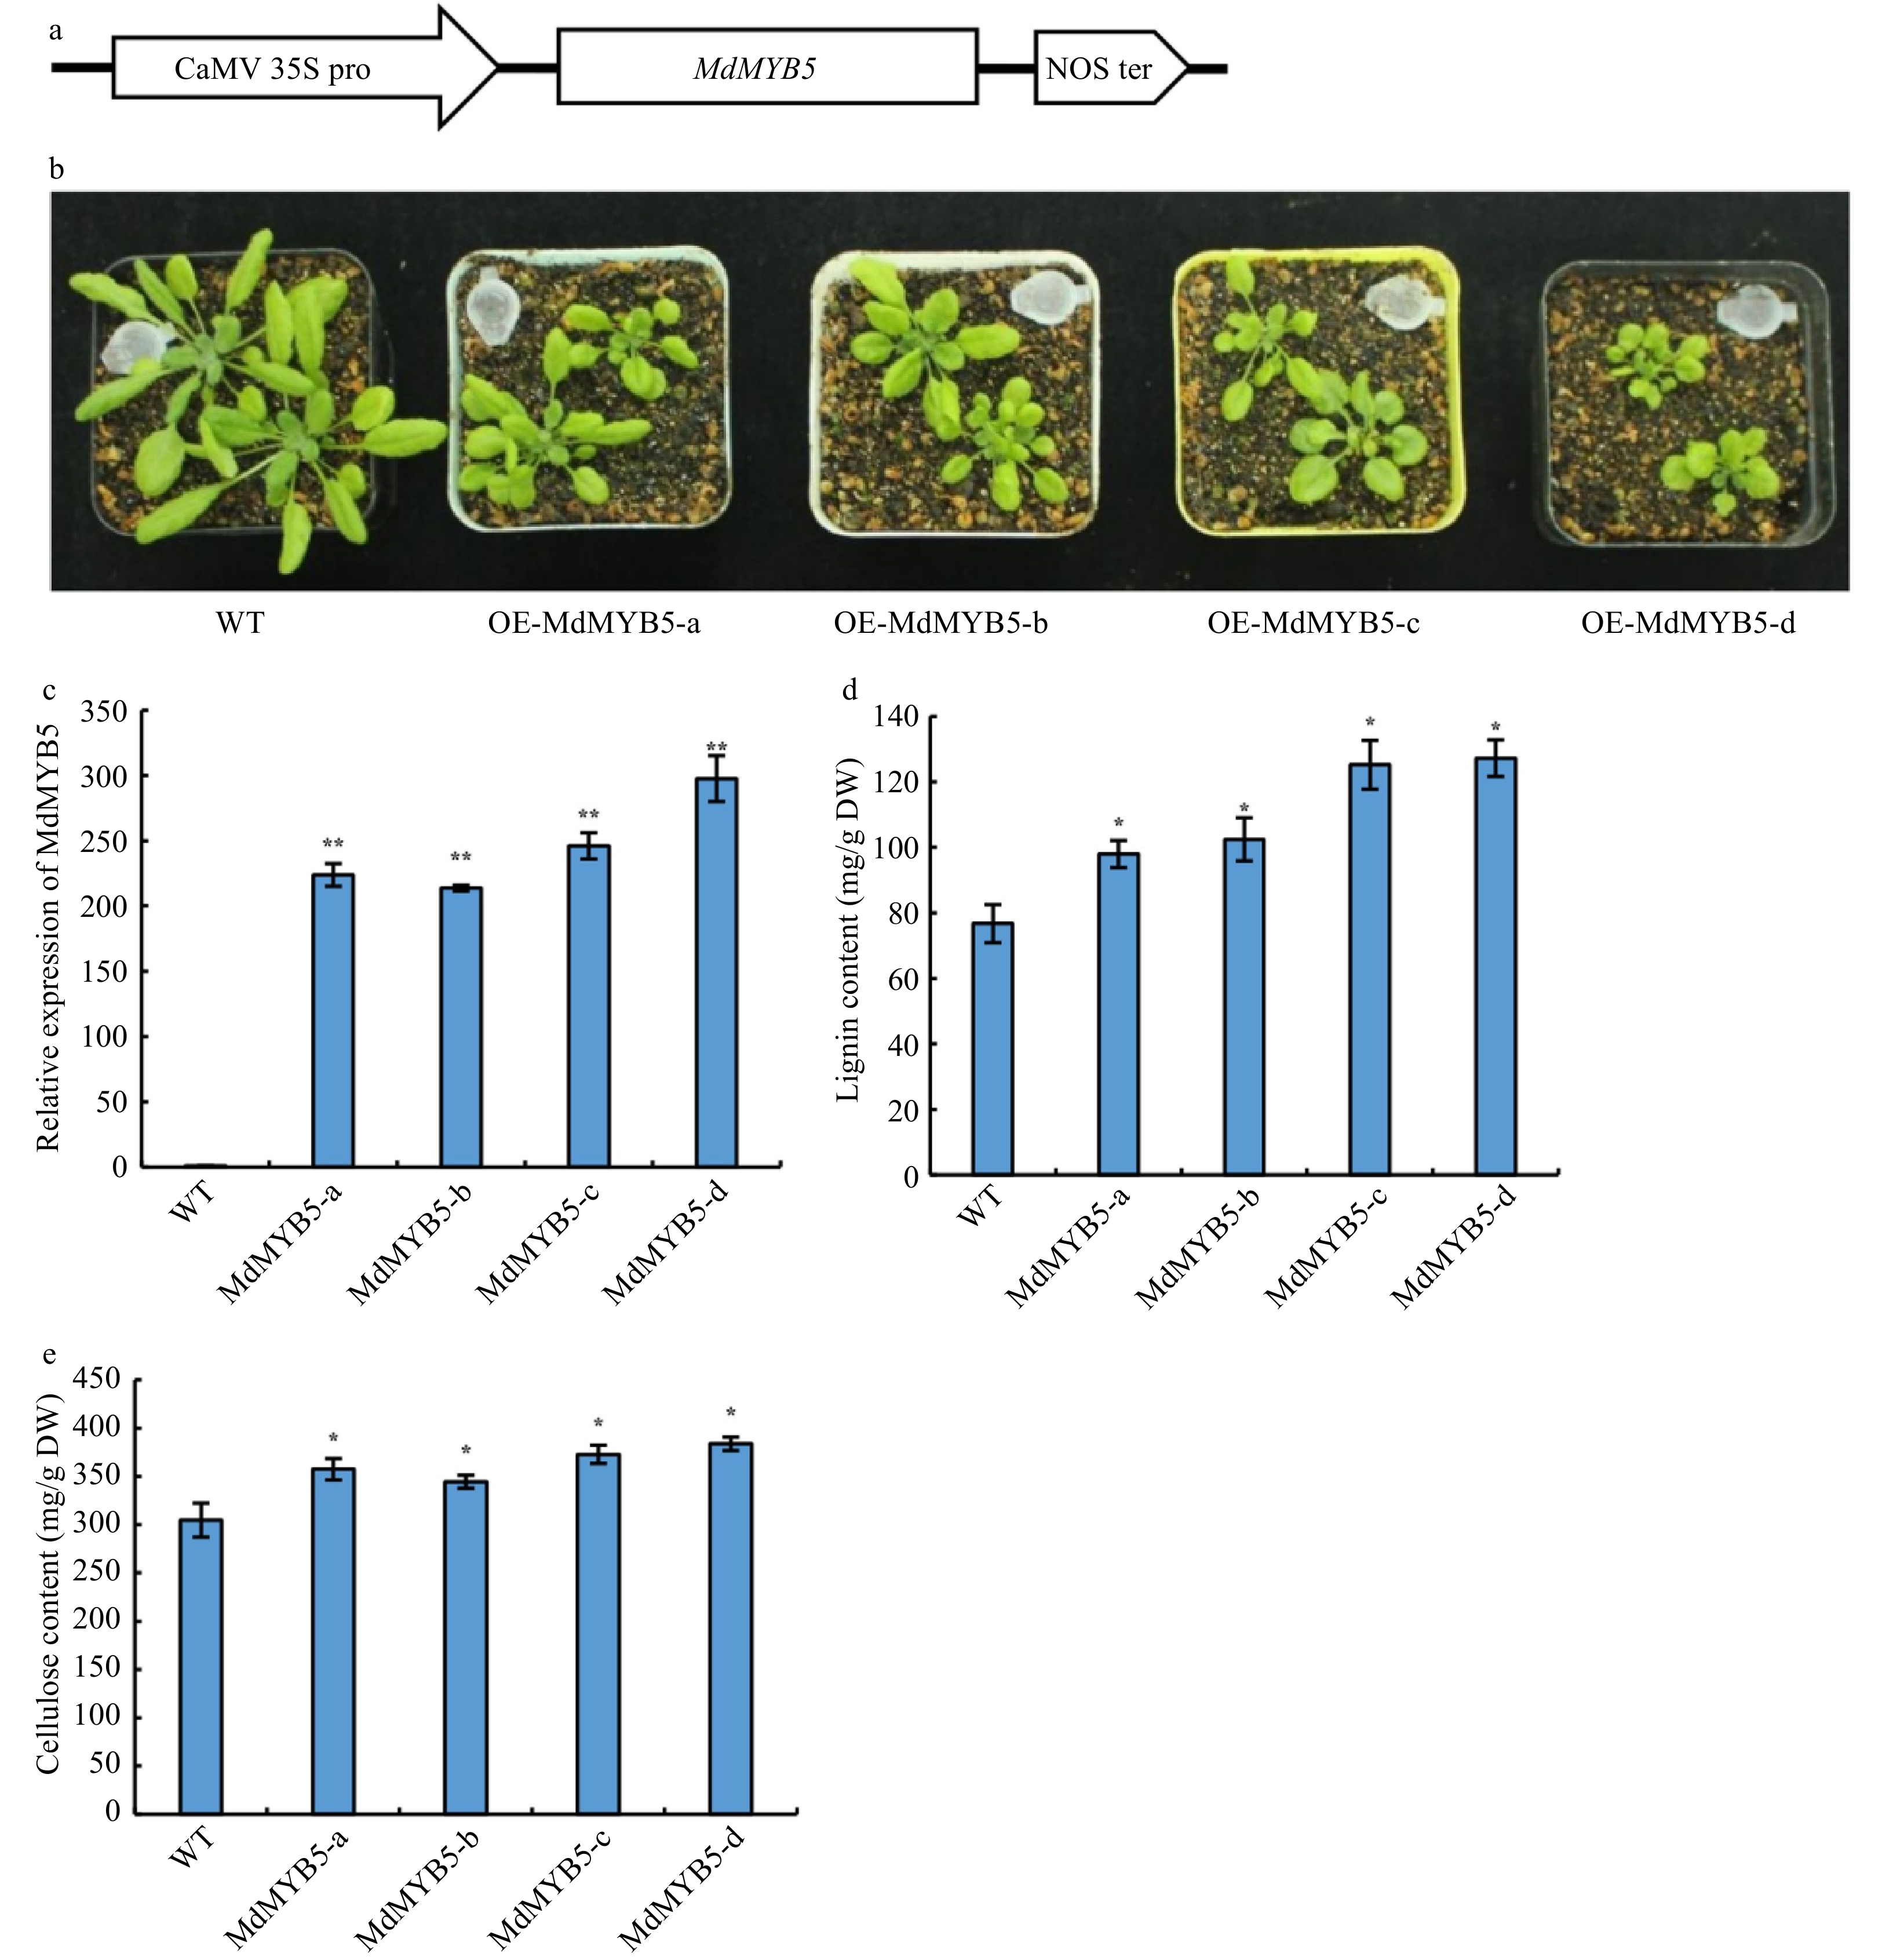
Figure 5. MdMYB5 promotes the formation of secondary cell wall in Arabidopsis. (a) Schematic showing the overexpressing vector for MdMYB5. (b) The phenotype of Arabidopsis ectopically expressing MdMYB5. (c) Transcriptional levels of MdMYB5 in transgenic Arabidopsis lines. (d) Lignin content in stems of the MdMYB5 overexpressing plants and wild-type. (e) Cellulose content in stems of the MdMYB5 overexpressing plants and wild-type. The error bars reveal the standard deviation (SD, n = 3). * shows notable differences between WT and the OE-MdMYB5 Arabidopsis lines (p < 0.05, based on t-test), ** = p < 0.01.
-
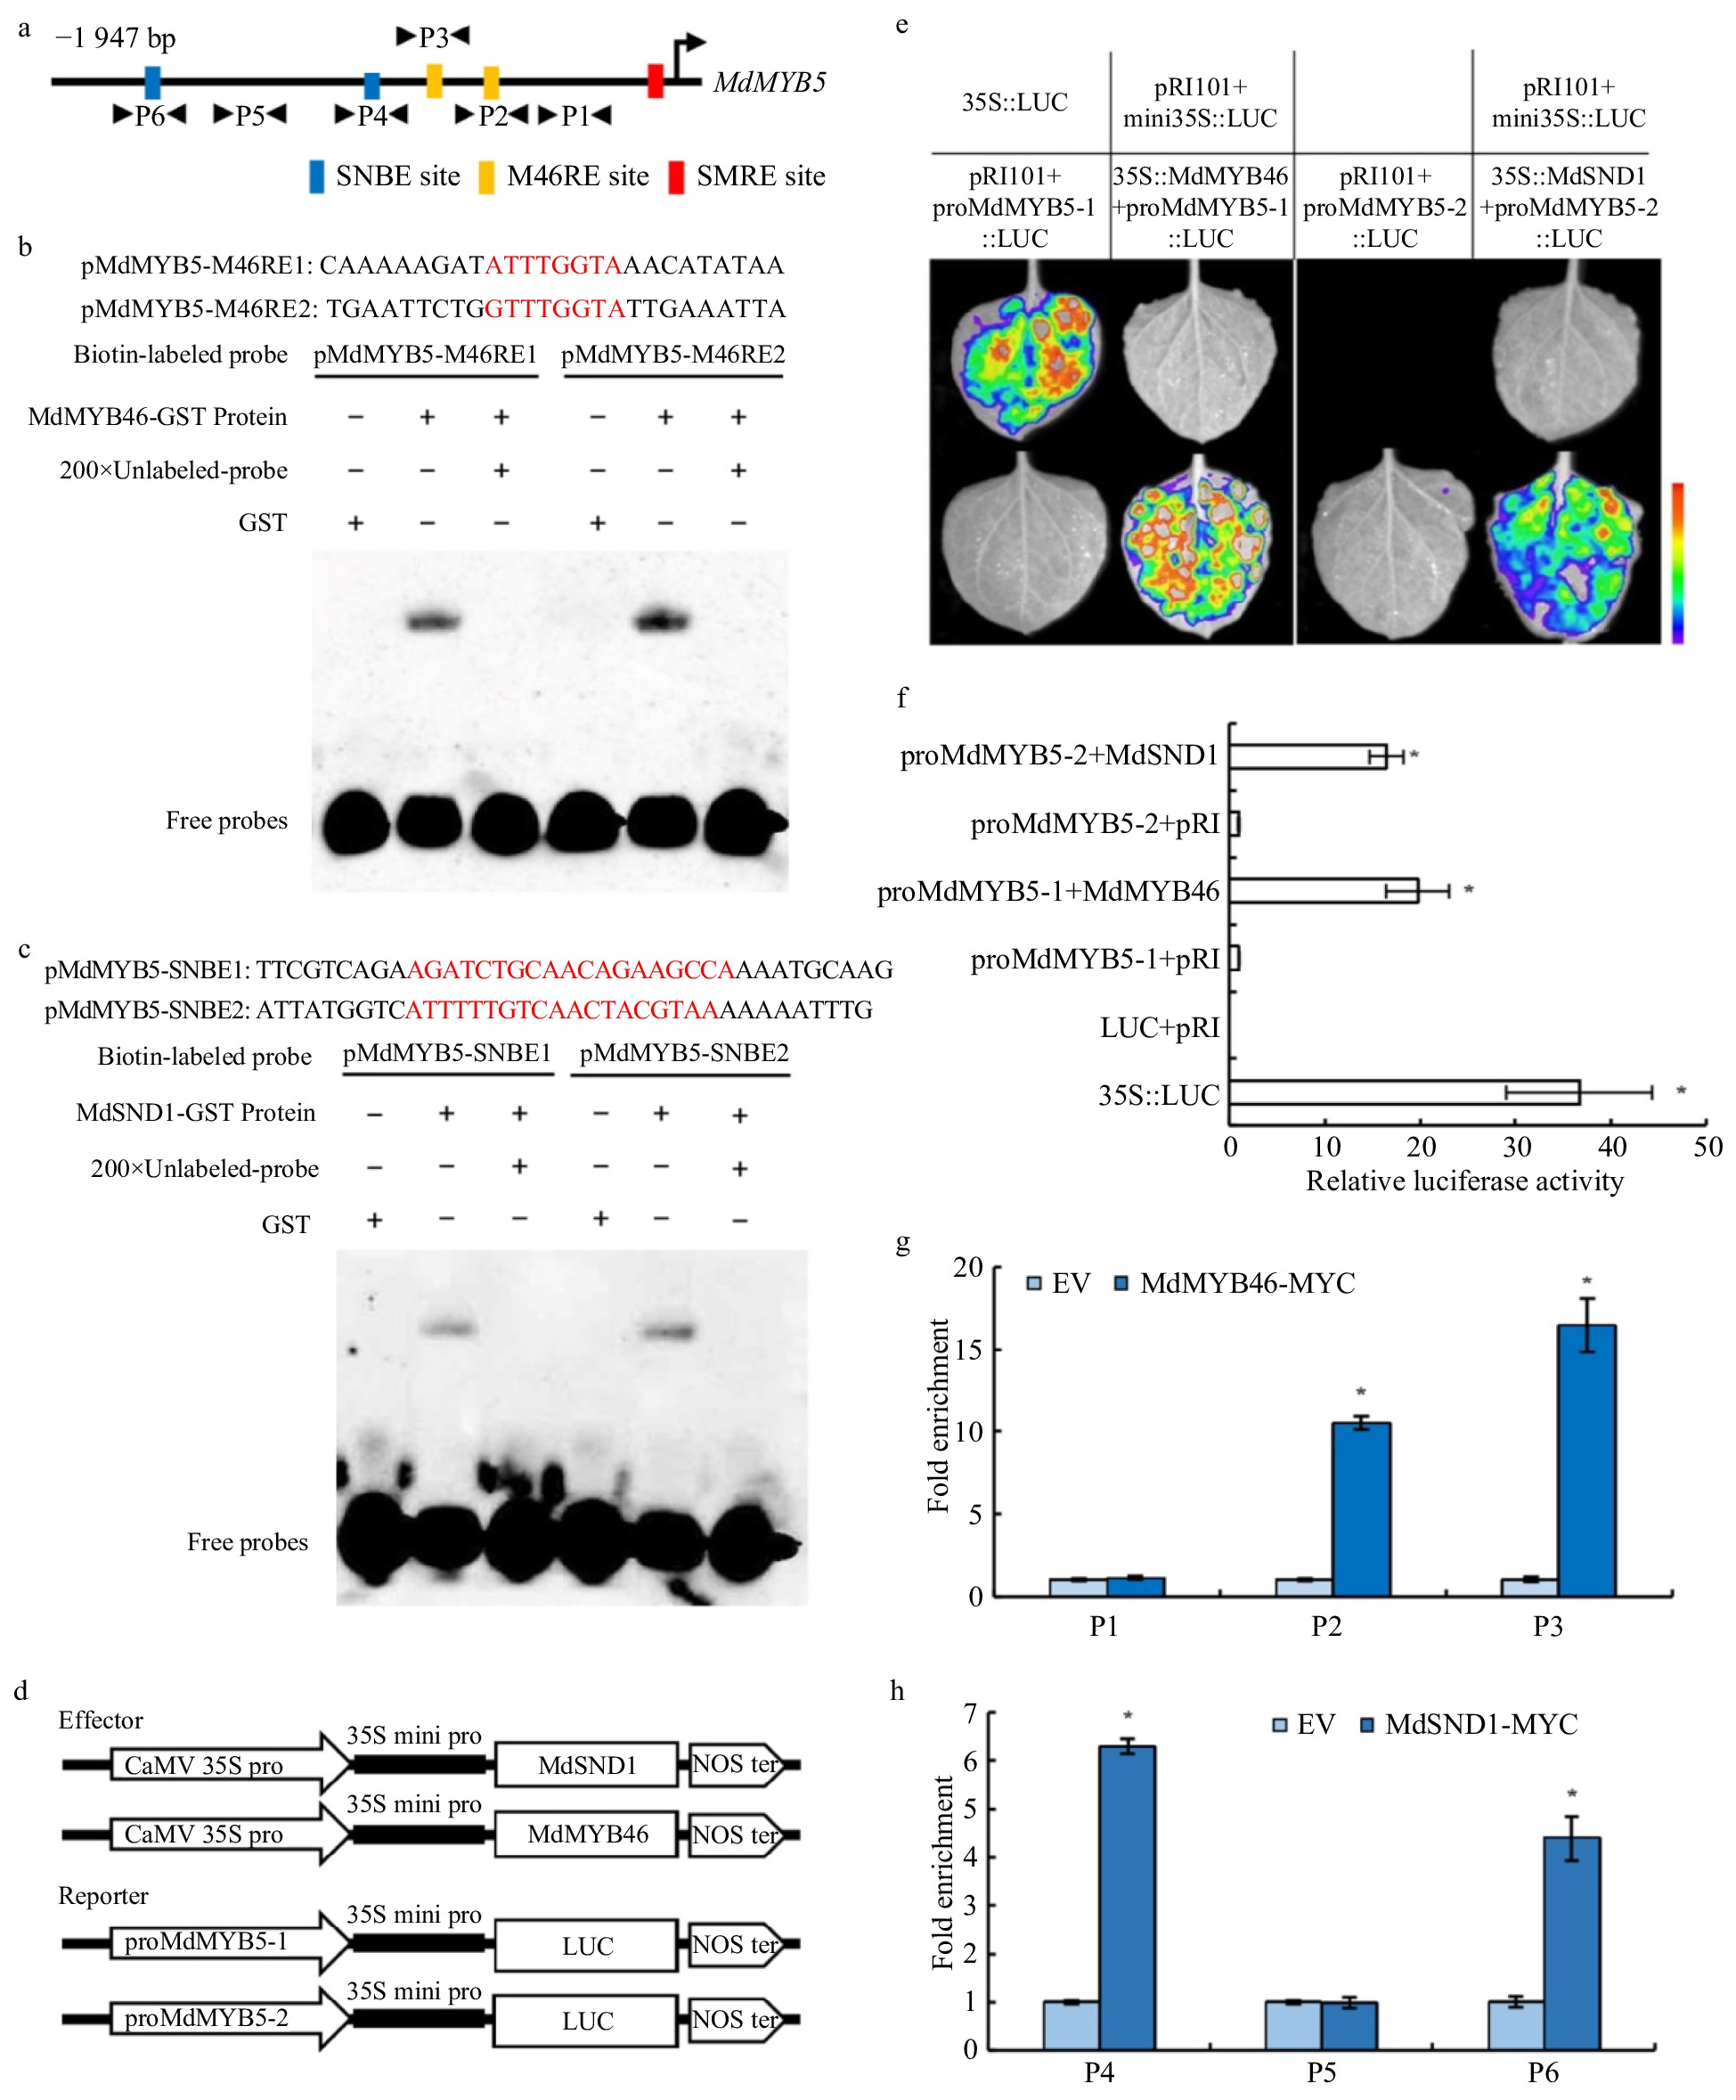
Figure 6. Identification of SNBE, SMRE/M46RE motifs in the promoter of MdMYB5 and the activation effect of MdMYB46 and MdSND1 on their transcription. (a) Schematic representation of MdMYB5 promoter showing the position of MdSND1 and MdMYB46 binding sites. (b) EMSA showing the binding characteristics of the MdMYB46 to M46RE fragments with unlabeled DNA probe (200-fold). Red represents the binding site sequence. (c) EMSA showing the binding characteristics of the MdSND1 to SNBE fragments with unlabeled DNA probe (200-fold). (d) Schematic diagrams of the effector and reporter plasmid structure in the tobacco transient expression assay. (e) Split-luciferase reporter signal showing the interaction between MdSND1, MdMYB46 and MdMYB5 promoter fragments in Nicotiana benthamiana leaves. (f) The comparison of luciferase activity between MdSND1, MdMYB46 and MdMYB5 promoter fragments in Nicotiana benthamiana leaves. (g) and (h) ChIP-qPCR assay of MdSND1 and MdMYB46 binding to the promoter of MdMYB5, respectively. P1 to P6 indicate the fragment of MdMYB5 promoter shown in (a). * Indicates significant difference (p < 0.05, based on t-test). The error bars indicate the standard deviation (SD, n = 3), EV = empty vector.
Figures
(6)
Tables
(0)