-
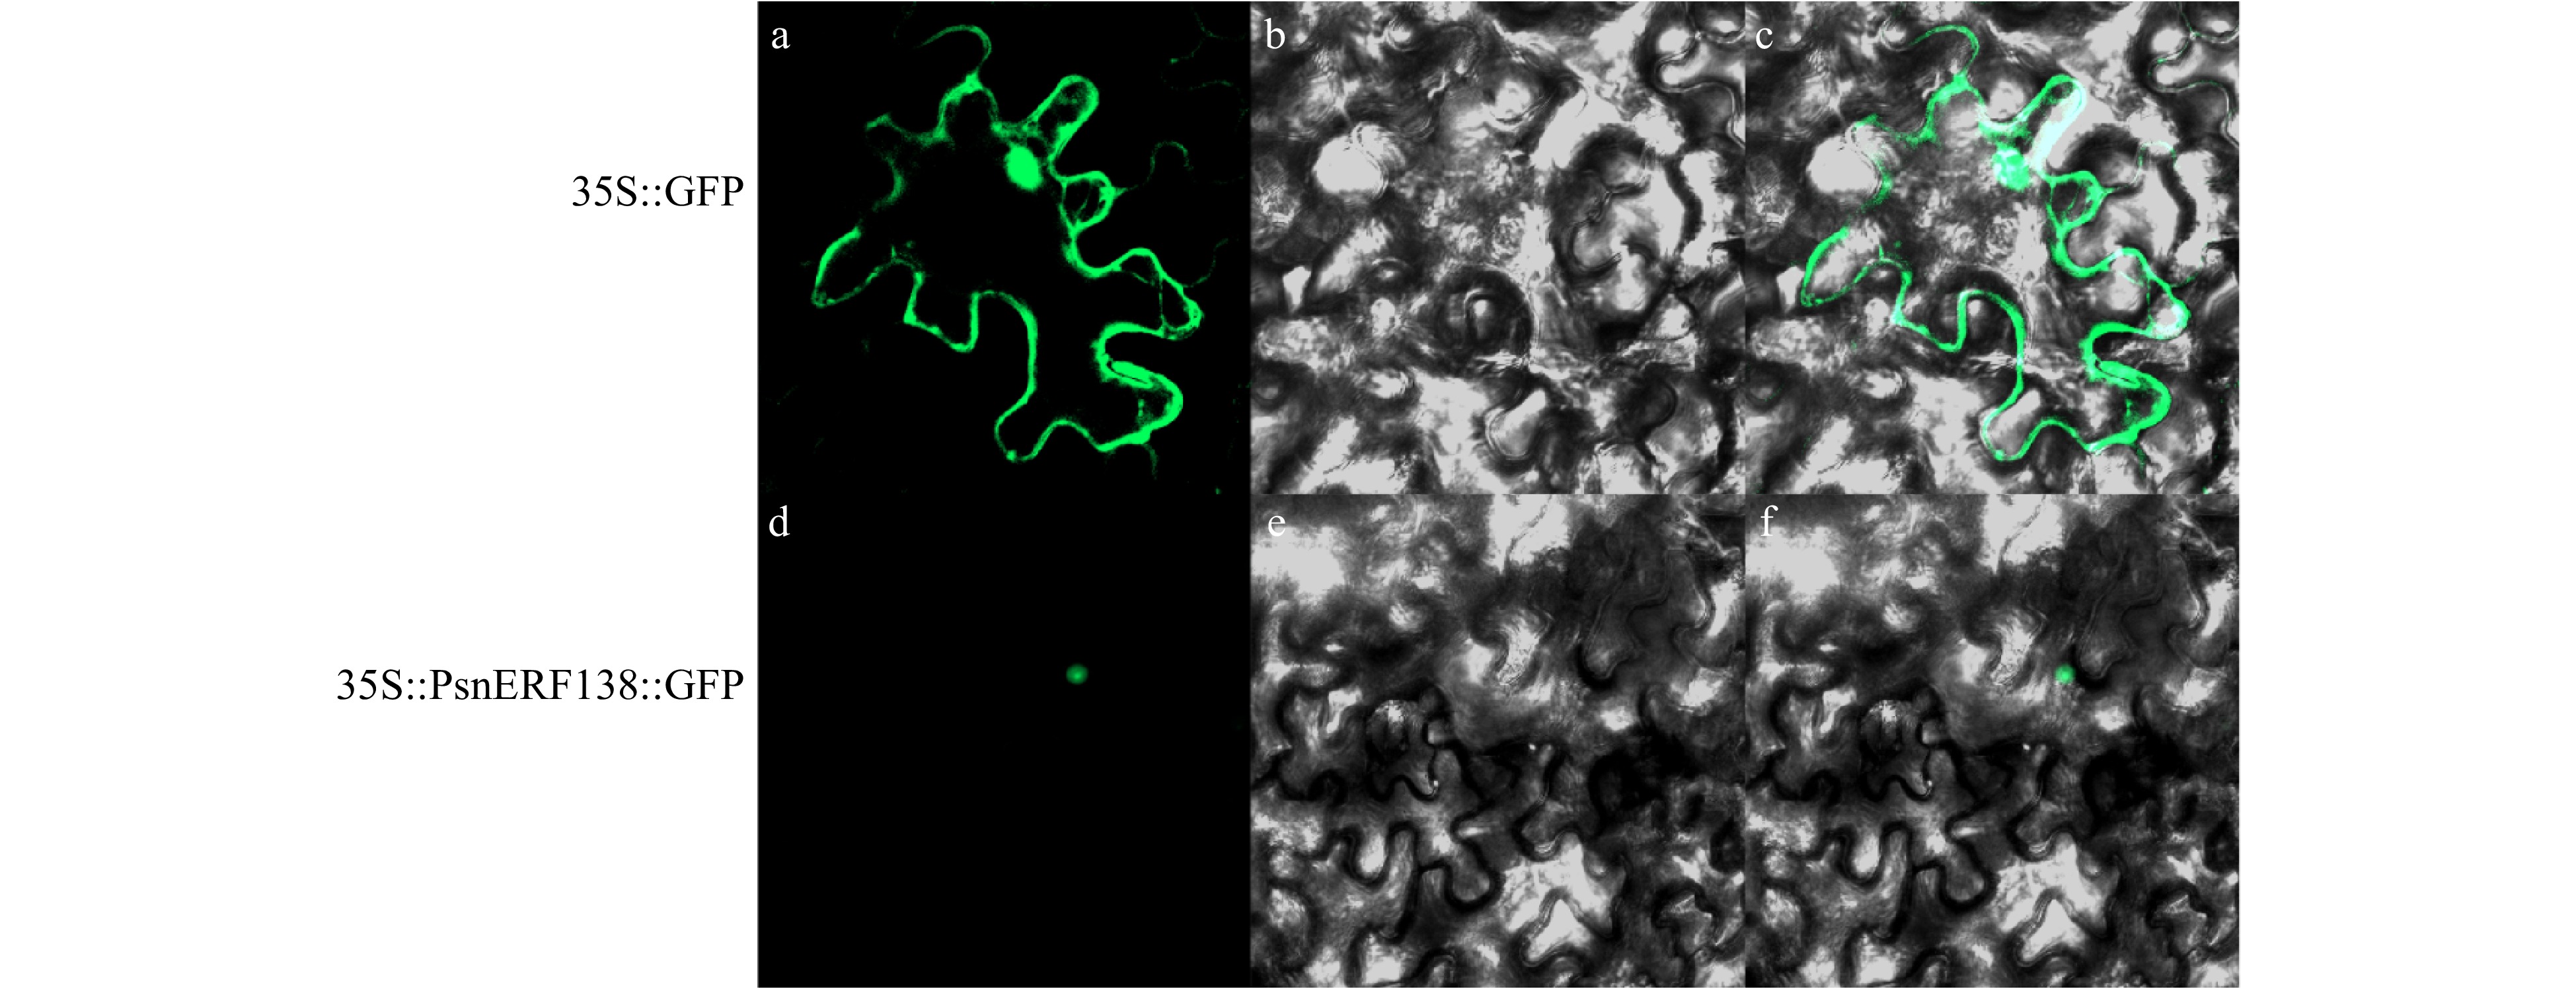
Figure 1. Localization of PsnERF138 in the nucleus. 35S::GFP (a−c) and 35S::PsnERF138::GFP (d−f) were injected into tobacco epidermal cells. (a) and (d) showed green fluorescence in dark field; (b) and (e) were observed in the bright field; (c) and (f) were the mixed observation of light and dark fields.
-
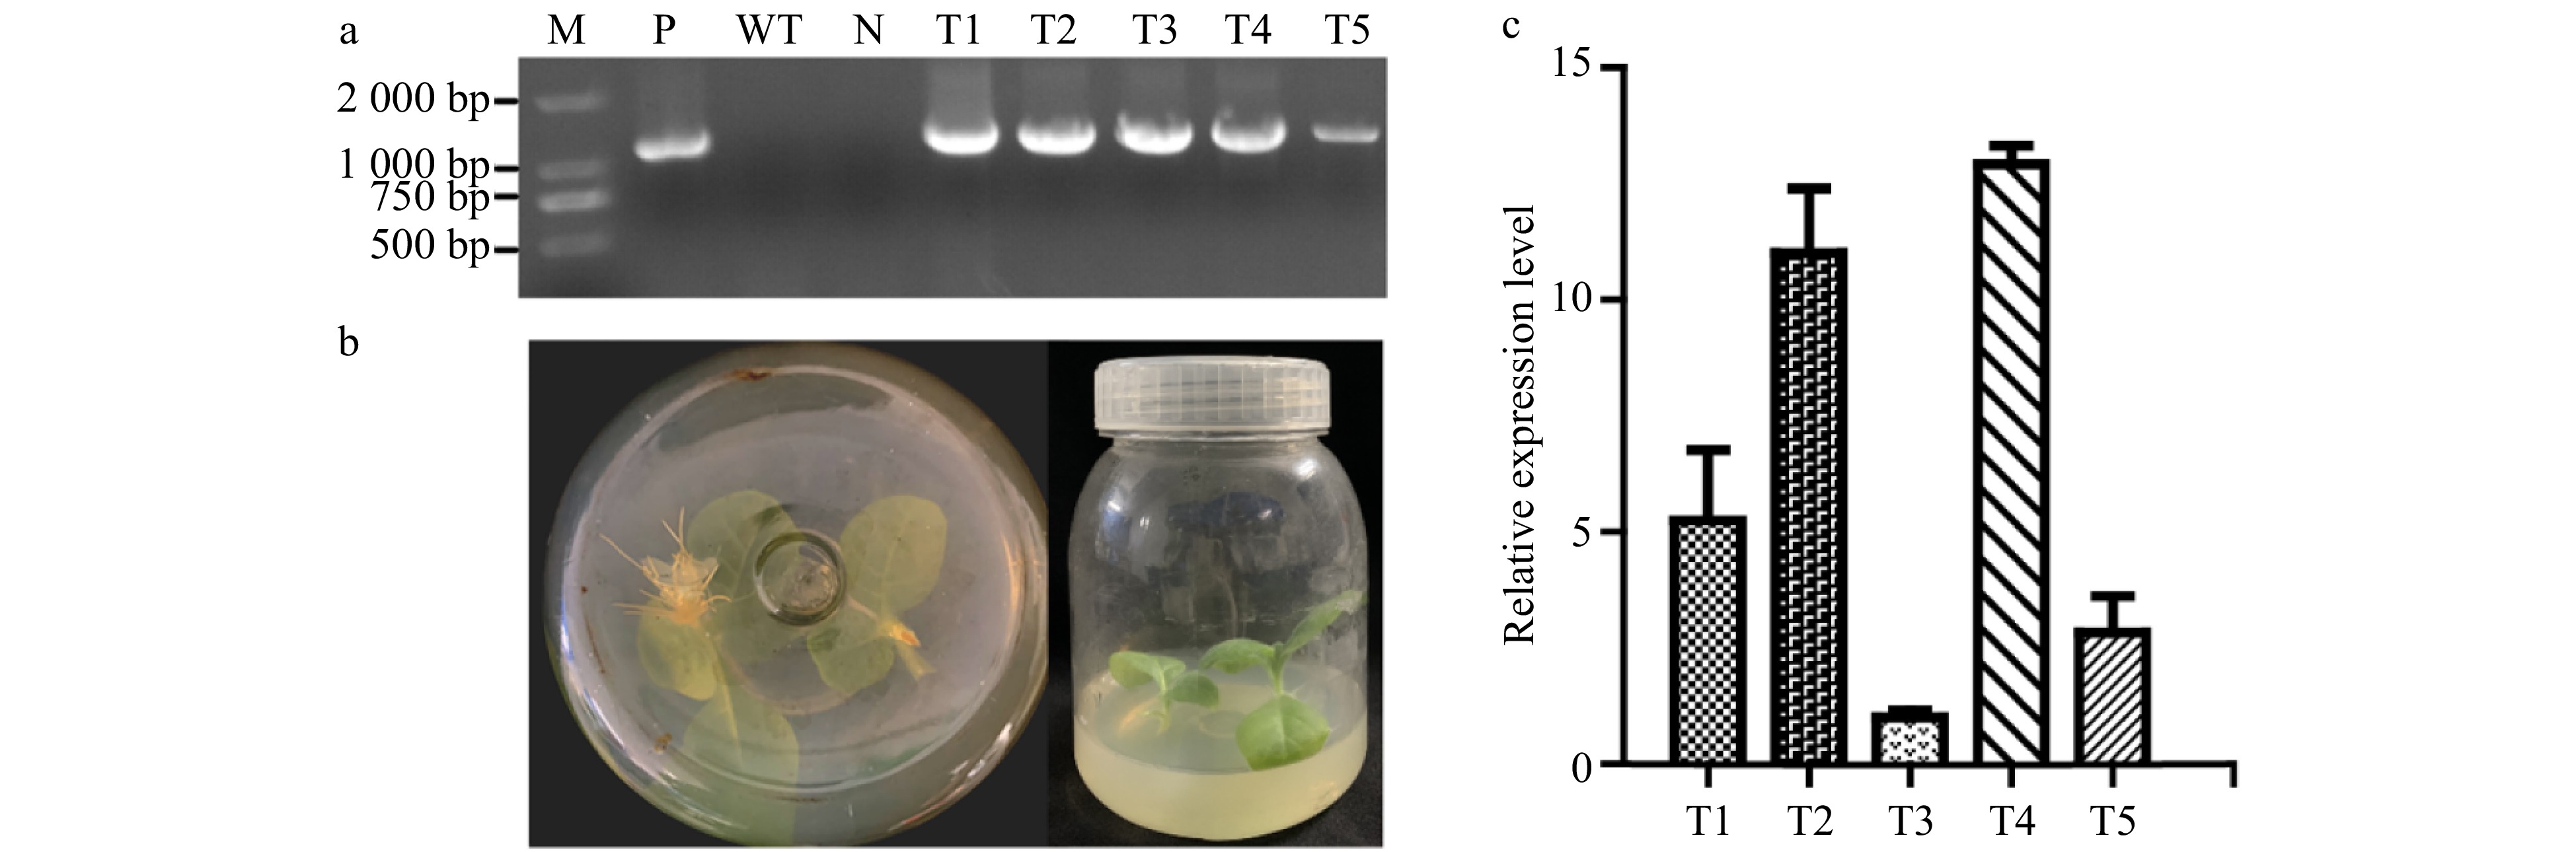
Figure 2. Identification of genetically transgenic tobacco. (a) PCR detection of the transgenic lines; M, 2000 DNA maker; P, positive control with recombined vector as the template; N, negative control using water as a template; WT, wildtype tobacco; T1−T5, transgenic tobacco lines. (b) Transgenic lines could be rooted in rooting medium containing 100 mg/ml kanamycin. Wildtype tobaccois on the bottom and grew well. (c) Expression of PsnERF138 in five transgenic lines and wildtype tobacco. Each error bar represents the standard deviation of three independent replicates.
-
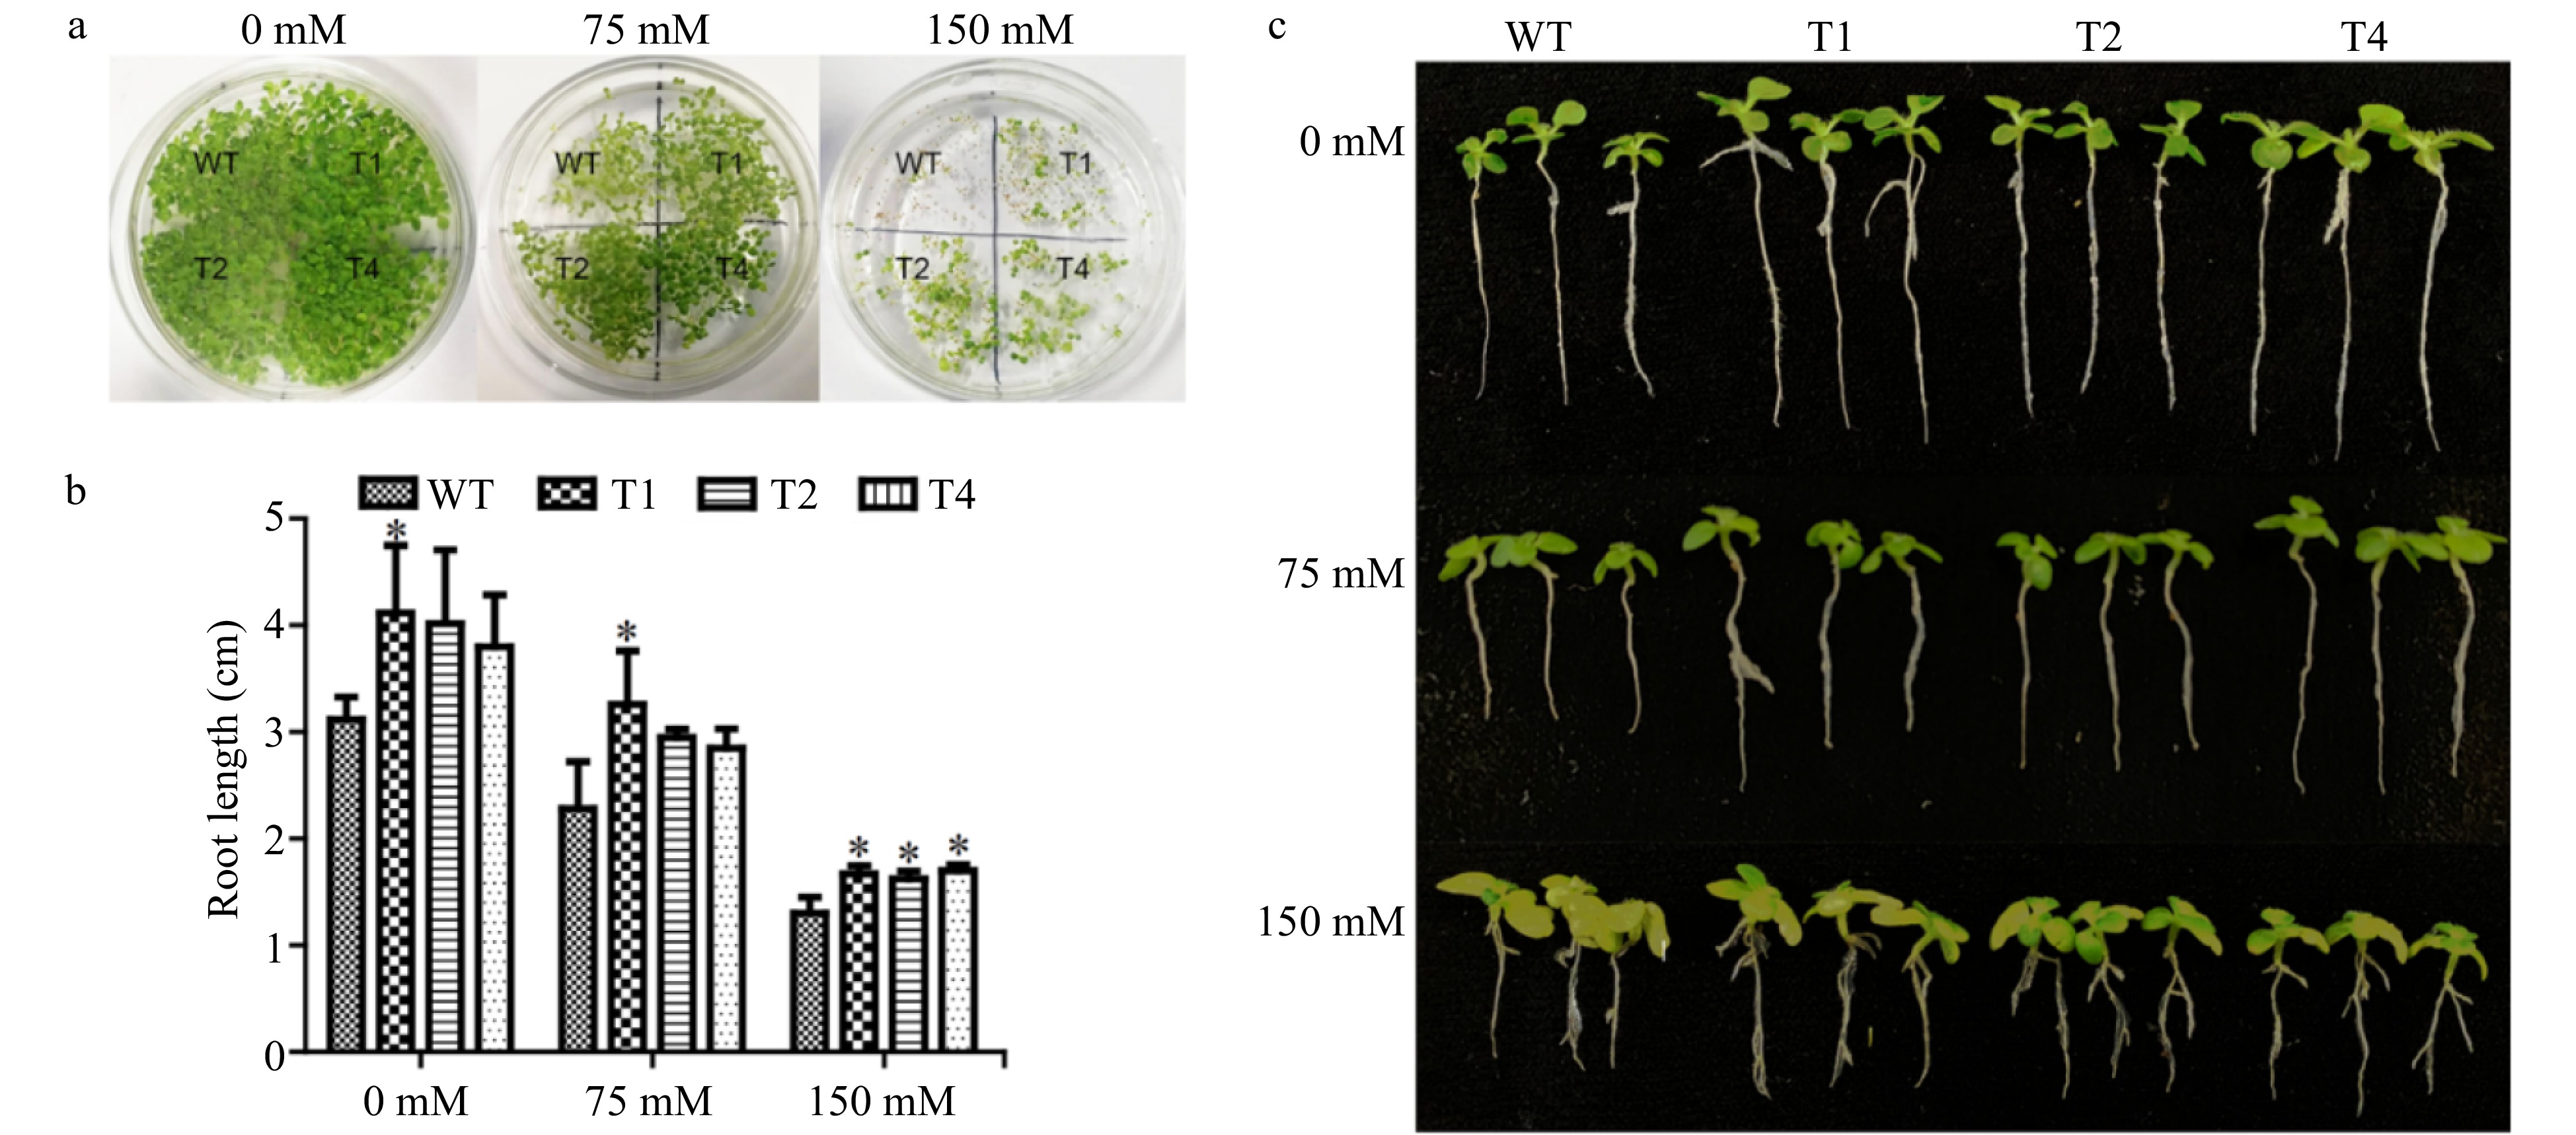
Figure 3. Germination and growth of transgenic tobacco and WT tobacco and their phenotypes under salt stress. (a) Germination and growth of transgenic tobacco and WT tobacco, T1, T2 and T4 transgenic tobacco lines. (b) Seedlings moved to 0, 75 and 150 mM NaCl to record root length data. (c) Phenotype of transgenic and WT tobacco seedlings under salt stress. Each error bar represents the standard deviation of three independent replicates, and each asterisk indicates that there was a significant difference between a transgenic line and wild type as tested with Analysis of Variance (ANOVA) with p < 0.05.
-
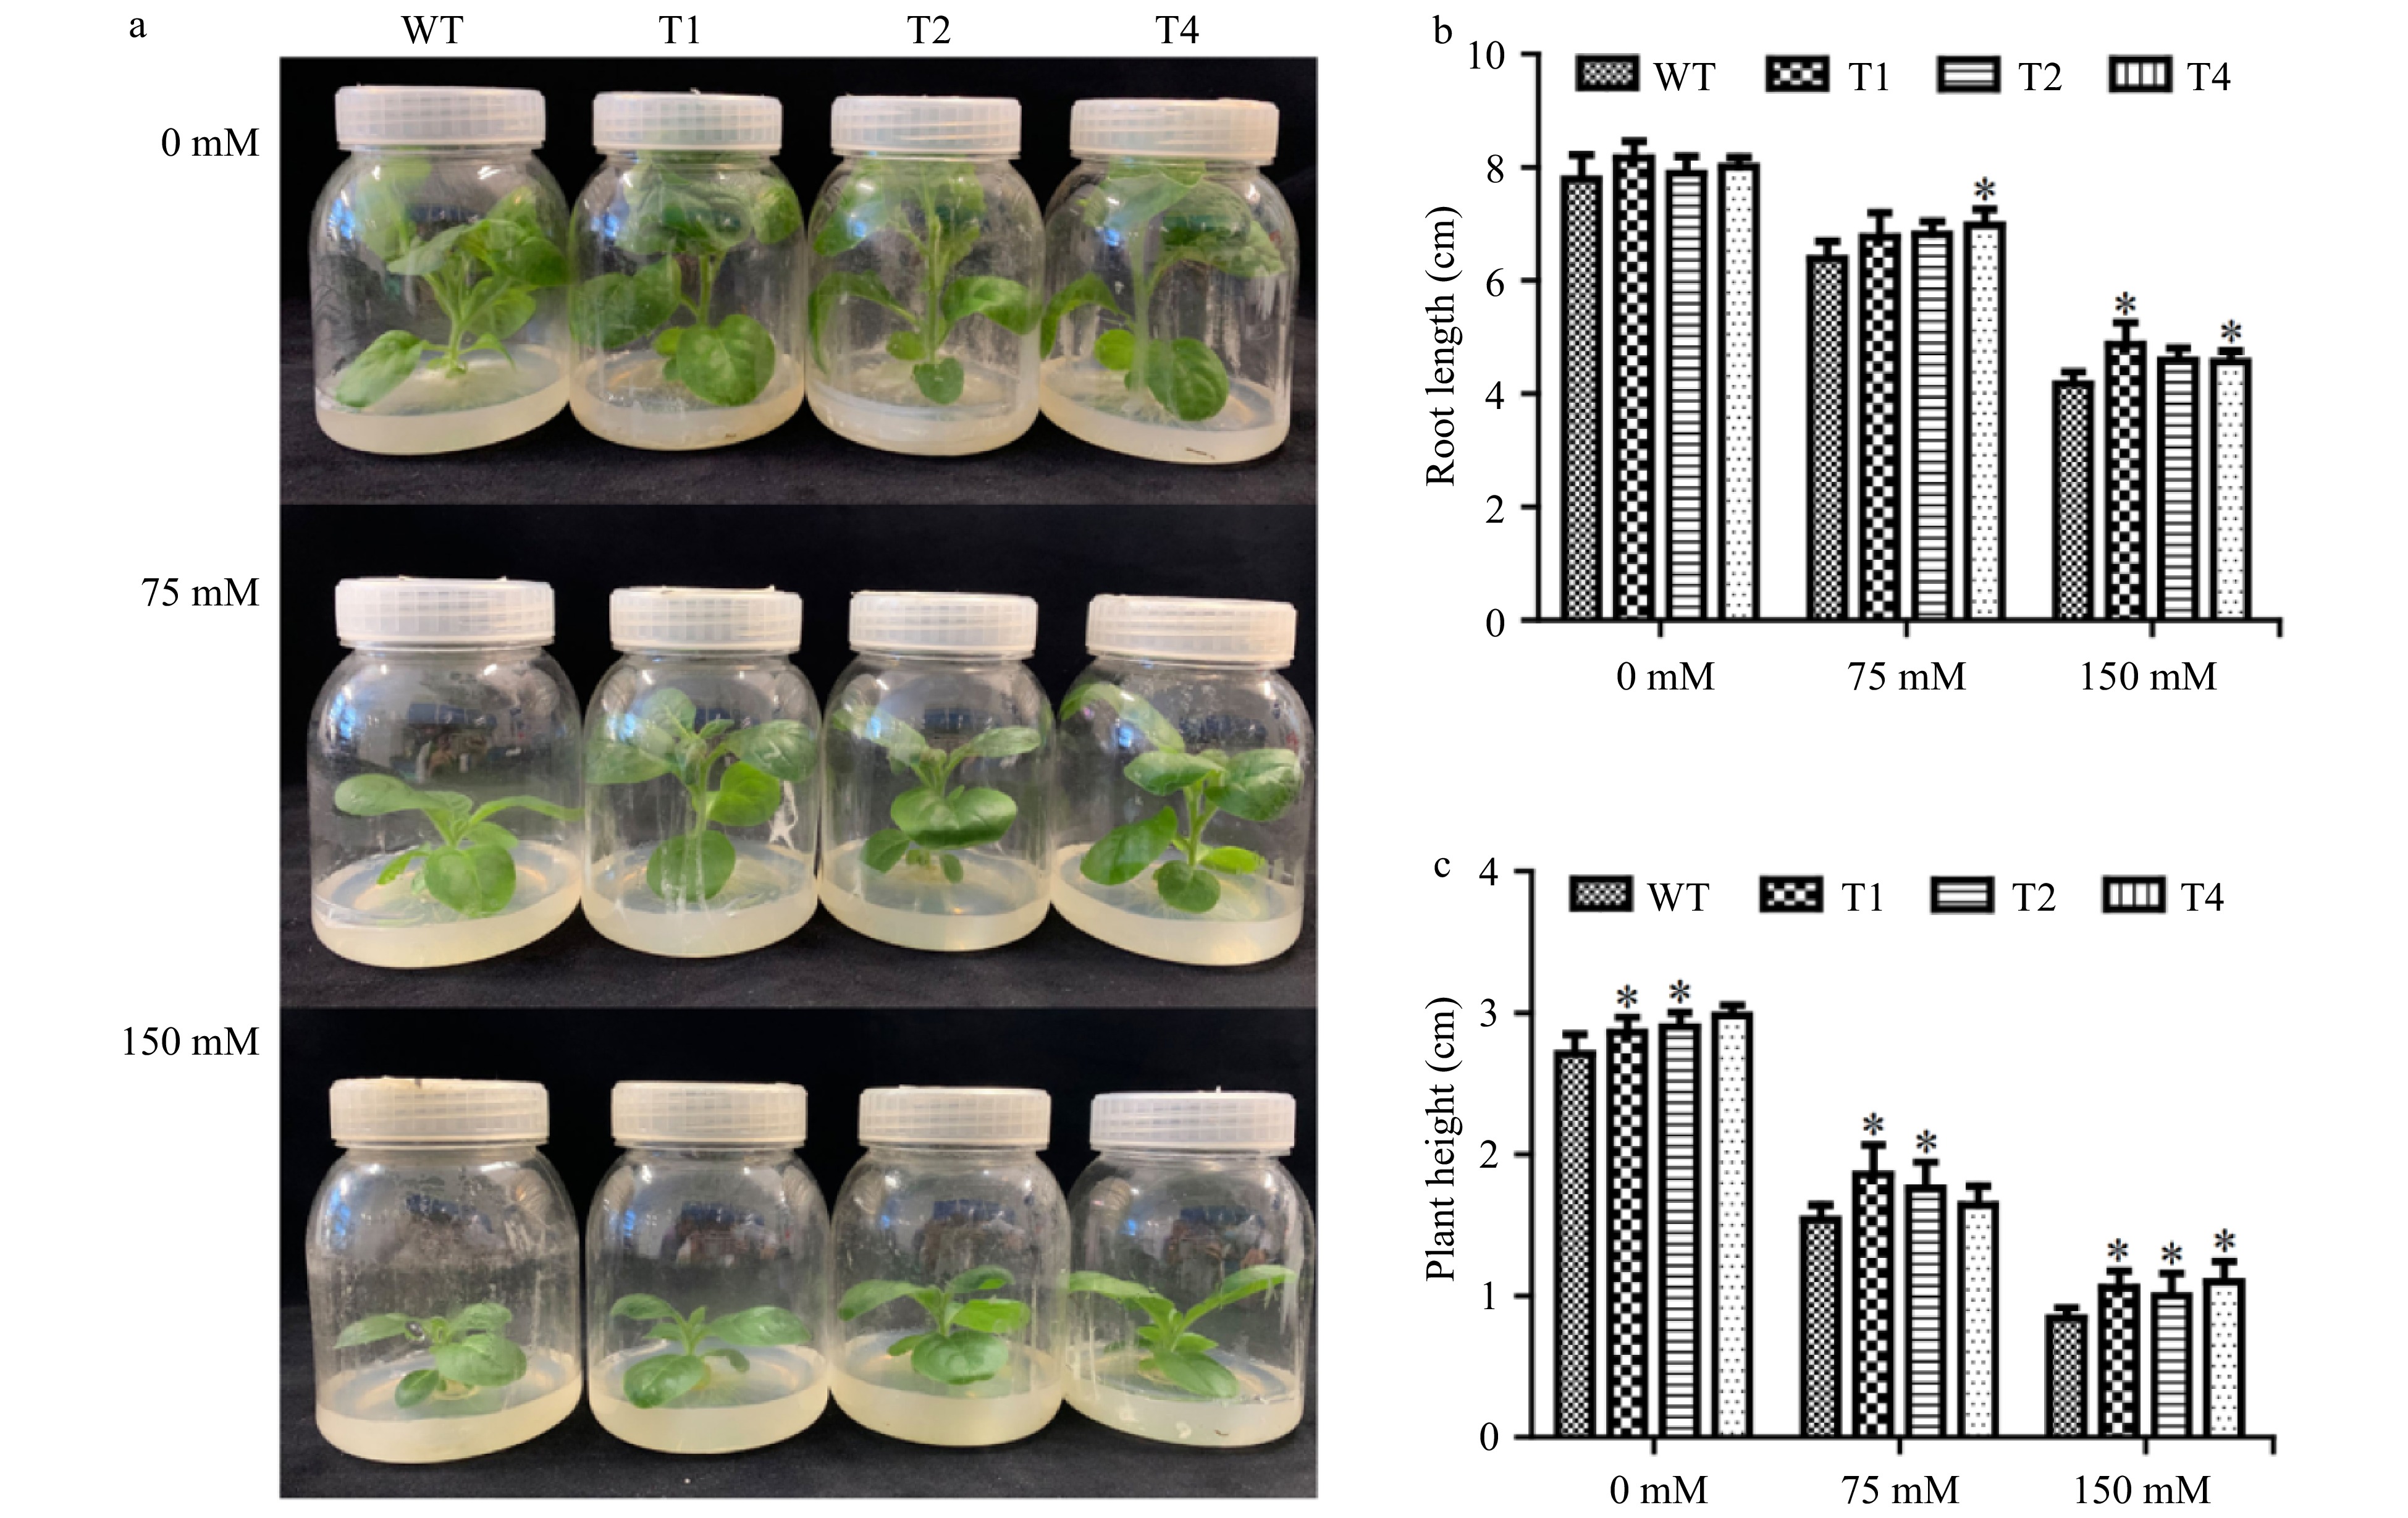
Figure 4. Growth of transgenic tobacco under salt stress. (a) Comparison of growth of WT and transgenic lines under 0, 75, 150 mM NACL salt stress. (b) Plant heights of WT and transgenic lines. (c) Root lengths of WT and transgenic lines. Each error bar represents the standard deviation of three independent replicates, and each asterisk indicates that there was a significant difference between a transgenic line and wild type as tested with Analysis of Variance (ANOVA) with p < 0.05.
-
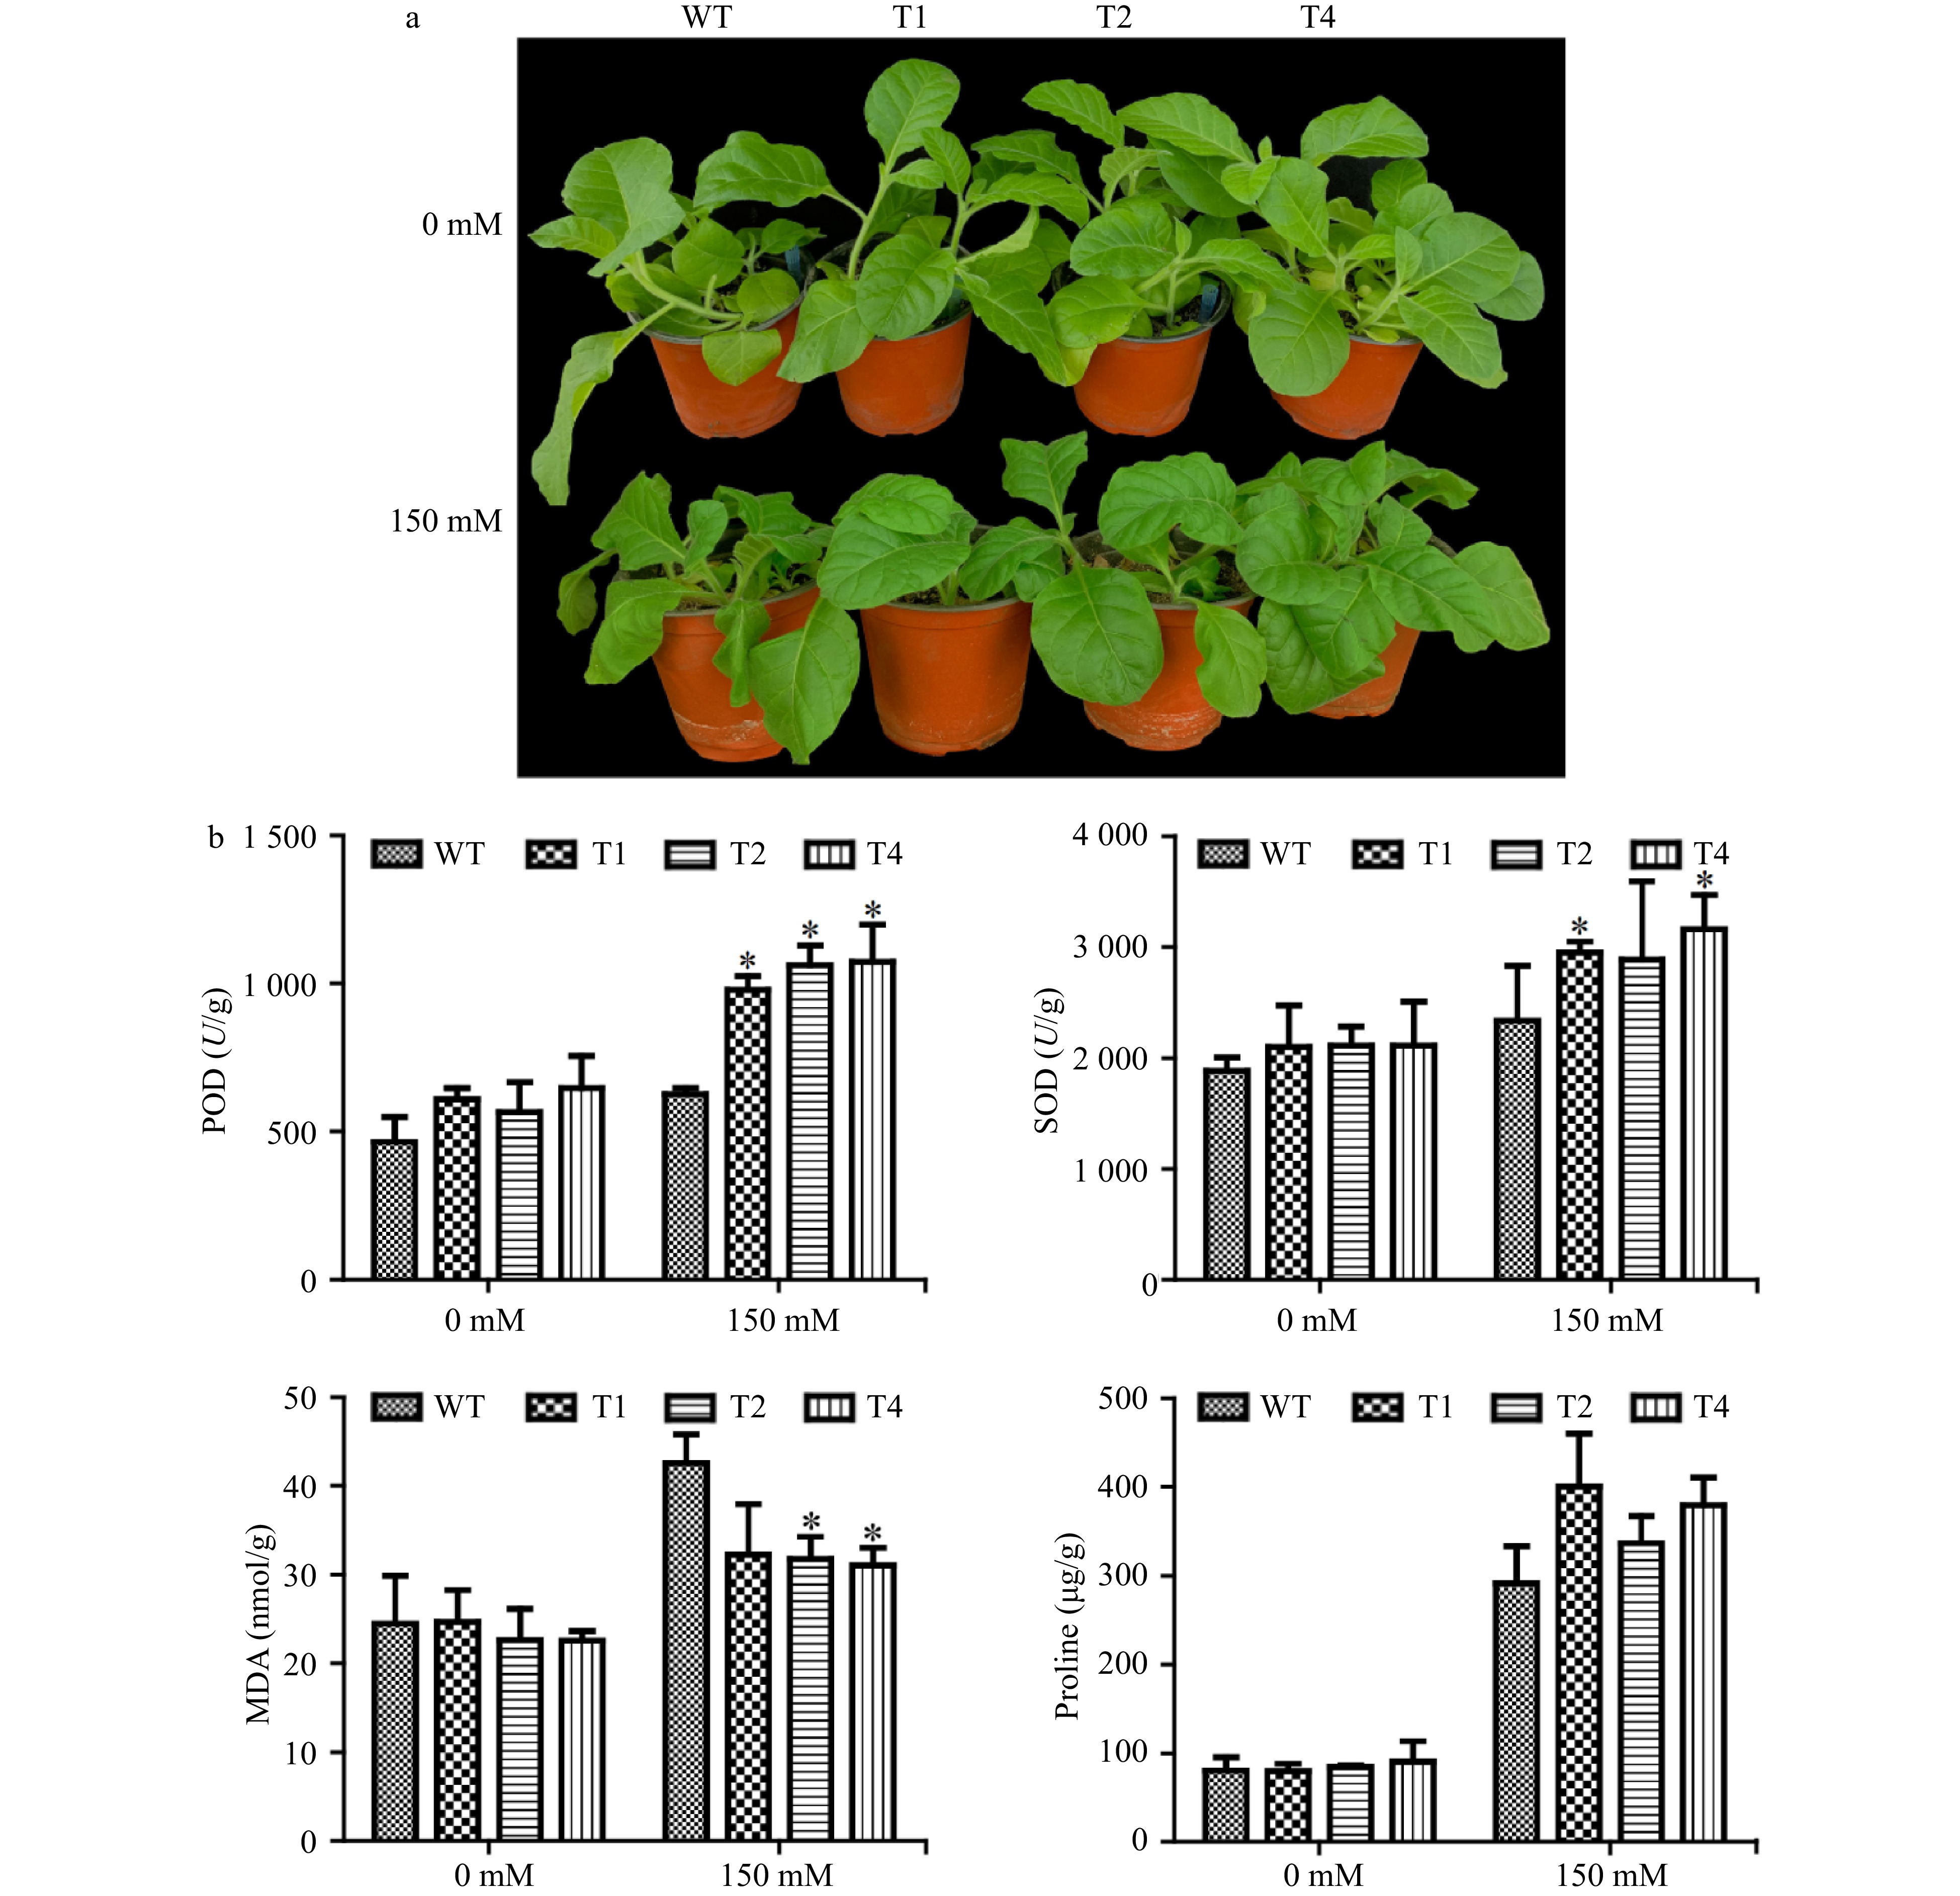
Figure 5. Physiological analyses of WT and transgenic tobacco. (a) Growth comparison of transgenic tobacco and WT in soil under salt stress. (b) The physiological parameters include superoxide dismutase (SOD) activity, peroxidase (POD) activity, malondialdehyde (MDA) and proline content. The transgenic lines and wild type were compared under 0 and 150 mM NaCl conditions respectively. Each error bar represents the standard deviation of three independent replicates, and each asterisk indicates that there was a significant difference between a transgenic line and wild type as tested with Analysis of Variance (ANOVA) with p < 0.05.
-
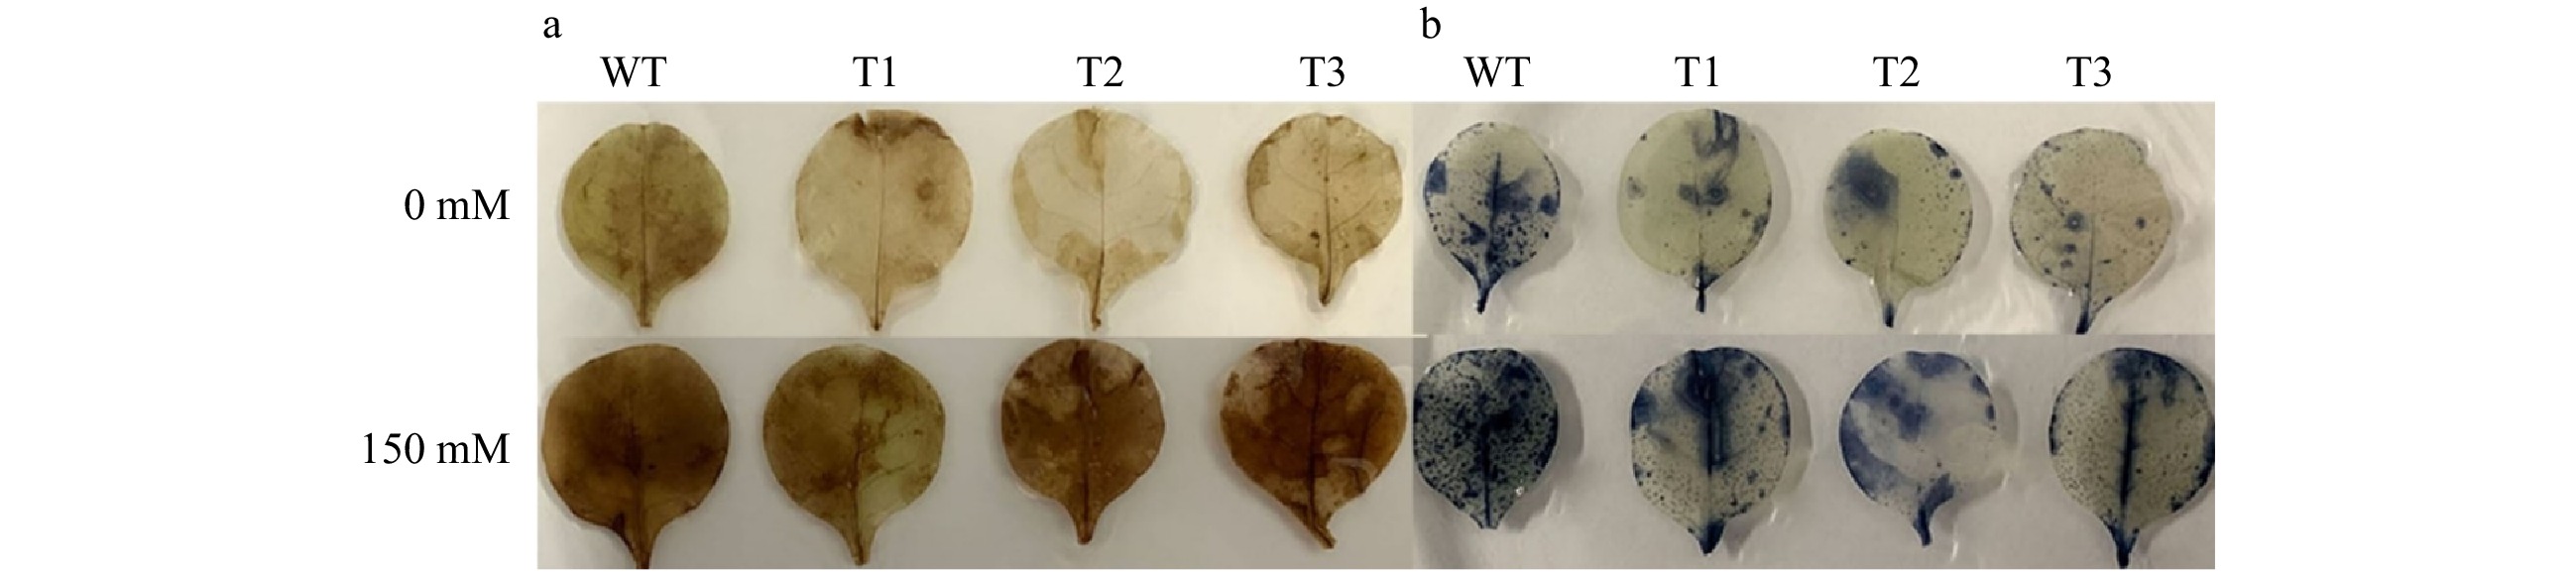
Figure 6. (a) Histochemical staining with 3, 3’-diaminobenzidine (DAB). (b) Histochemical staining with nitrotetrazolium blue chloride (NBT).
Figures
(6)
Tables
(0)