-
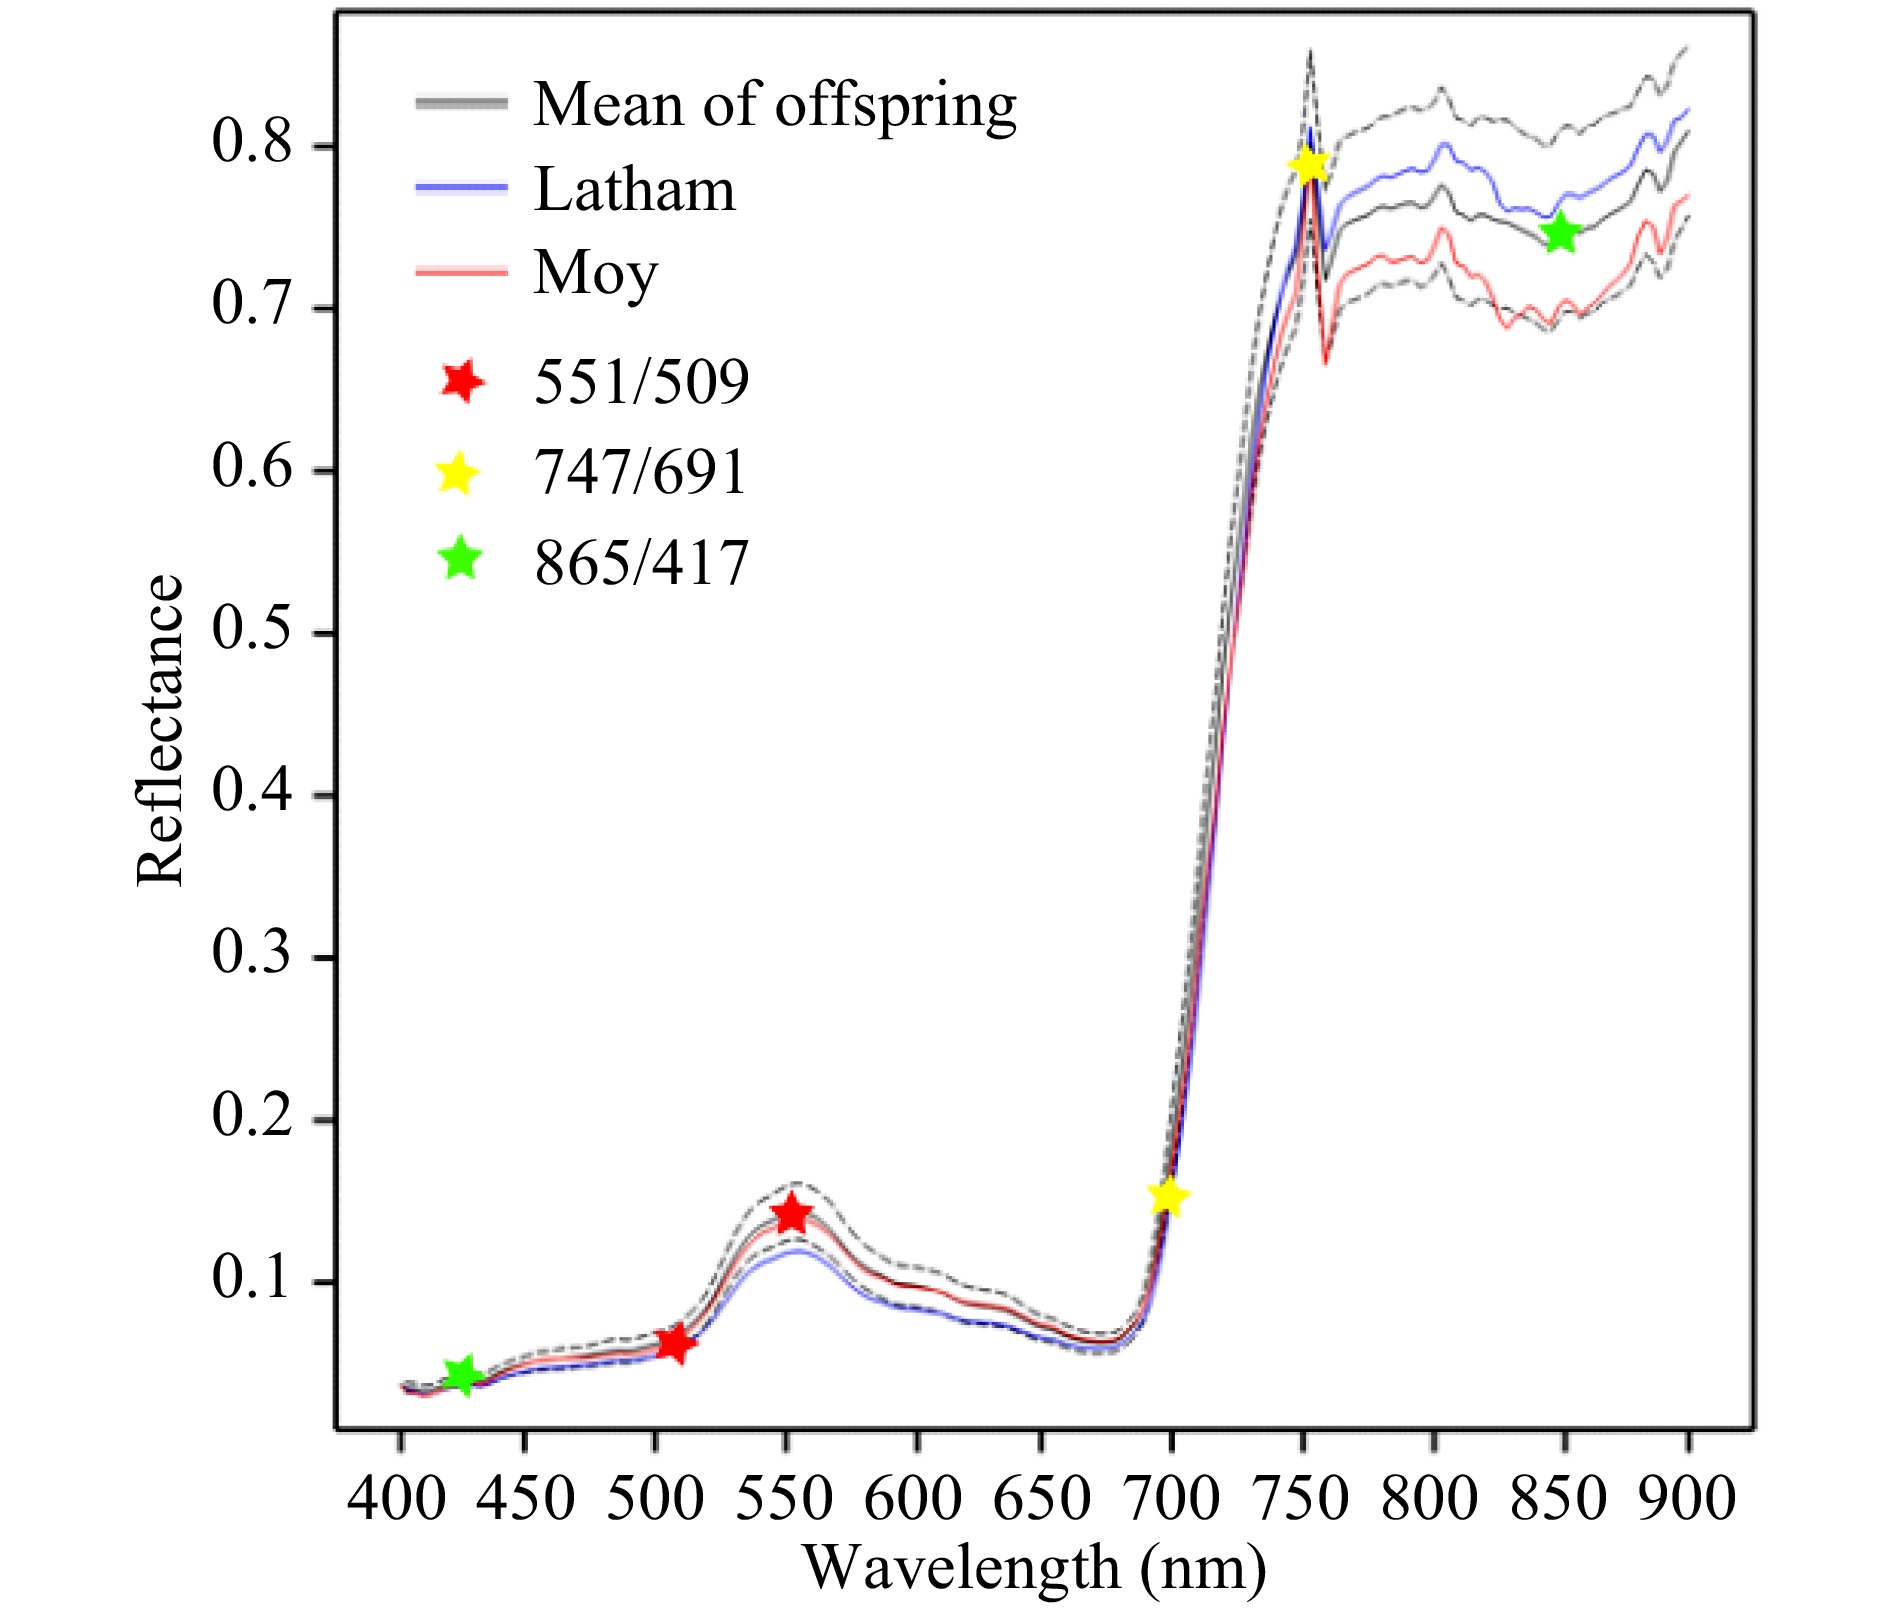
Figure 1. Mean reflectance profiles for leaf material of parents and offspring in August 2016. The dotted lines show the upper and lower quartiles for the offspring. Six wavelengths used to derive three selected wavelength ratios are marked with stars for illustration.
-
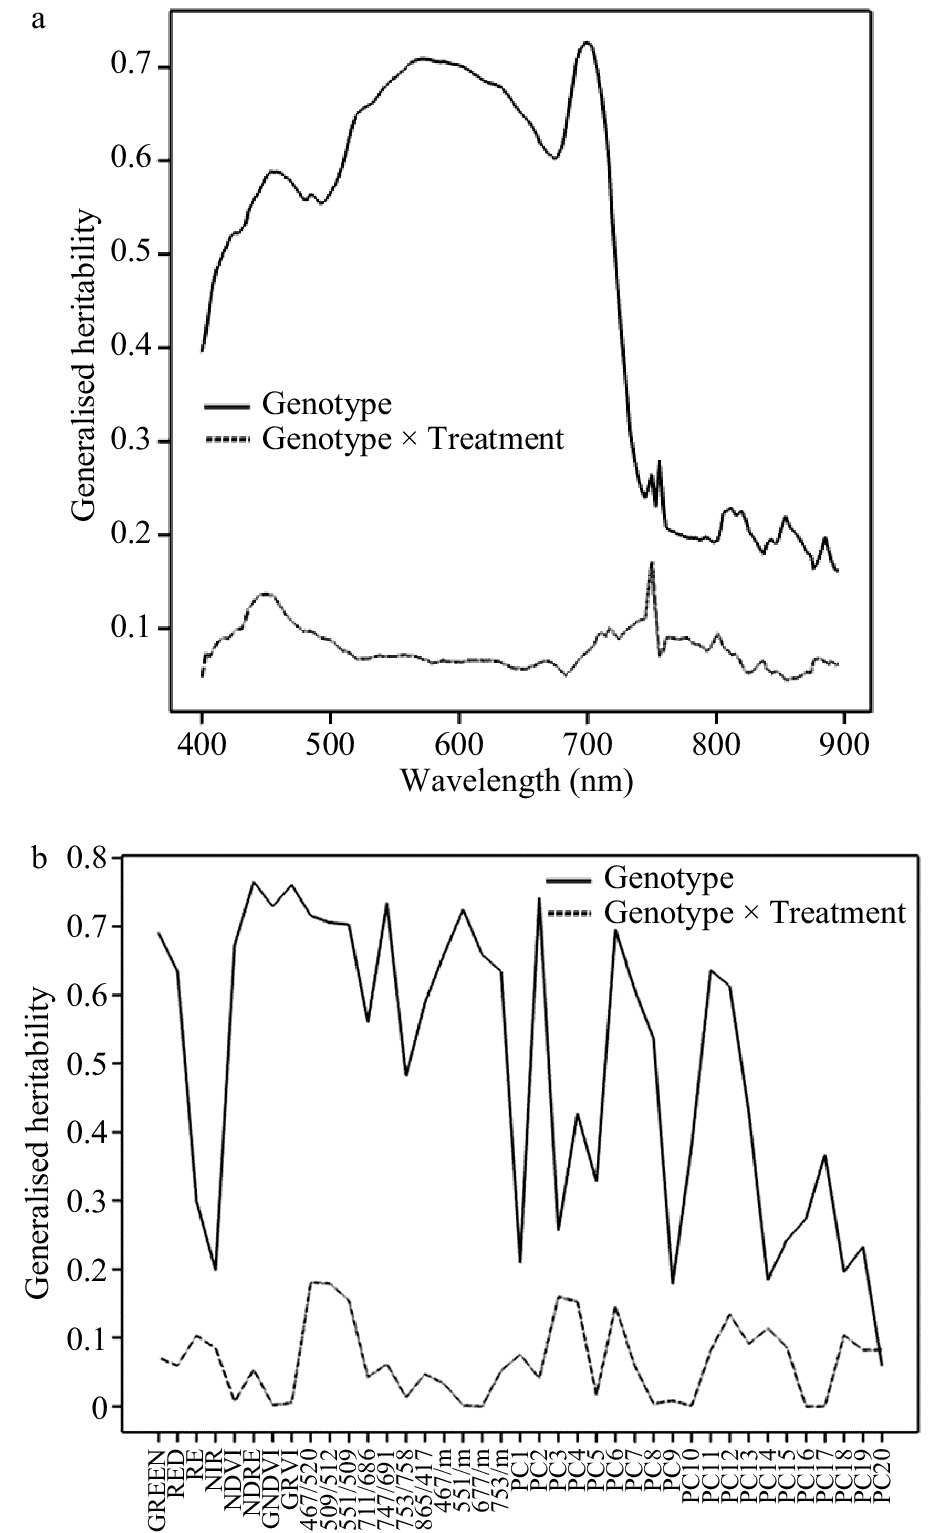
Figure 2. Generalised heritability of spectral data collected in August 2016. (a) Heritability of individual wavelengths. (b) Heritability of Sequoia traits, wavelength ratios and principal component scores.
-
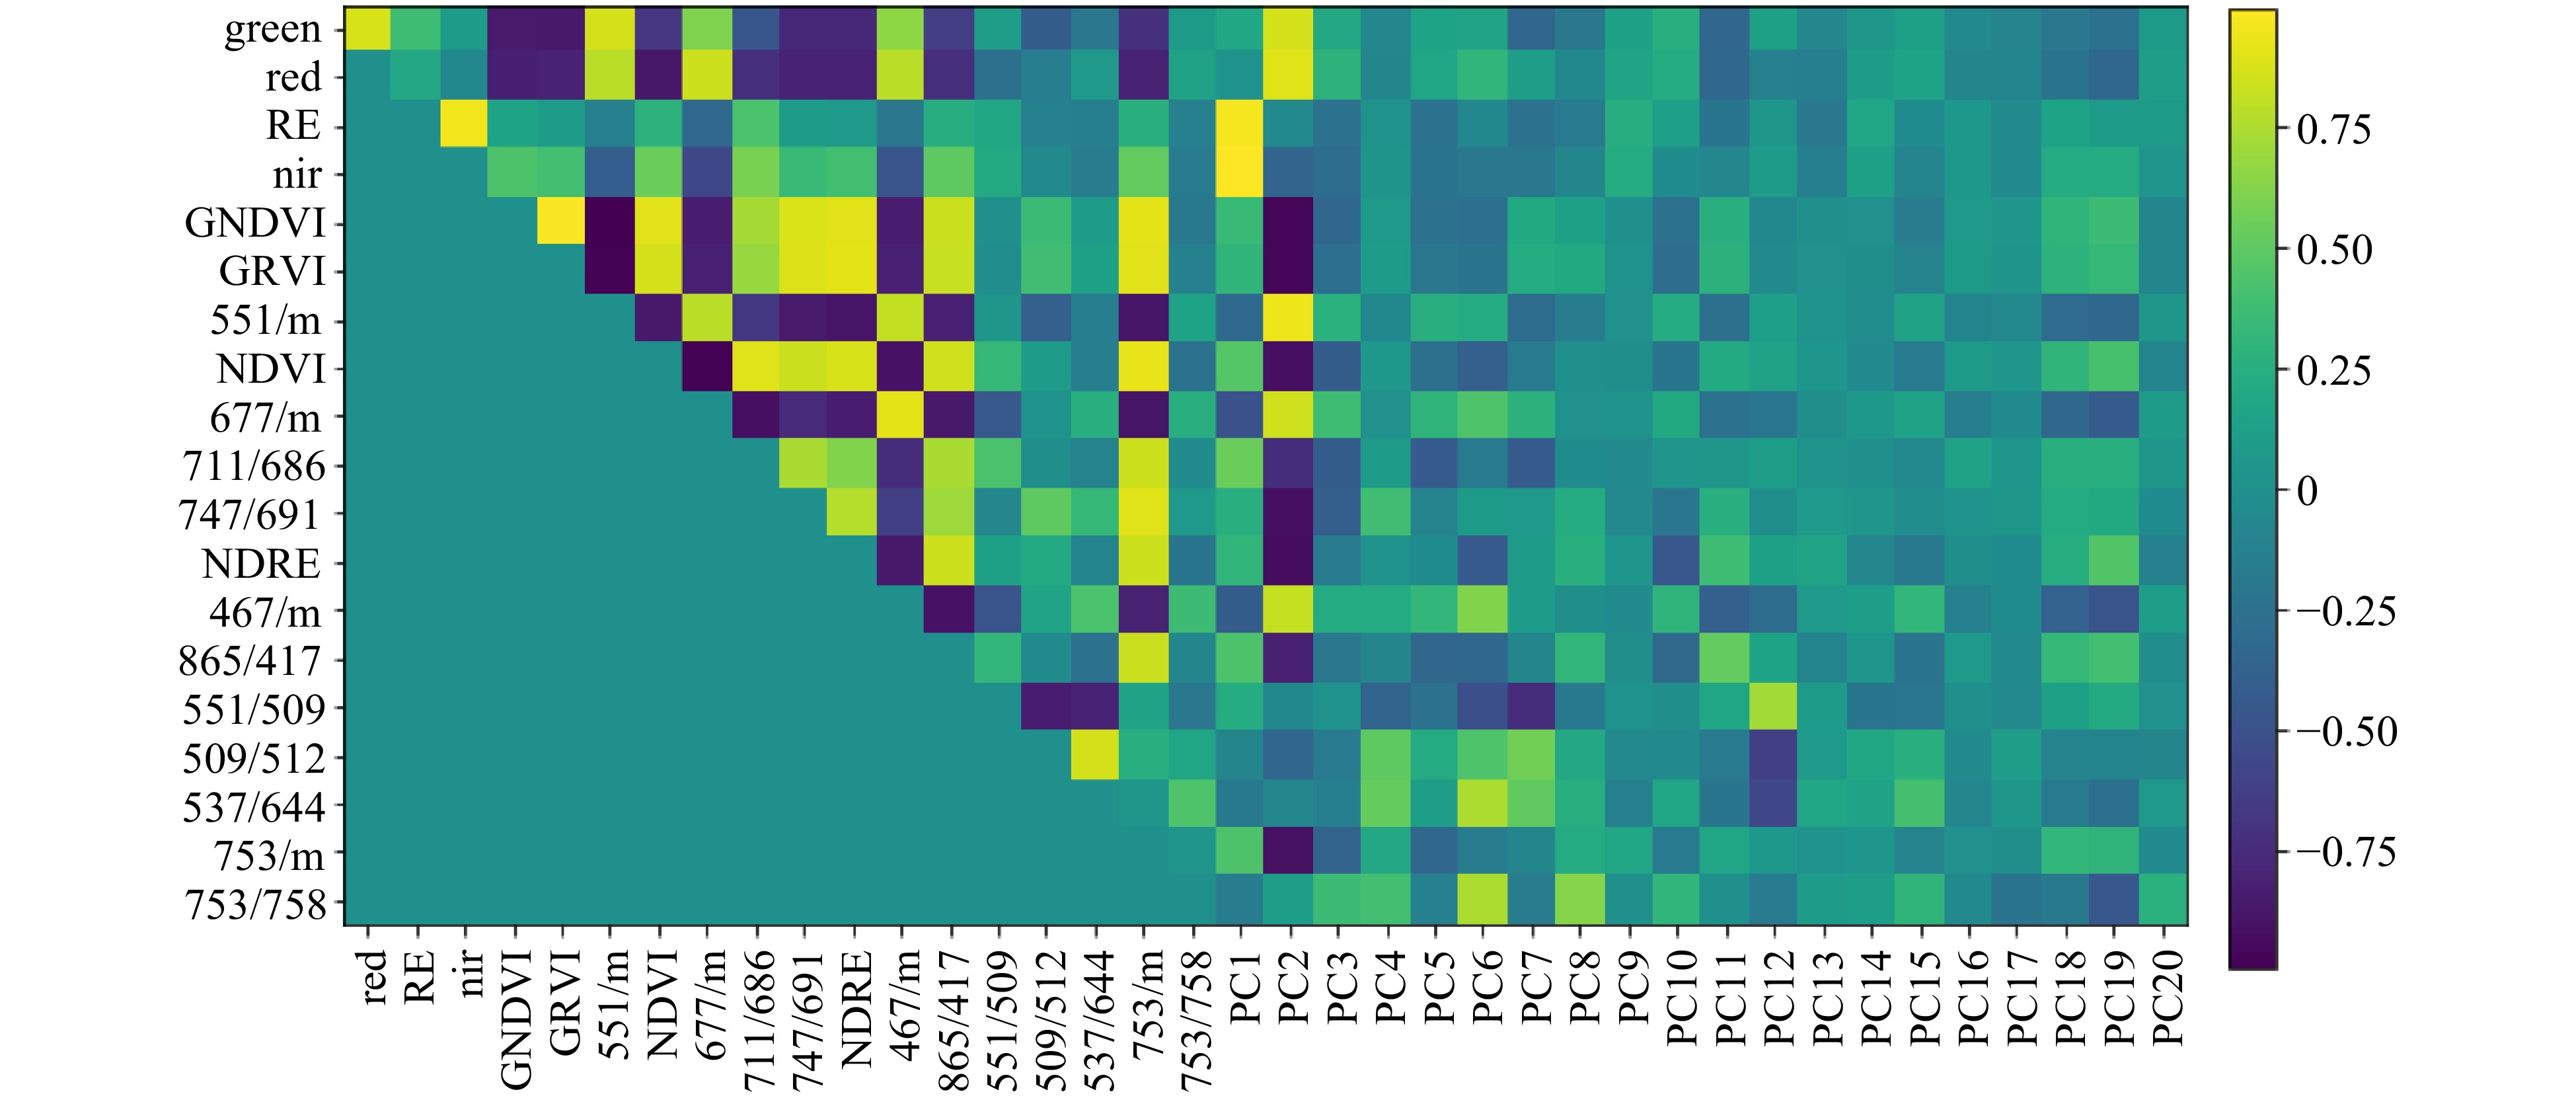
Figure 3. Plot showing correlation between reflectance values for selected wavelength ratios, Sequoia ratios and principal component scores derived from individual wavelength data. Ratios are grouped on the axes according to their relatedness to each other. Dark blue indicates strong negative correlation and bright yellow indicates strong positive correlation. Data were collected in August 2016.
-
Trait Latham mean Moy mean Generalised heritability for genotype Generalised heritability for genotype × treatment Correlated spectral traits* Height 4.29 3.16 0.75 0.09 PC6 (−0.763)
467/m (−0.659)
NDRE (0.586)
NDVI (0.512)
453 nm (−0.570)Density 3.48 2.62 0.67 0.09 PC2 (−0.761)
467/m (−0.788)
NDRE (0.789)
NDVI (0.744)
464 nm (−0.771)
663 nm (−0.776)Diameter 3.29 2.96 0.60 0.12 PC2 (−0.586)
467/m (−0.660)
NDRE (0.627)
NDVI (0.587)
453 nm (−0.657)* m is the mean spectrum reflectance intensity for the plant across all wavelengths. Table 1. Summary statistics for the physical traits in 2016 (taken from images) and correlated spectral traits.
-
Month Trait Latham mean Moy mean Generalised heritability for genotype Generalised heritability for
G × TCorrelations with spectral traits from same date NDVI NDRE 467/m 753/m Best PC May Height 2.44 2.28 0.625 0.074 0.260 0.448 −0.399 0.520 PC3: −0.723 Density 3.77 3.20 0.626 0.099 0.699 0.615 −0.626 0.634 PC2: −0.634 Diameter 3.13 3.34 0.608 0.052 0.618 0.588 −0.633 0.666 PC2: −0.544 Health 3.62 3.02 0.613 0.080 0.714 0.627 −0.671 0.686 PC2: −0.616 June Height 2.44 2.32 0.580 0.028 0.422 0.441 −0.534 0.363 PC3: −0.691 Density 4.37 3.73 0.608 0.057 0.689 0.735 −.0693 0.597 PC2: −0.581 Diameter 3.94 4.19 0.610 0.035 0.695 0.729 −0.749 0.613 PC2: −0.520 Health 3.91 3.68 0.577 0.069 0.685 0.716 −0.717 0.594 PC2: −0.521 September Height 2.95 2.46 0.619 0.020 0.230 0.018 −0.235 0.357 PC4: −0.703 Density 4.04 4.36 0.608 0.023 0.549 0.554 −0.554 0.373 PC3: −0.518 Diameter 4.37 4.62 0.555 0.073 0.628 0.382 −0.596 0.647 PC4: −0.532 Health 4.49 4.38 0.594 0.027 0.663 0.477 −0.633 0.571 PC3: −0.596 GRVI Green 551/M 747/691 Best PC June Chlorophyll 1.148 1.134 0.584 0.000 0.493 −0.479 −0.492 0.502 PC2: −0.494 July Chlorophyll 1.088 1.020 0.552 0.000 0.429 −0.314 −0.451 0.484 PC2: −0.477 August Chlorophyll 1.157 1.041 0.774 0.000 0.270 −0.190 −0.239 0.208 PC6: 0.211 September Chlorophyll 1.232 1.033 0.765 0.053 0.308 −0.126 −0.255 0.234 PC8: 0.302 * m is the mean spectrum reflectance intensity for the plant across all wavelengths. Table 2. Summary statistics for the physical traits scored in 2017 and correlated spectral traits.
-
Linkage Group (LG) Position Max LOD Spectral trait
(nm)Other significant
spectral traitsSignificant physical traits Parent LG1 0−6 cM 4.38 at 6 cM 551/509 / / Dominant LG2 21−26 cM 4.52 at 21 cM 509/512 / / Dominant LG2 36−40 cM 4.77 at 36 cM 470/523 / / Dominant LG2 46-48 cM 4.67 at 46 cM 711/686 / / Moy LG2 99−103 cM 4.87 at 99 cM PC5 / / Latham LG3 3 cM 5.00 at 3 cM 557/658 PC7 / Latham LG3 22 cM 5.93 at 22 cM 551/m / Diameter
(29 cM, LOD 4.24)/ LG3 54−79 cM 10.13 at 62 cM 700 403−731,
Green, Red, NDVI, NDRE, GNDVI, GNRI, 719/691, 728/m, PC2, PC8, PC11 and many othersDensity
(68 cM, LOD 6.67)Additive LG4 6−10 cM 7.05 at 6 cM 747/691 568−708,
Red, GNDVI, GRVI, NDVI, NDRE, many ratios, PC2density
(6 cM, LOD 4.41)Dominant LG5 None / / / / / LG6 55−63 cM 4.78 at 55 cM 509/512 GRVI, 719/691, 551/m / Latham LG7 None / / / / / Table 3. Location of QTLs for spectral data and plant physical data collected in August 2016.
-
Linkage Group (LG) Position Max LOD Spectral traits (wavelengths ratios, nm) Other significant spectral traits Significant physical traits Historic traits Parent LG1 7−36 cM 5.3 at 27cM 820/848 PC2, PC4 10BW (LOD 6.58,
7 cM), PFS (LOD
5.45, 9 cM)Fruit ten-berry
weightMoy LG1 55−68 cM 5.0 at 68 cM 399/427 / / / Both (dom) LG2 16−26 cM 9.4 at 19 cM 623/679 PC5, PC6 / Many fruit visual and colour meter scores Both (mainly additive) LG2 39−46 cM 5.8 at 45 cM 455/539 / / / Both (dom) LG3 8−25 cM 10.6 at 23 cM 651/932 Red, RE, NIR, PC1,
PC4, PC6/ / Both (mainly additive) LG3 40−56 cM 12.4 at 48 cM 539/932 Green, NDRE, GRVI, GNDVI, PC3 / Fruit colour meter scores Both (mainly additive) LG3 68−107 cM 8.6 at 72 cM 736/792 PC8 10BW (LOD 6.65, 107 cM), PFS (LOD 4.23, 107 cM) Fruit colour meter scores Both (mainly additive) LG4 29−50 cM 9.5 at 31 cM 483/623 PC8 / Fruit visual and
colour meter scores (both parents)Latham LG5 3−23 cM 6.8 at 23 cM 764/932 RE 10BW (LOD 4.86,
4 cM), brix (LOD
5.13, 17 cM)Fruit ten-berry
weightMoy LG6 55−74 cM 7.6 at 57 cM 595/707 Green, GNDVI,
NDVI, PC5, PC3/ Fruit visual and
colour meter scoresLatham LG7 None / / / / / / Table 4. Location of QTLs for berry spectral and physical data collected in July 2017.
Figures
(3)
Tables
(4)