-
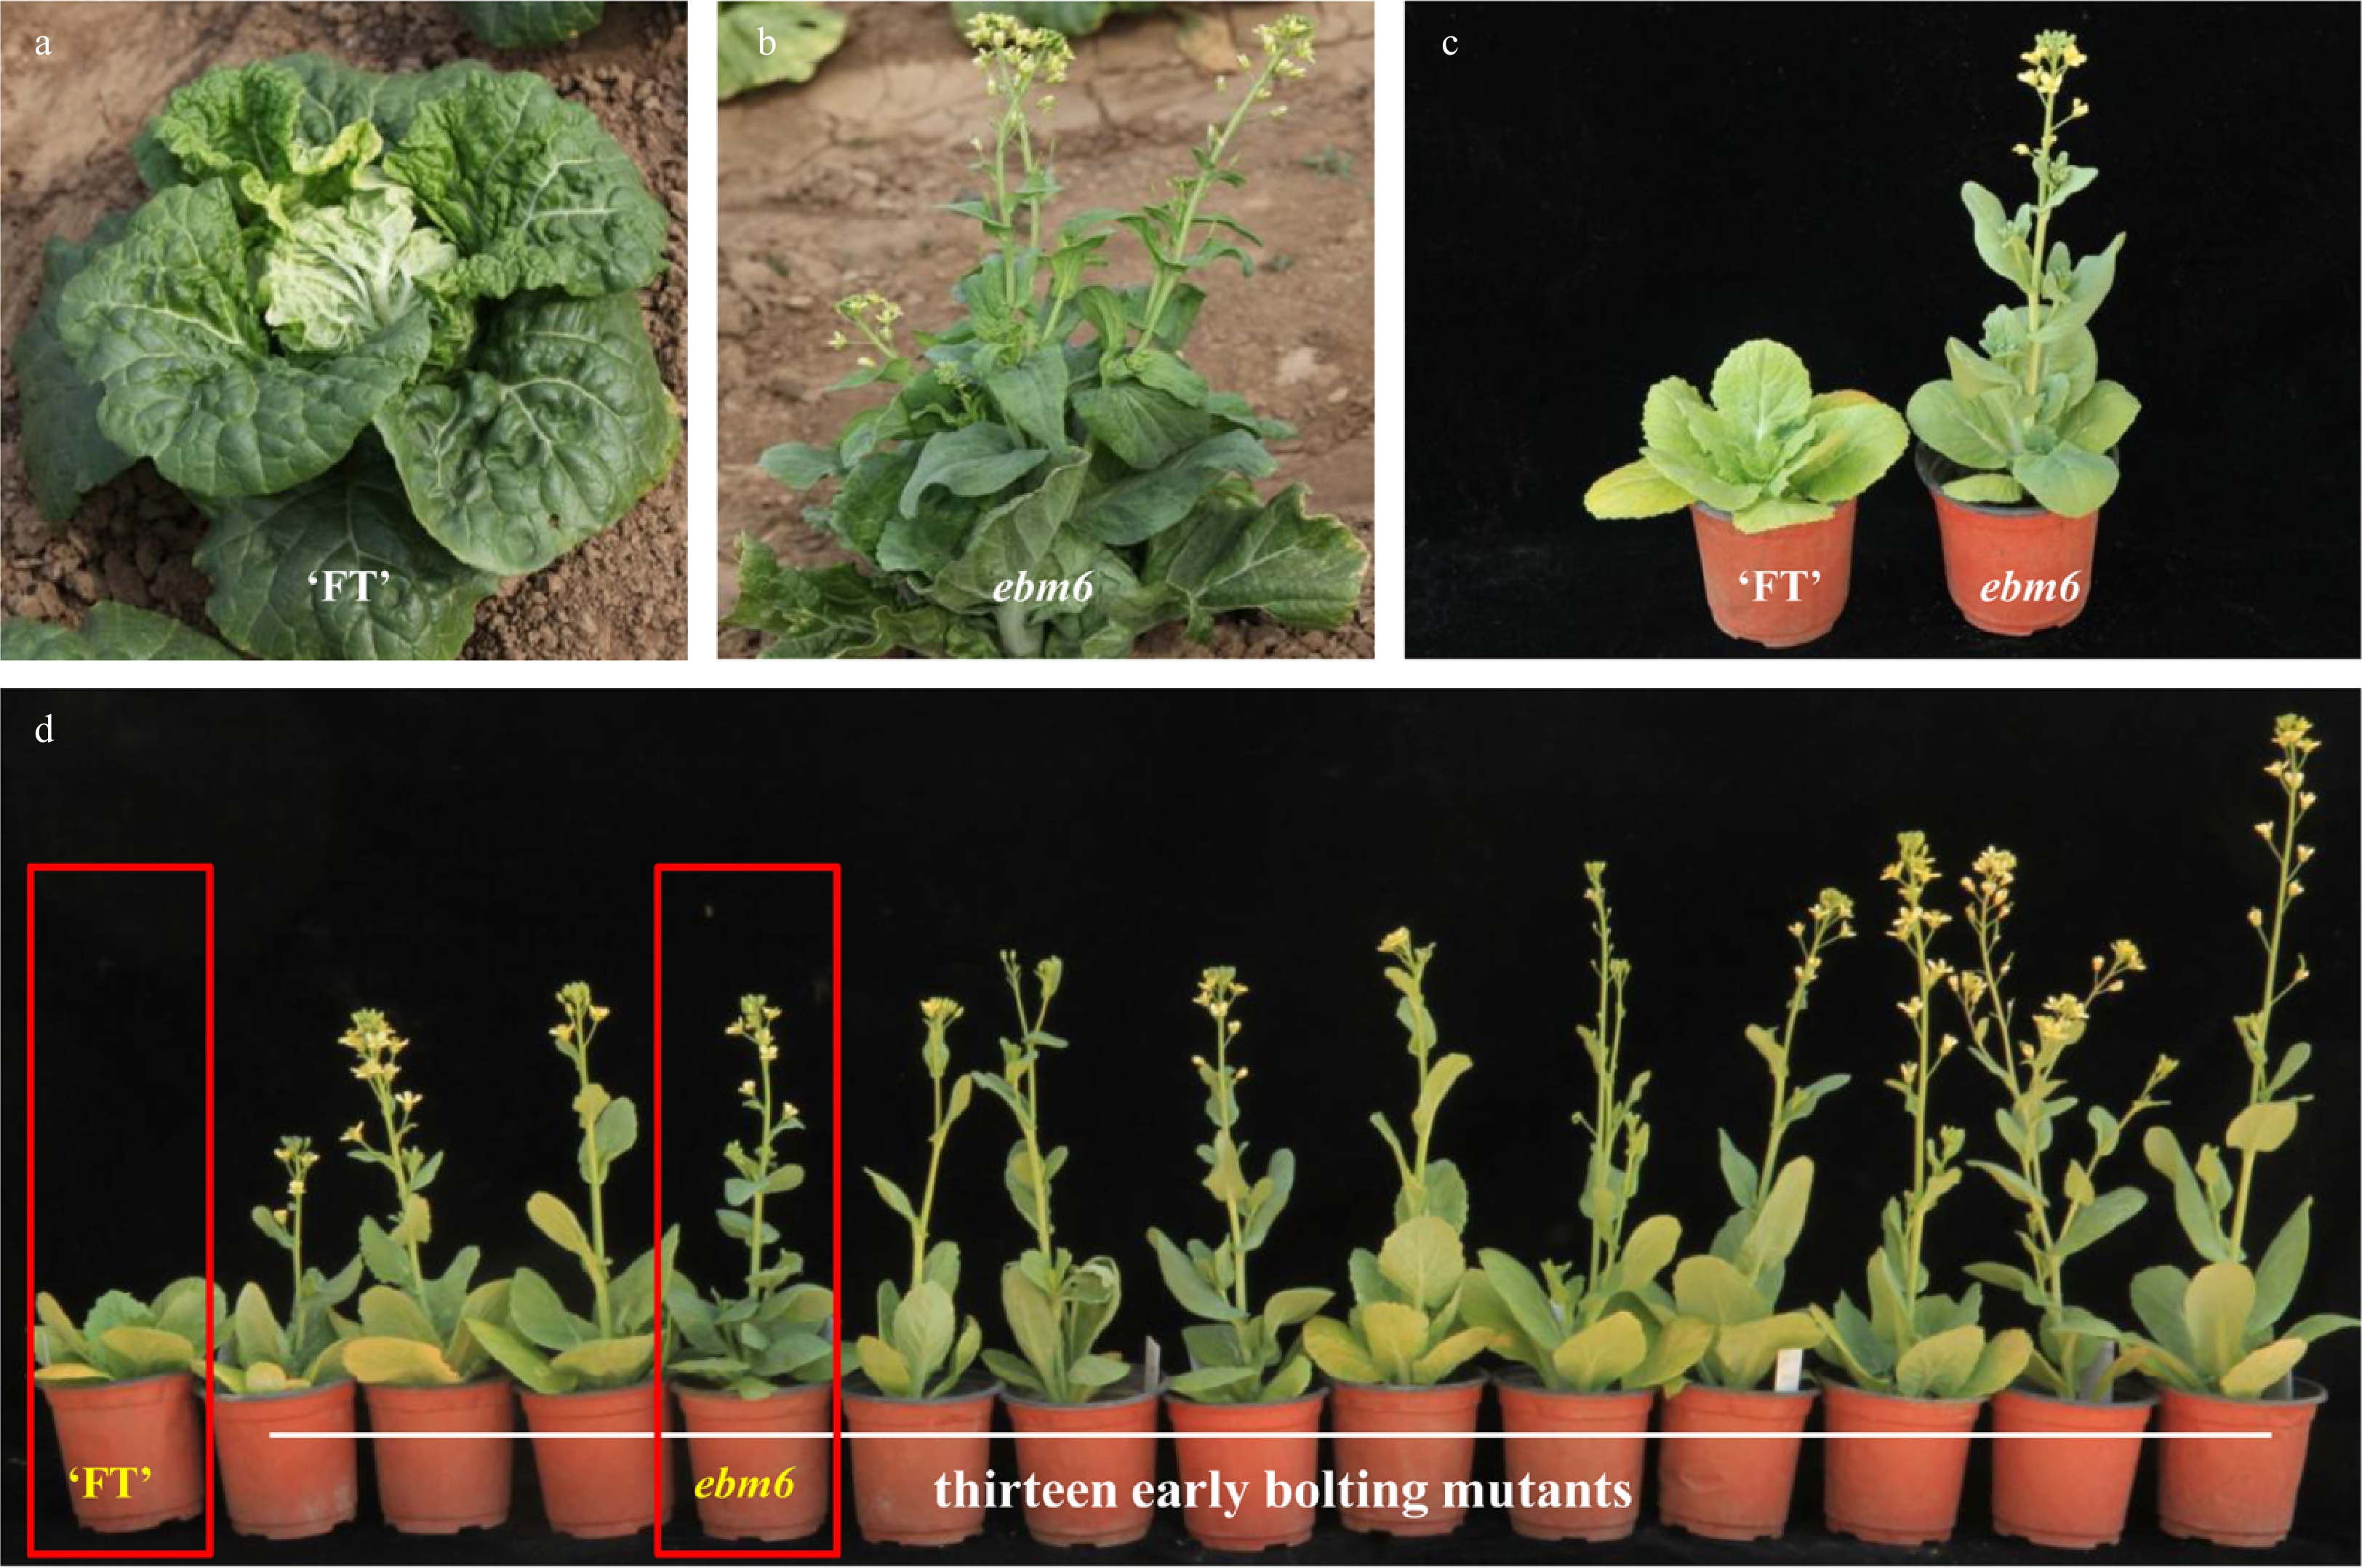
Figure 1. Phenotypic characterization of the Chinese cabbage 'FT' and early bolting mutants. (a) Wild-type 'FT' with ovoid leaf heads grown in an open environment. (b) Mutant ebm6, flowering in an open environment. (c) Wild type 'FT' (left) and mutant ebm6 (right) at the flowering stage. (d) Phenotypes of 13 stably inherited early bolting mutants.
-
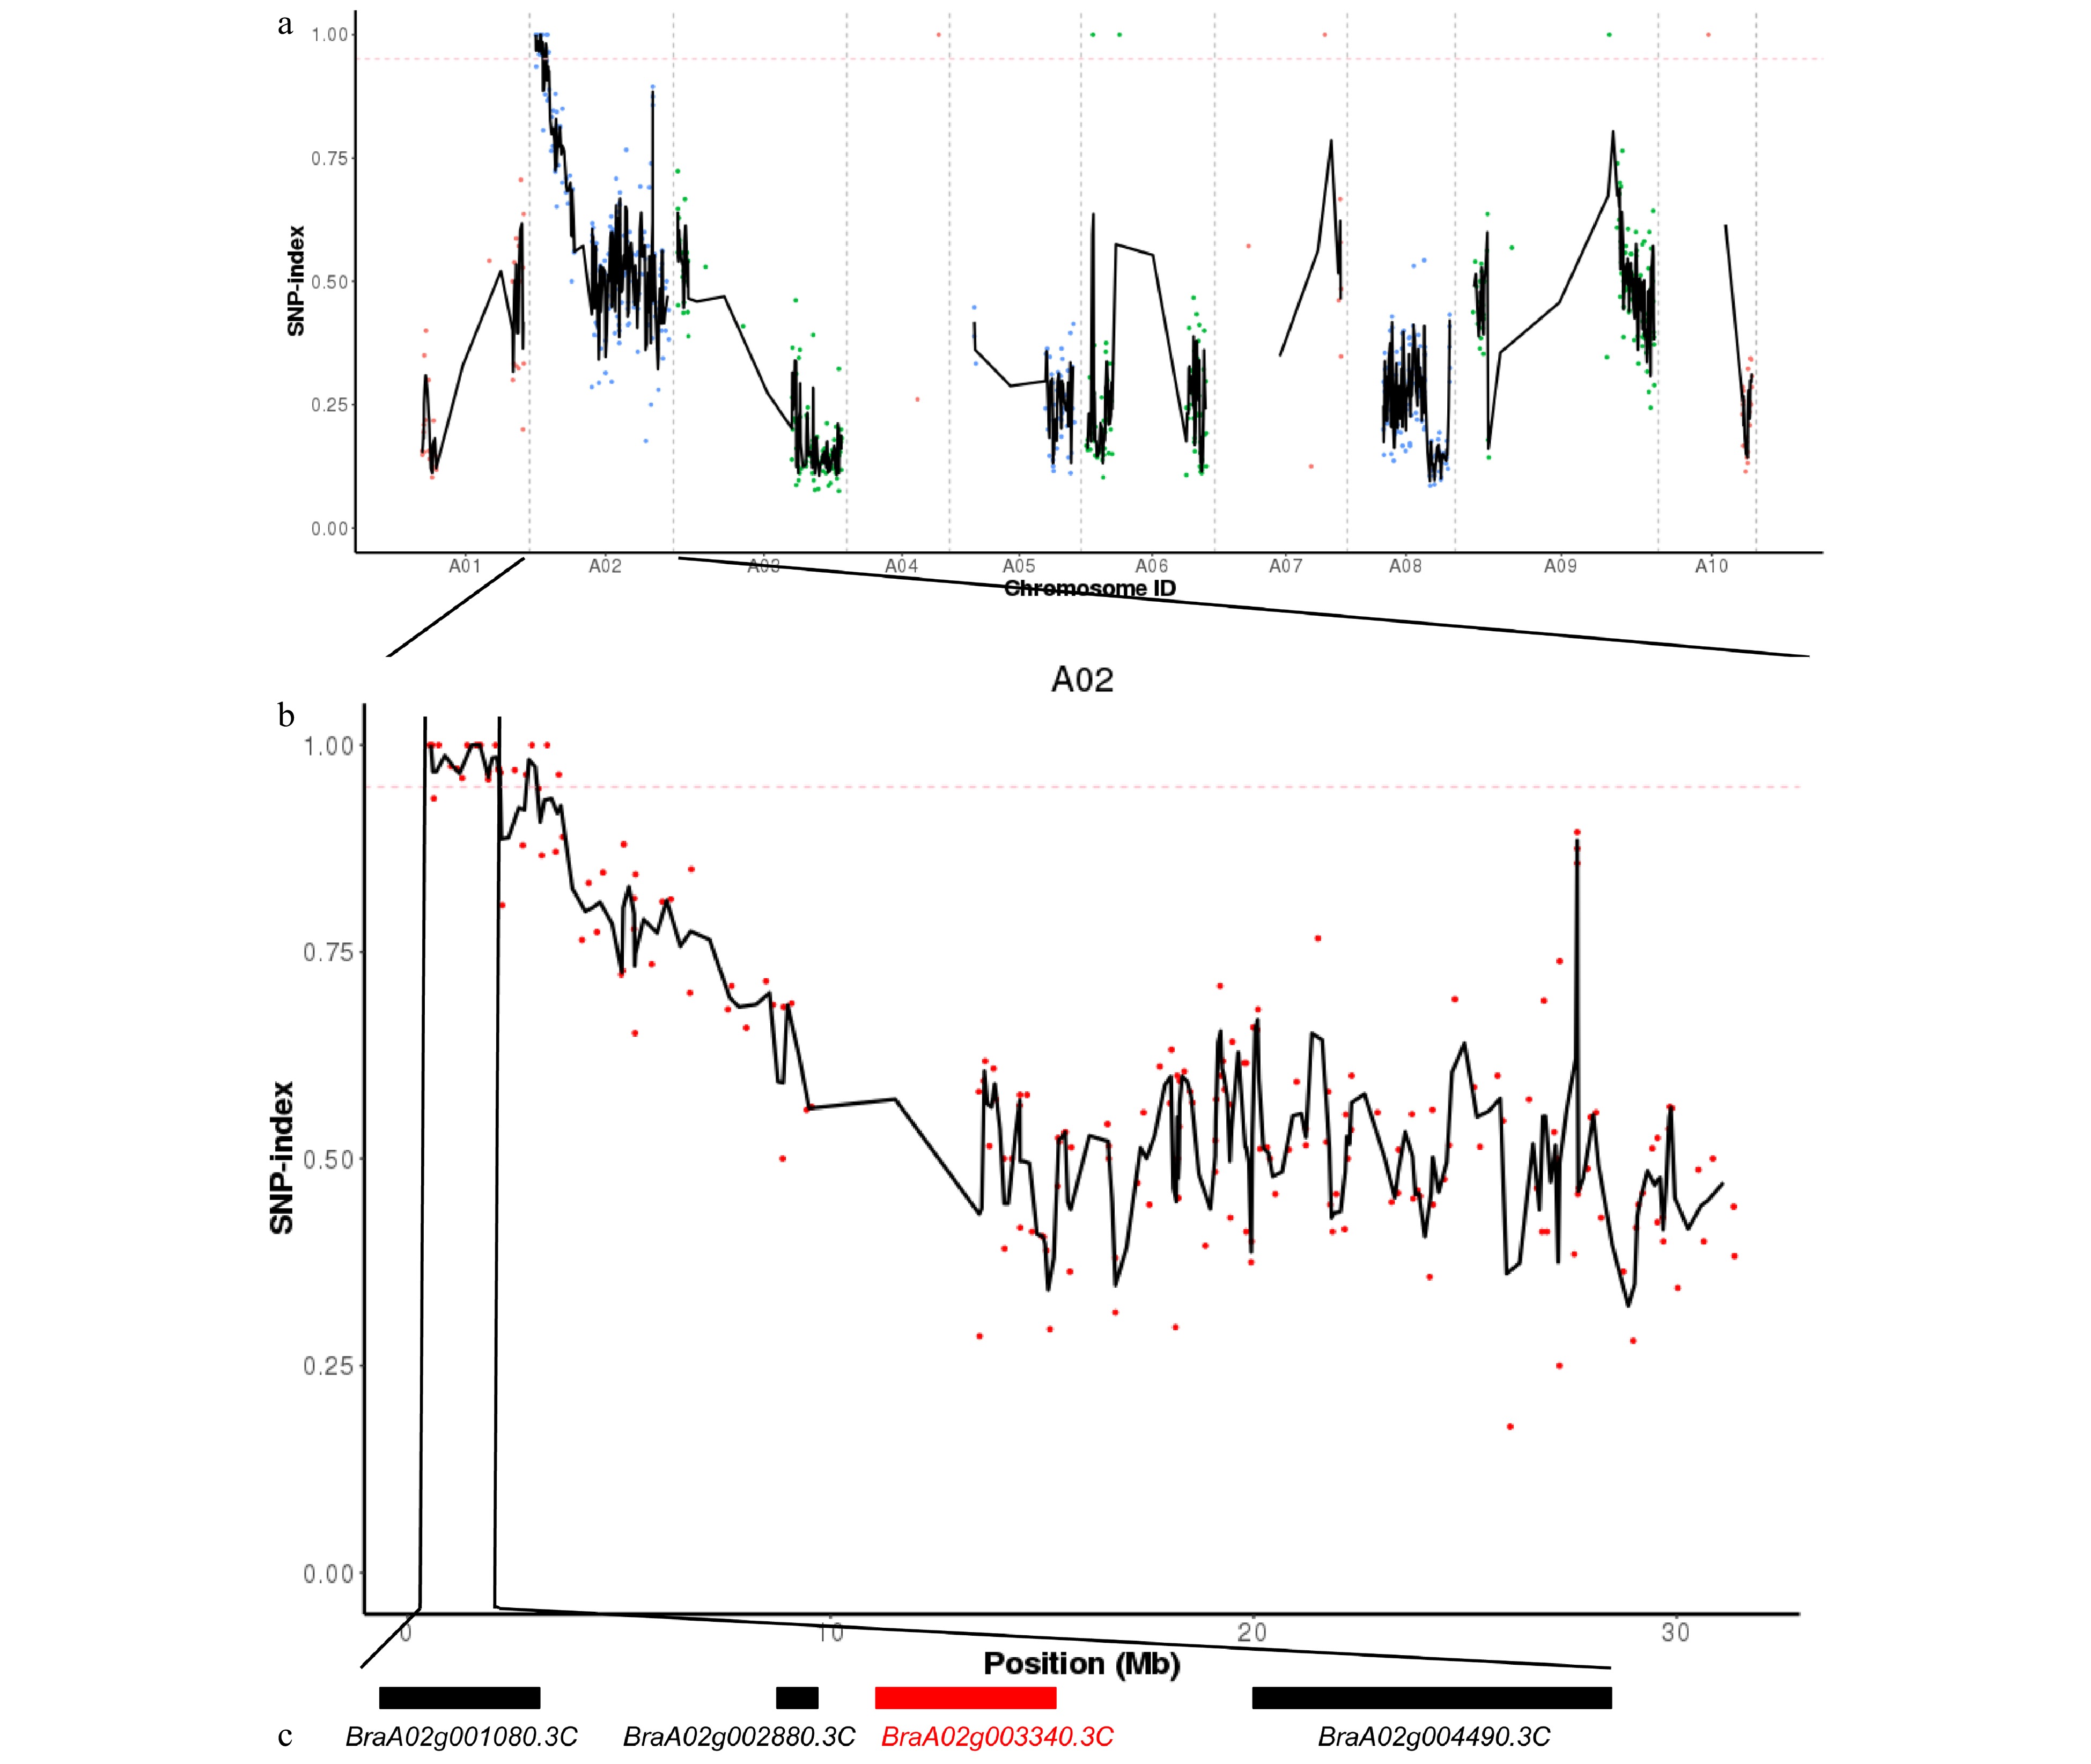
Figure 2. Distribution of the early-bolting mutant site in Chinese cabbage, as determined with Mutmap and analysis of the candidate genes. (a) SNP index of ten chromosomes plotted using MutMap. The x-axis indicates the positions of the ten chromosomes. The y-axis indicates the SNP index. The dotted pink line is the threshold of the SNP index (0.95). Black lines were created by averaging the SNP indices from a moving window spanning two consecutive SNPs and a moving window with one SNP at a time. (b) The SNP index plot from MutMap identifying the candidate regions on chromosome A02. (c) Four candidate genes in the mapping region. Genes indicated by black boxes are listed in detail in Table 3. The red box represents the mutant gene.
-

Figure 3. Genotype detection in 208 F2 individuals. KASP technique was used for genotyping and the genotype of candidate SNP was detected to be A:A in 96 recessive homozygous early bolting plants.
-
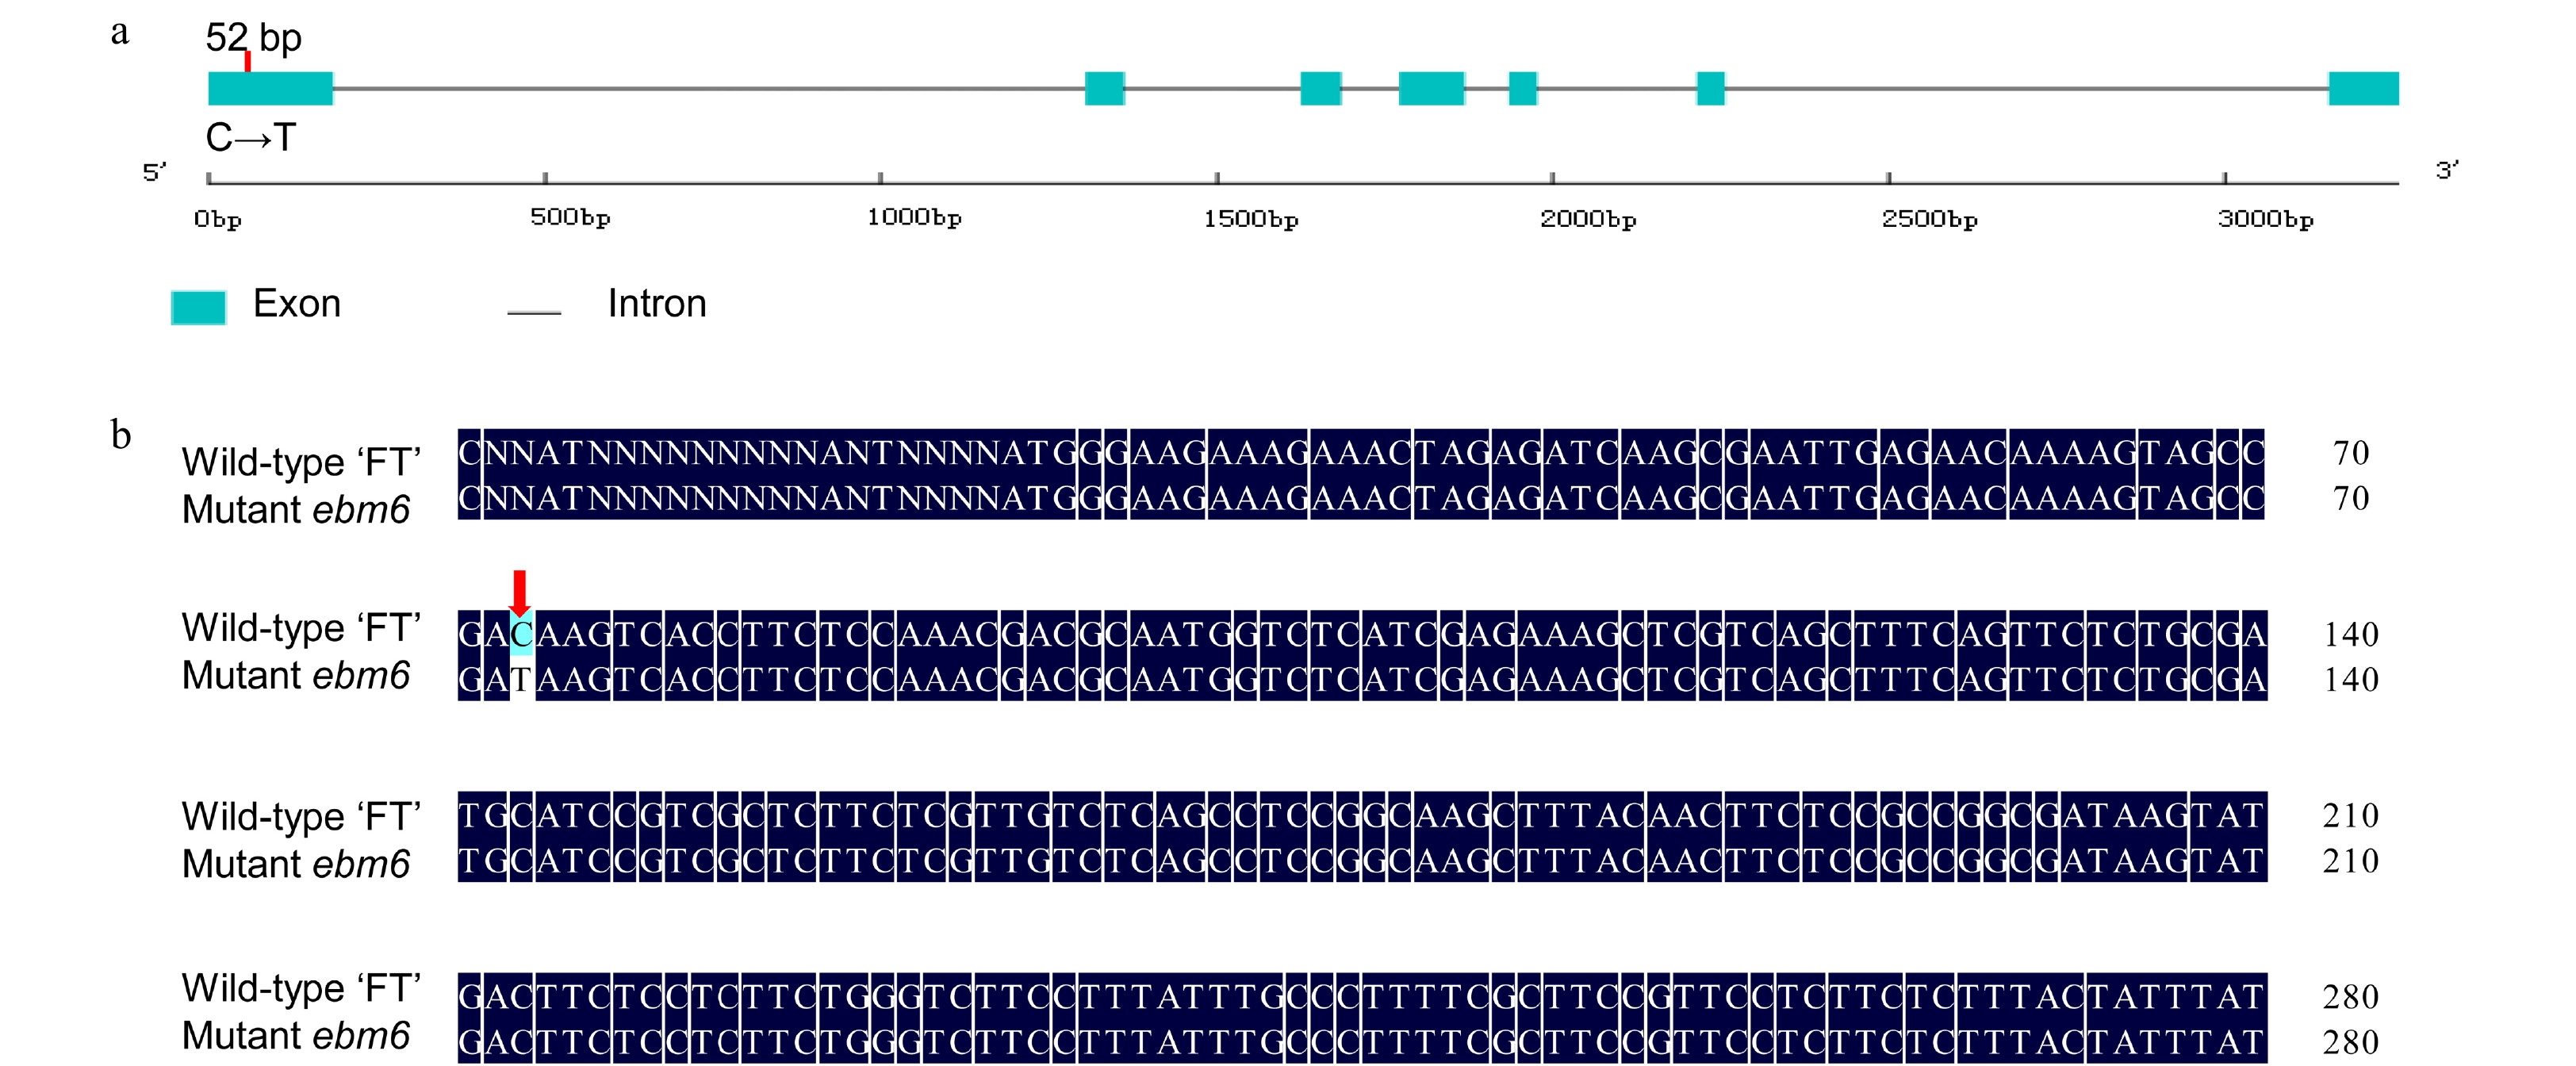
Figure 4. BrFLC2 gene structure and sequence alignment in Chinese cabbage. (a) The gene structure of BrFLC2 and the location of the stop-gain SNP in the mutant ebm6. The red vertical line indicates the SNP site. (b) Alignment of the gene sequences of the BrFLC2 in the wild-type 'FT' and mutant ebm6. The red arrow indicates where the SNP was altered.
-
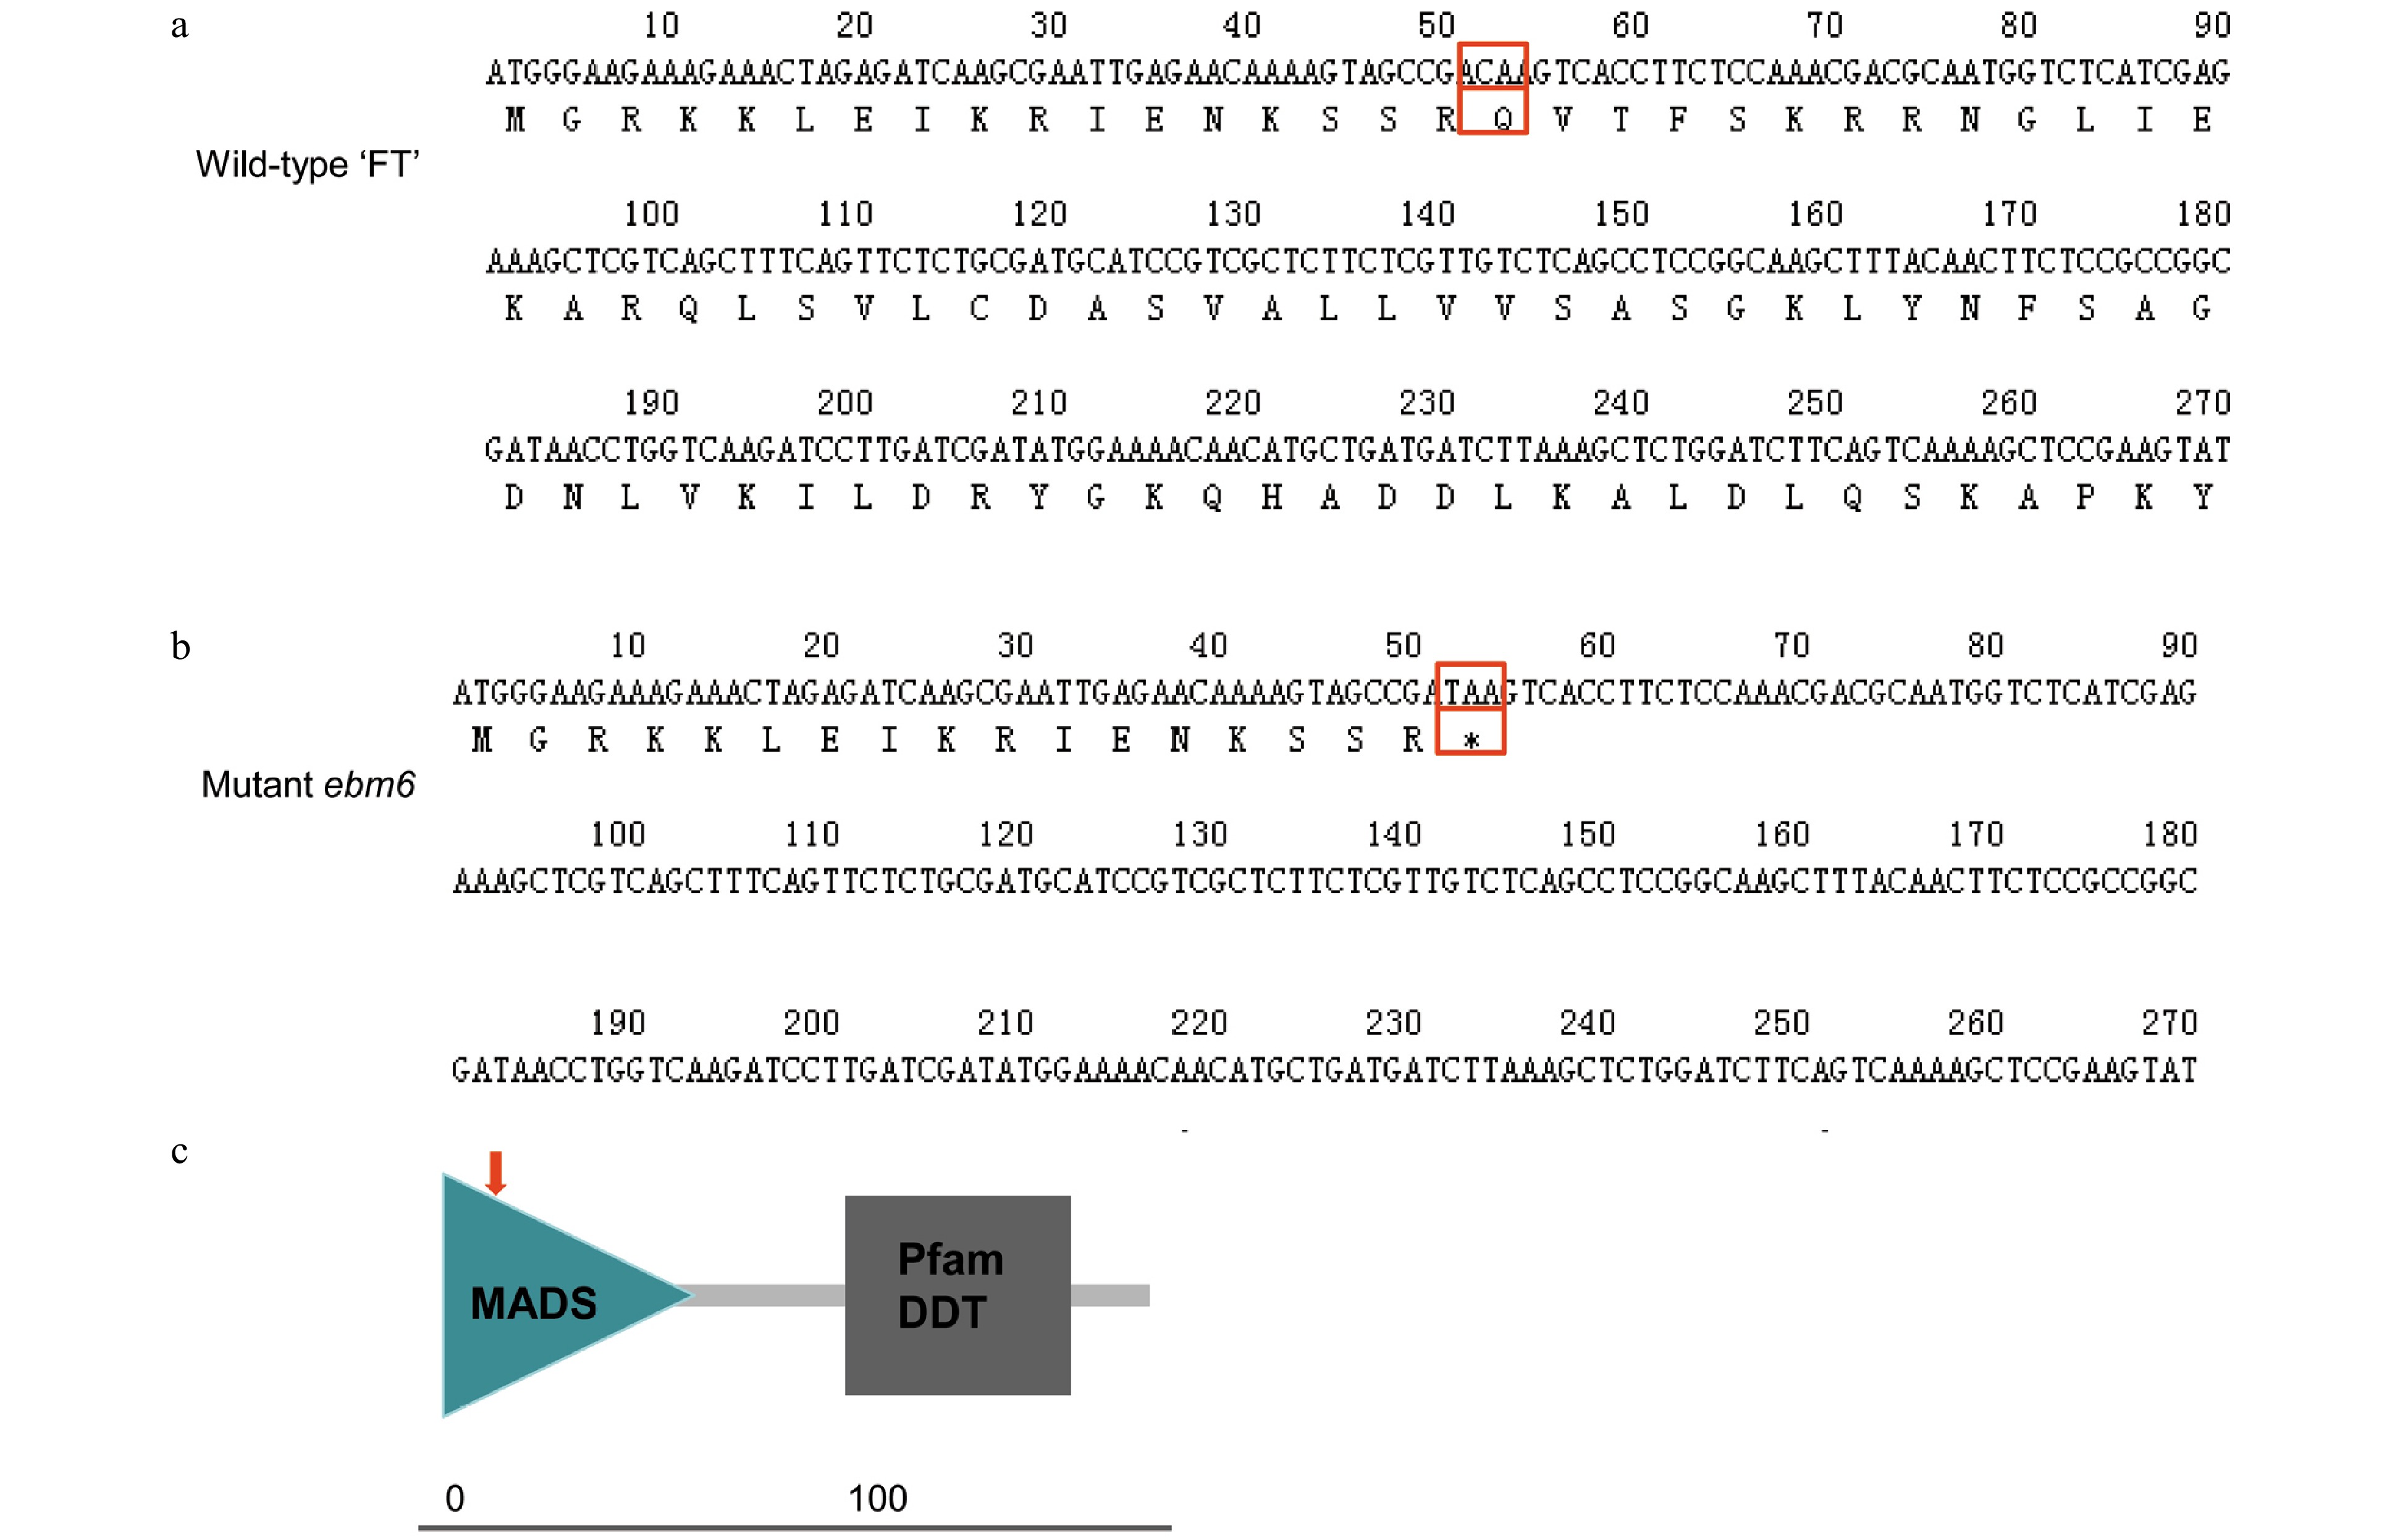
Figure 5. Translation of the protein sequences encoded by the partial nucleotide sequences of the Chinese cabbage 'FT' and mutant ebm6 lines, and analysis of their conserved domains. (a) Partial nucleotide sequence of the wild-type 'FT' translated into its protein sequence. The mutant site is identified with a red empty box. (b) Partial nucleotide sequence of the mutant ebm6 translated into its protein sequence. The red arrow indicates where C mutated to T. (c) The conserved domains of BrFLC2. The MADS domain sequence of BrFLC2 is from amino acids 1−60, and the Pfam K-box is from amino acids 73−164; the red arrow indicates the mutation site.
-
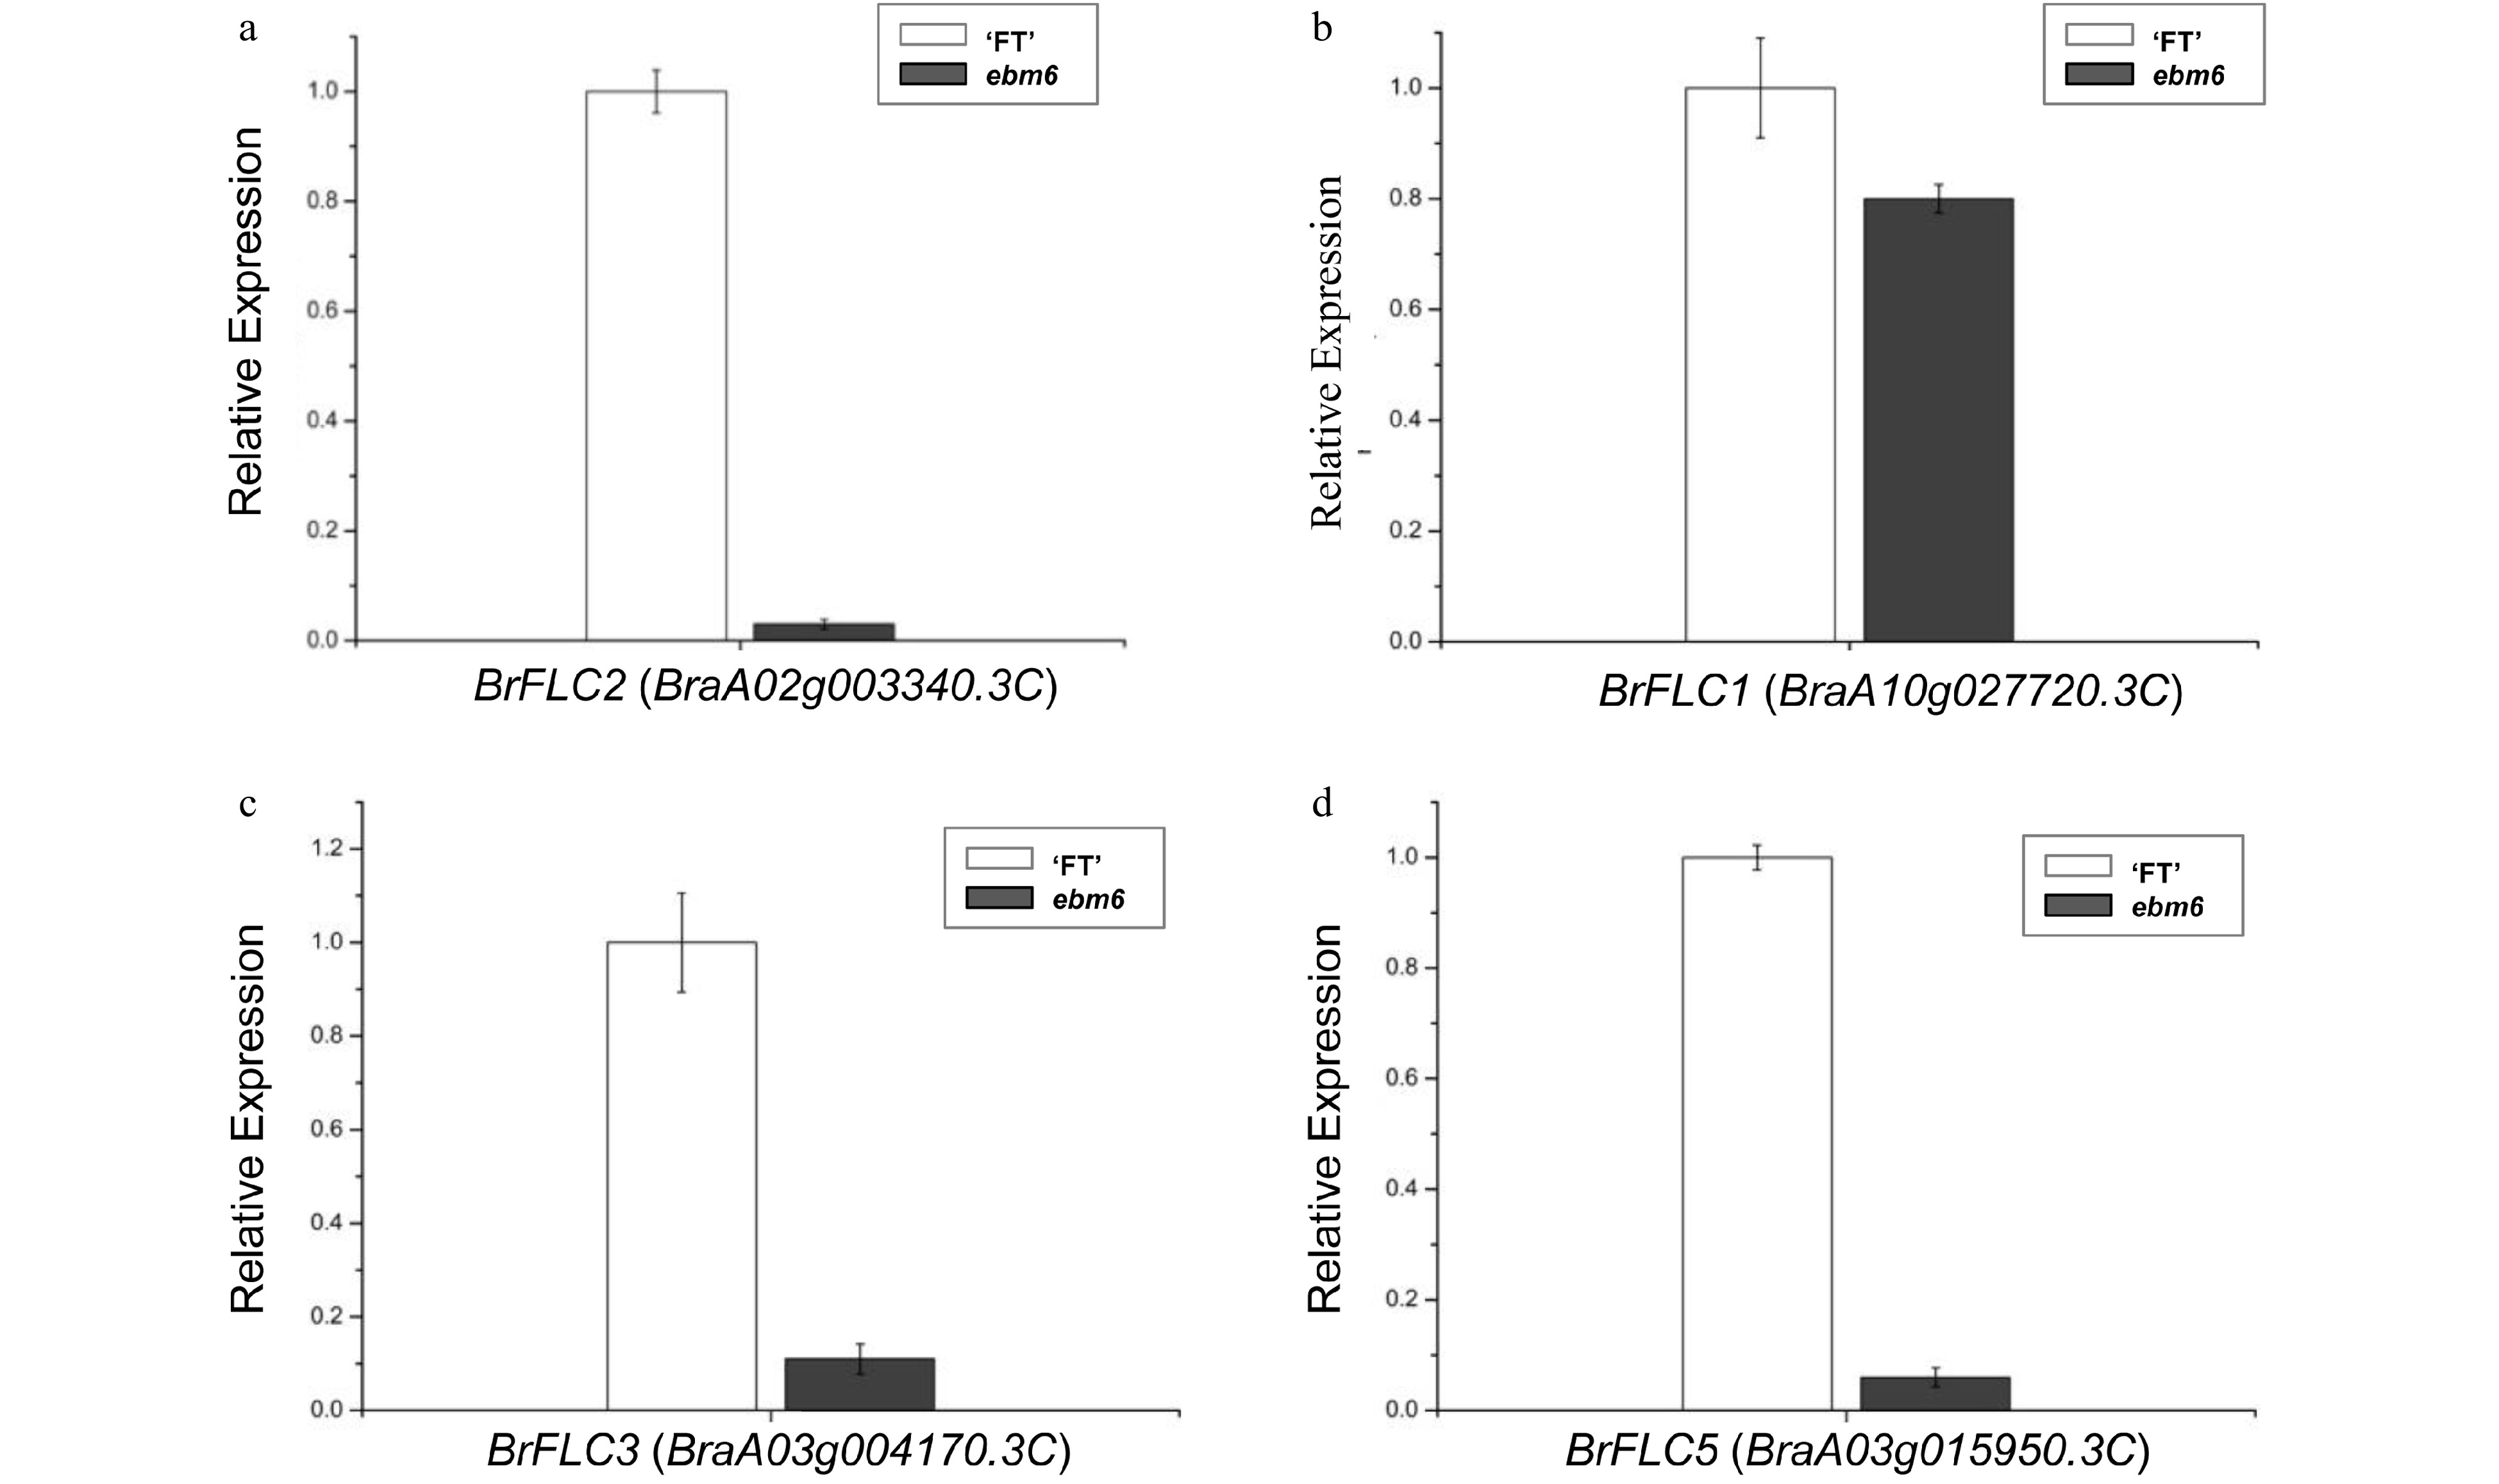
Figure 6. Gene expression levels, determined via qRT-PCR, for Chinese cabbage flowers from the 'FT' and mutant ebm6 lines. (a) Analysis of the BrFLC2 expression levels in the flowers of the 'FT' and mutant ebm6. (b−d) BrFLC1, BrFLC3, and BrFLC5 expression levels in the 'FT' and mutant ebm6, respectively. Standard errors from three replicates are represented with the error bars.
-
Material BI DE5 DE10 Flowering time 'FT' 67.49 ± 0.69 63.50 ± 0.45 67.42 ± 1.16 68.38 ± 0.70 ebm5-1 91.20 ± 0.92** 42.53 ± 0.67** 45.40 ± 1.25** 46.50 ± 1.18** ebm5-2 89.17 ± 0.88** 47.58 ± 0.88** 50.31 ± 1.13** 51.37 ± 0.93** ebm6 88.32 ± 0.45* 37.49 ± 0.77* 40.70 ± 0.51* 55.63 ± 0.88* ebm7 82.38 ± 0.84* 51.34 ± 0.67* 54.47 ± 0.81* 41.36 ± 0.62* ebm8 83.2 ± 0.77* 51.23 ± 0.48* 54.53 ± 0.56* 55.29 ± 0.51* ebm9 83.38 ± 0.74* 50.34 ± 0.55* 53.77 ± 0.31* 44.36 ± 0.55* ebm10 80.2 ± 0.87* 52.33 ± 0.48* 55.76 ± 0.45* 60.31 ± 0.23* Thirty plants from each line were used to identify the bolting characteristics in the natural environment. BI, bolting index; DE5, days to reach a 5-cm-high elongated stalk; DE10, days to reach a 10-cm-high elongated stalk. Mean and standard error (SE)-values were calculated from three independent replicates. Data were analyzed using SPSS16.0 (Chicago, IL, United States). * and ** indicate significant differences at 0.1 and 0.05, respectively. Table 1. Phenotypic values for wild-type 'FT' and seven Chinese cabbage mutants in the same environment.
-
Generation Total Wild-type
'FT'Mutant
ebm6Segregation
ratio${\textit{χ}}^2 $ textP1 ('FT') 50 50 0 P2 (ebm6) 50 0 50 F1 (P1 × P2) 82 82 0 F1 (P2 × P1) 150 150 0 BC1 (F1 × 'FT') 78 78 0 BC1 (F1 × ebm6) 75 40 35 1.14:1 0.35 F2 186 138 48 2.88:1 0.06 Table 2. Genetic analysis of the early bolting Chinese cabbage mutant ebm6.
-
Name Gene ID Chr Variation site Variation base Exon ID Mutation type SNP index SNP581431 BraA02g001080.3C A02 581431 G-A exon1 nonsynonymous SNV 1 SNP1410912 BraA02g002880.3C A02 1410912 G-A exon1 nonsynonymous SNV 1 SNP1619528 BraA02g003340.3C A02 1619528 G-A exon1 stopgain 1 SNP2159660 BraA02g004490.3C A02 2159660 G-A exon3 nonsynonymous SNV 0.97 Table 3. Candidate gene information from the candidate interval.
Figures
(6)
Tables
(3)