-
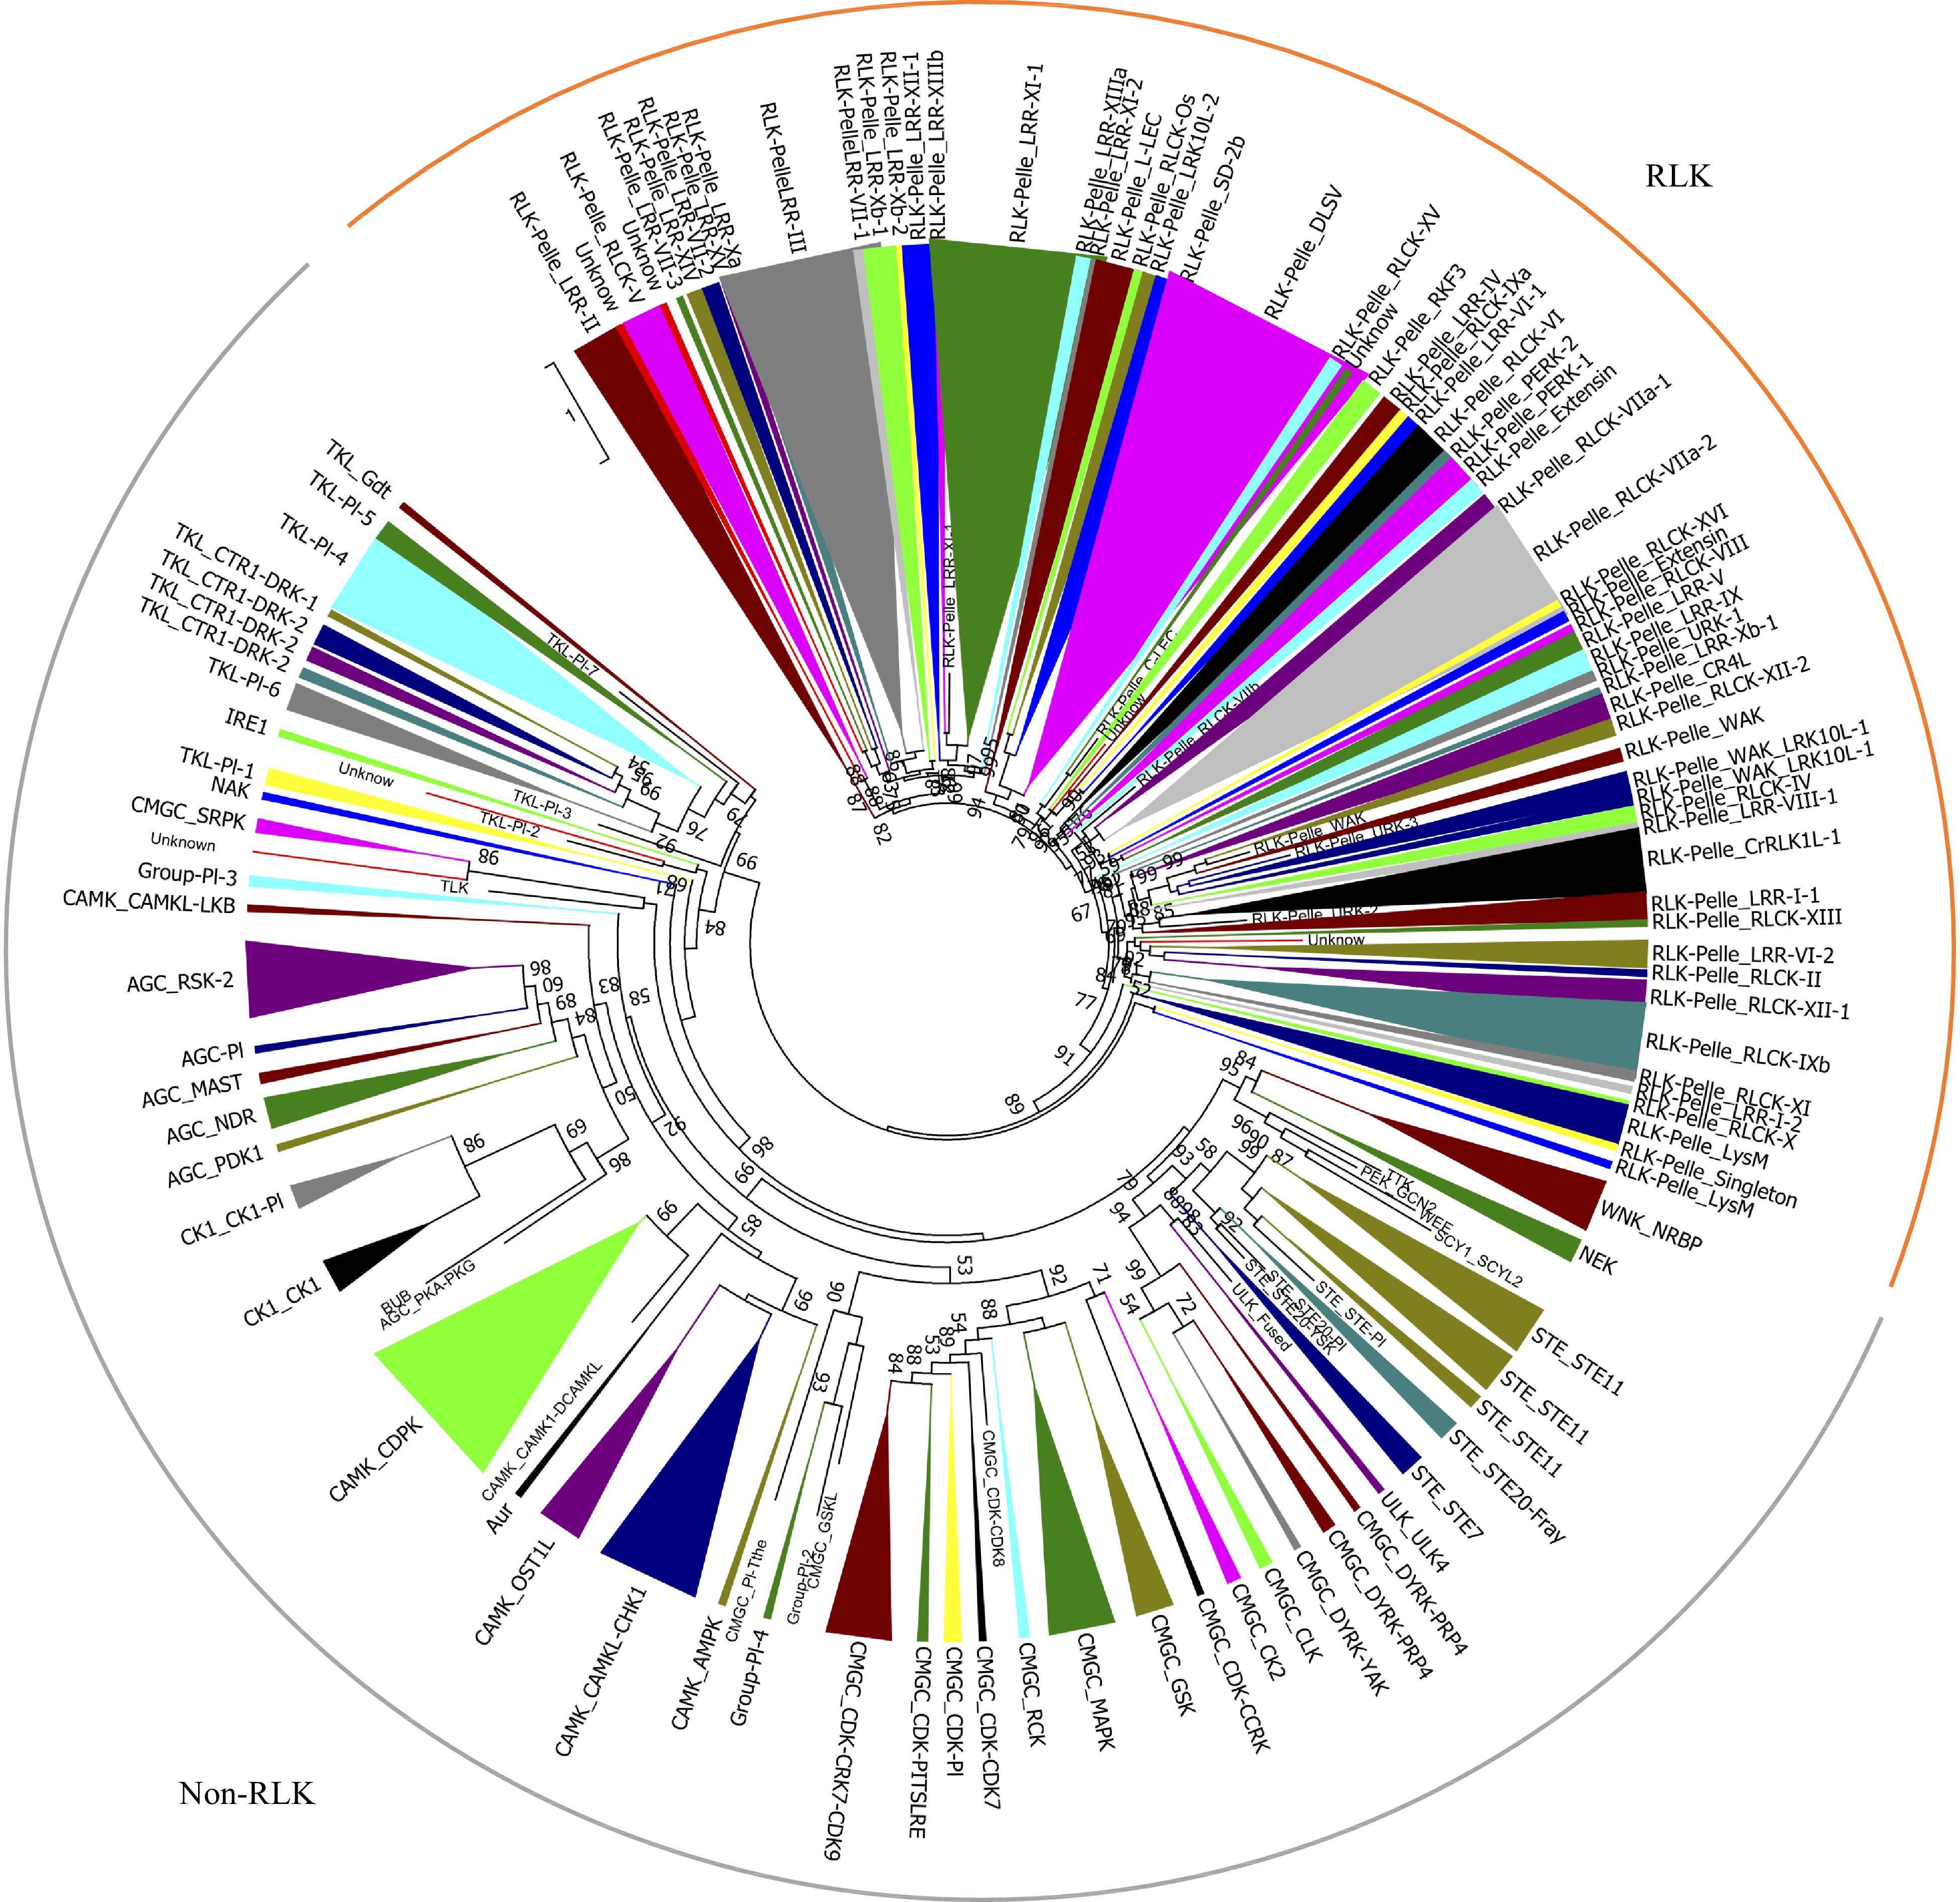
Figure 1. Phylogenetic analyses and classification of PKs identified in the pecan genome. The phylogenetic tree of the 967 PKs in pecan was constructed by kinase domain sequences and classified into 121 subfamilies. Branches were colored to represent two major clades, the RLK clade was marked as orange, and the non-RLK clade was marked as grey.
-
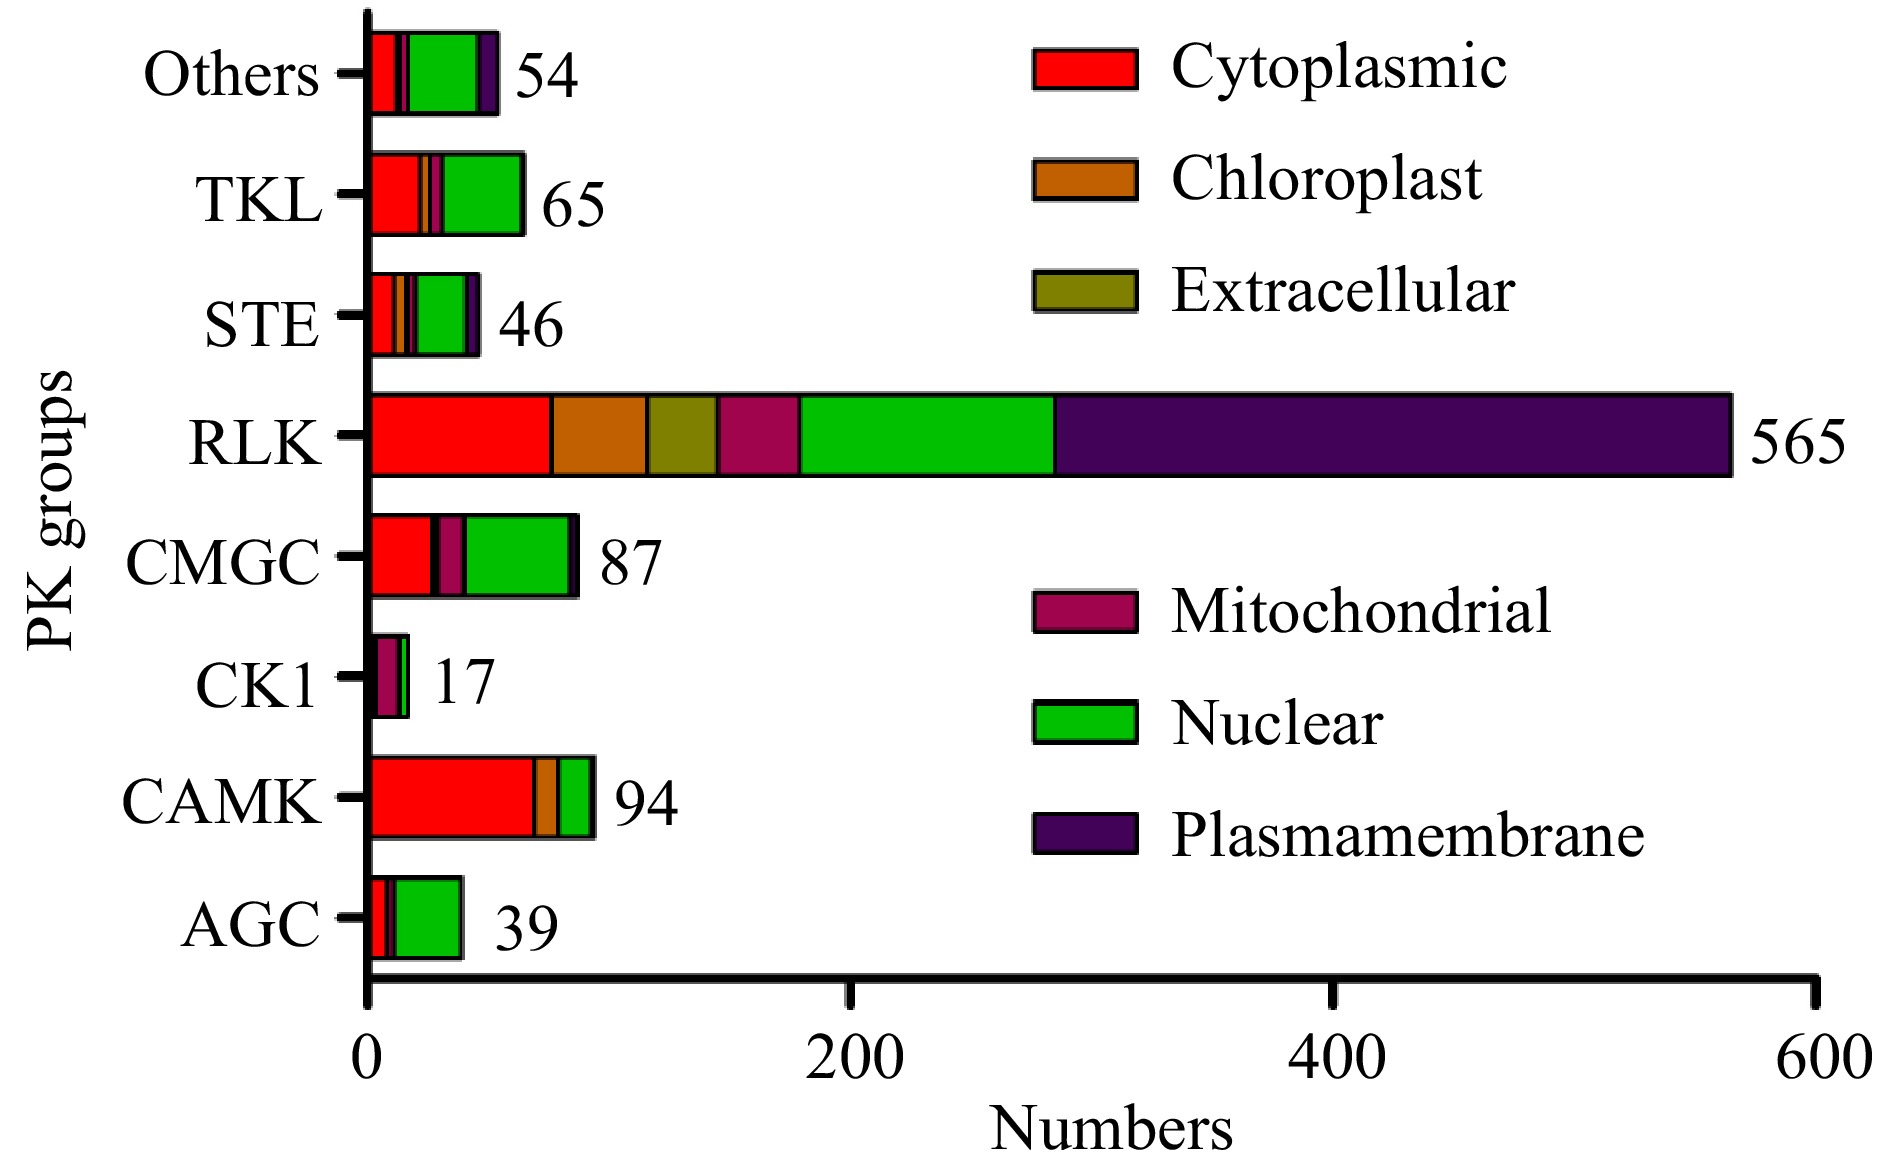
Figure 2. Subcellular localizations of pecan PK genes in different groups predicted by CELLO.
-
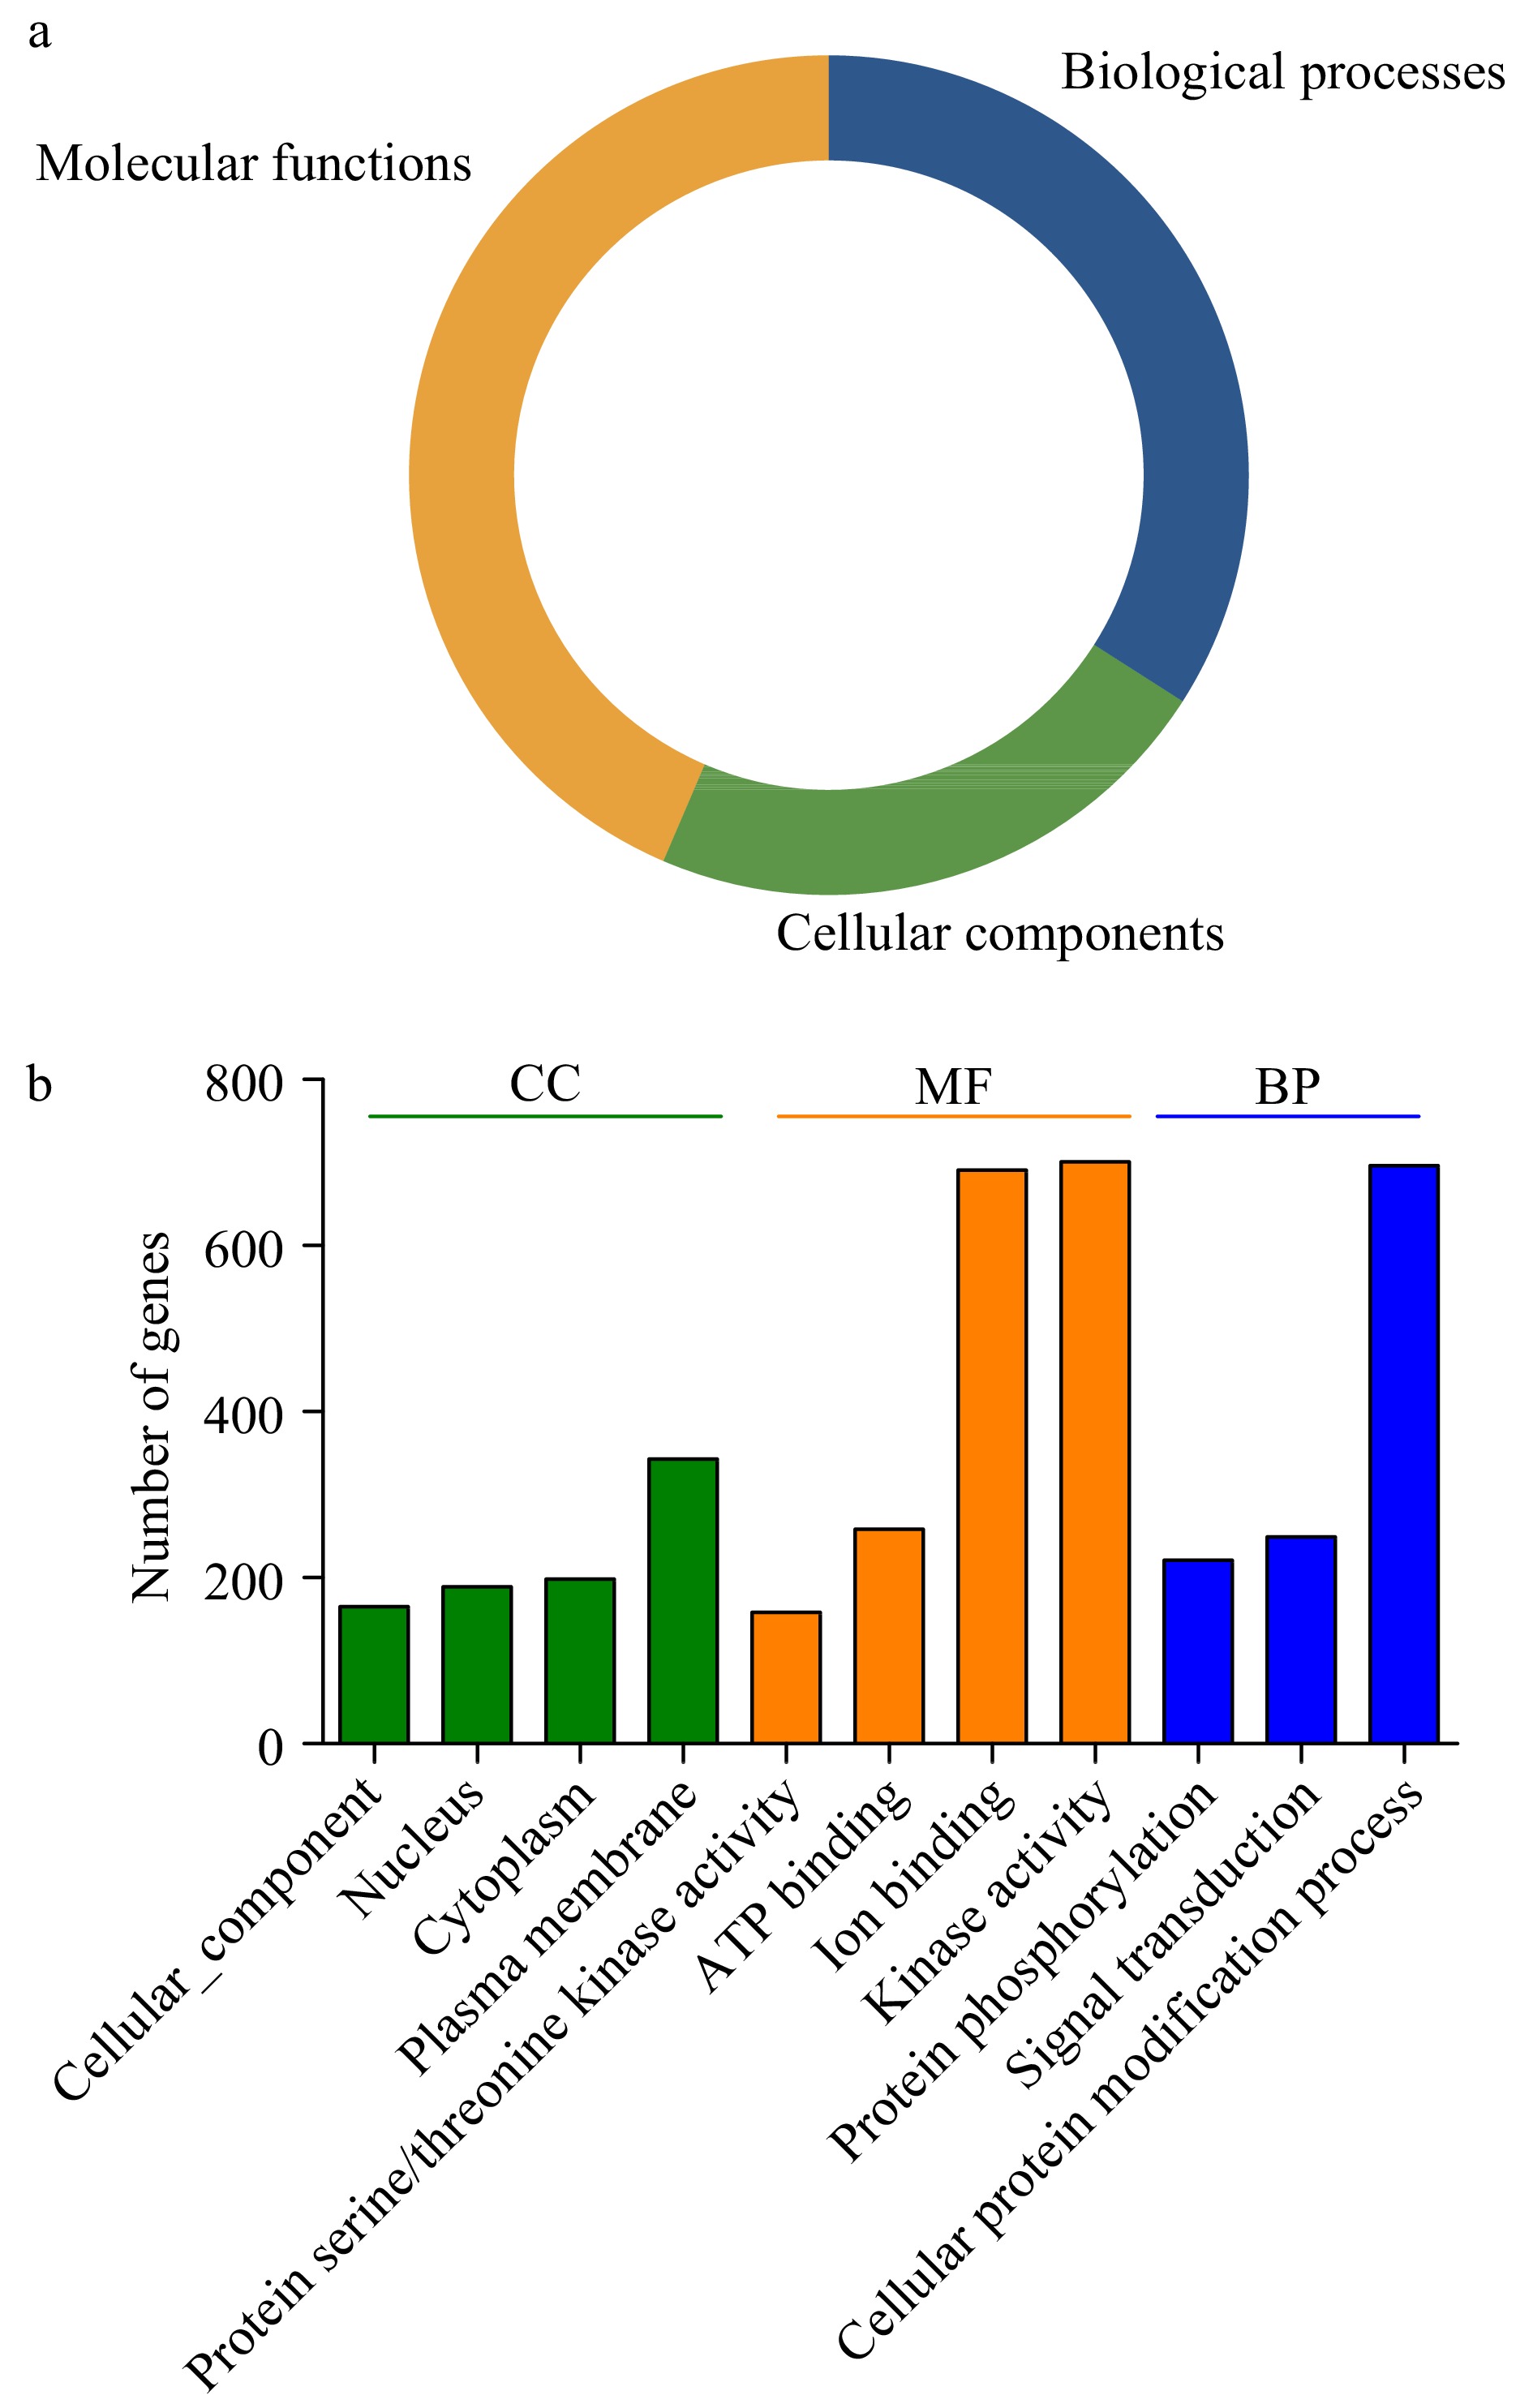
Figure 3. Gene ontology (GO) analyses of pecan PKs. (a) Pie charts indicated the relative proportion of the GO terms in the pecan kinome. (b) Detailed annotations in the different biological process (BP), cellular component (CC), and molecular function (MF) categories.
-
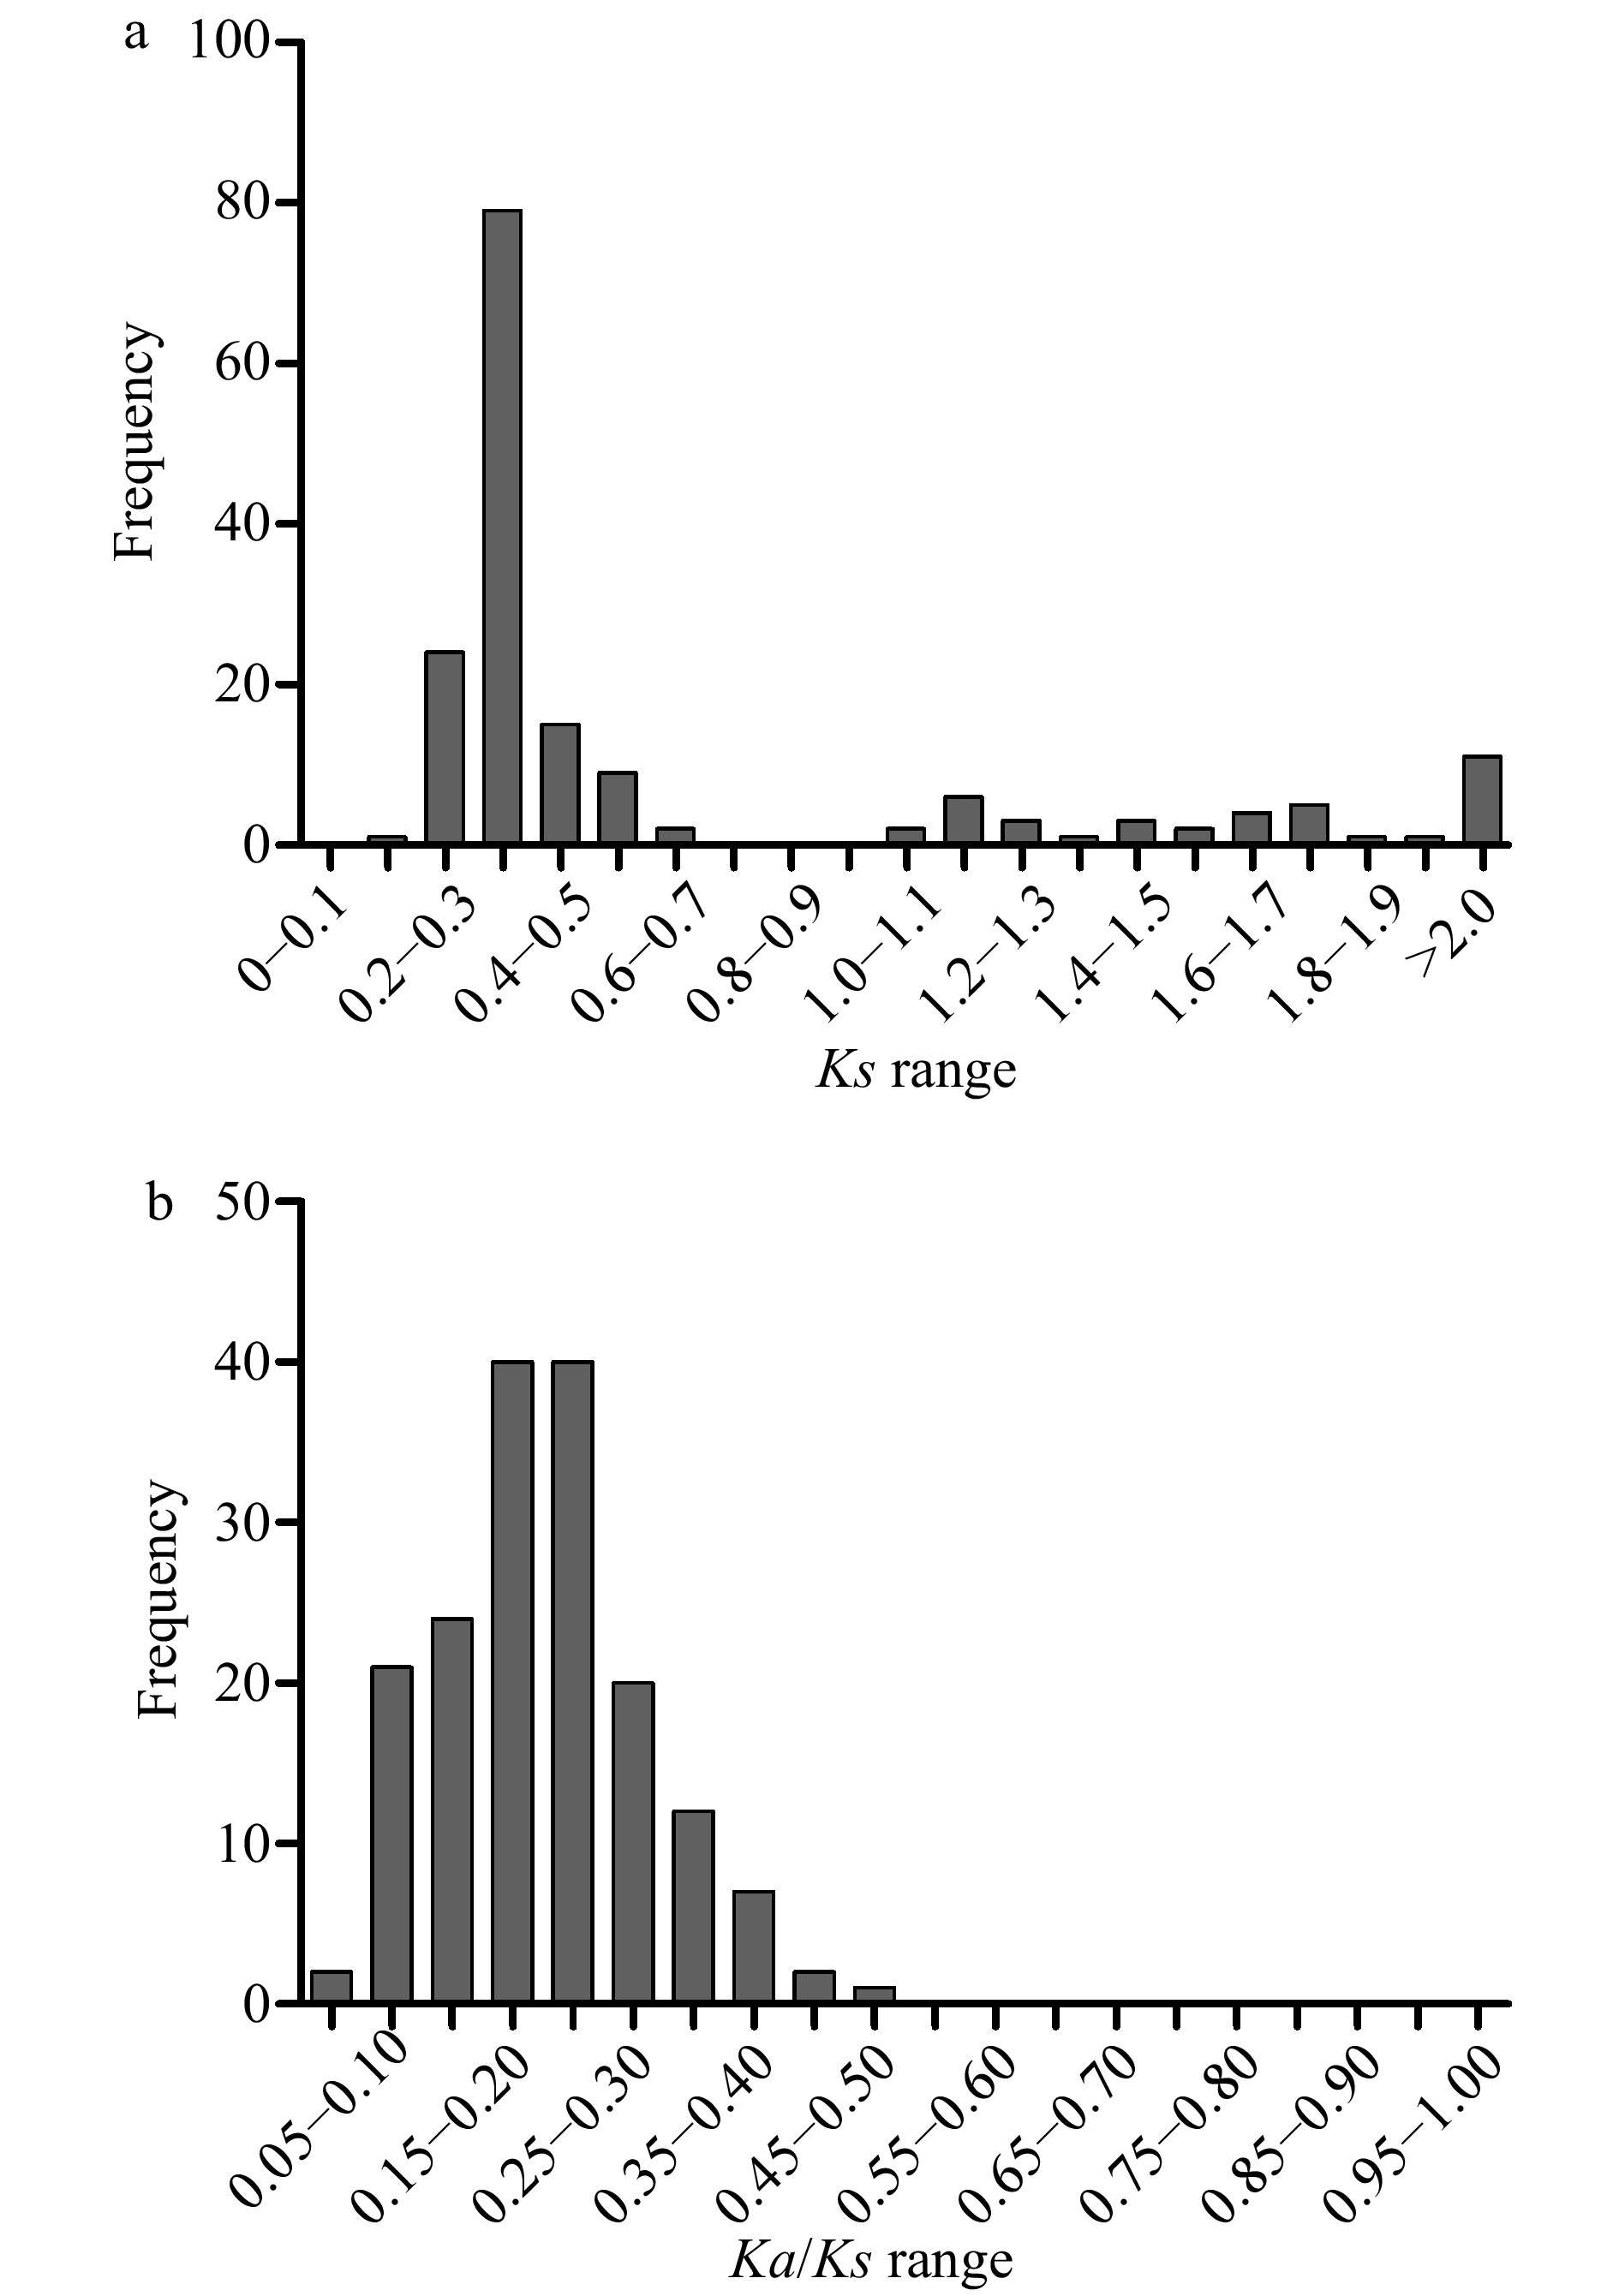
Figure 4. Distribution of relative Ks (a), and Ka/Ks (b) frequency among segmental duplication events in the pecan kinome.
-
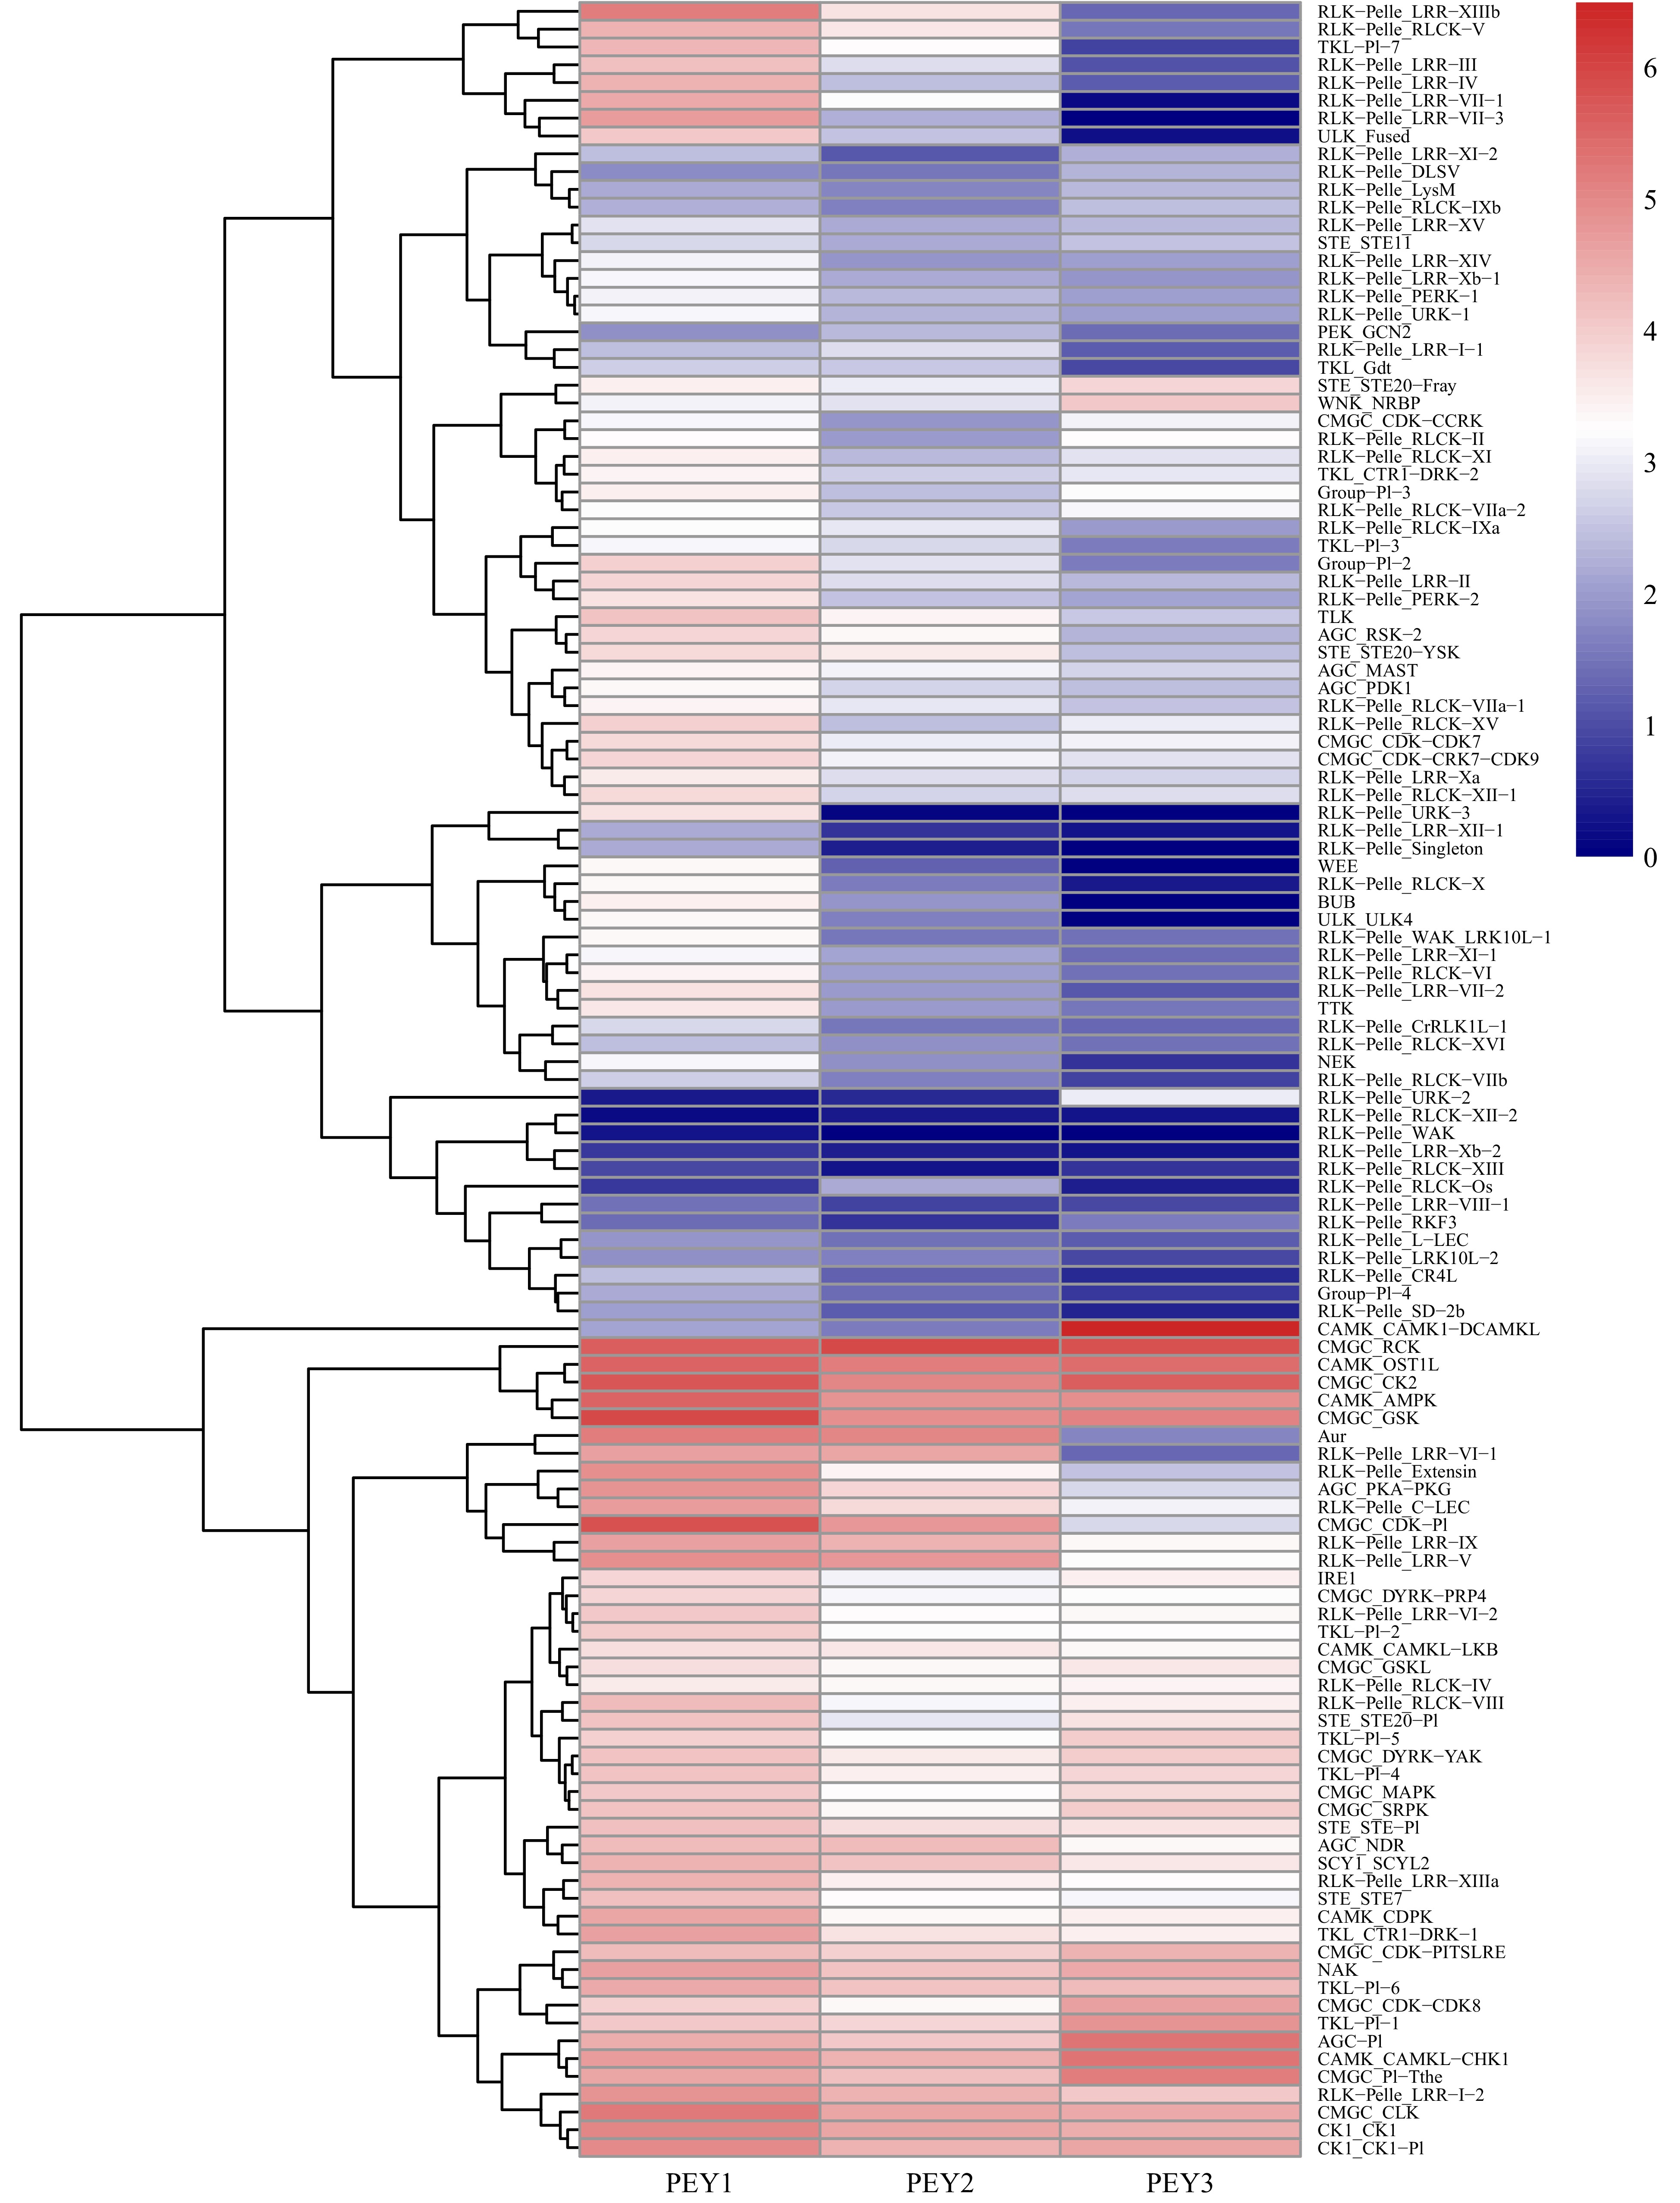
Figure 5. Expression analysis of the pecan PK subfamilies during embryo development. The expression data of different PK subfamilies collected from three representative periods of embryonic development of pecan including the early period (PEY1), the period with fully extended cotyledons (PEY2), and the fully matured period of the embryos (PEY3). Log2 (FPKM+1) values were performed according to the red-white-blue color scale. The heatmap was generated using the R package pheatmap with hierarchical clustering.
-
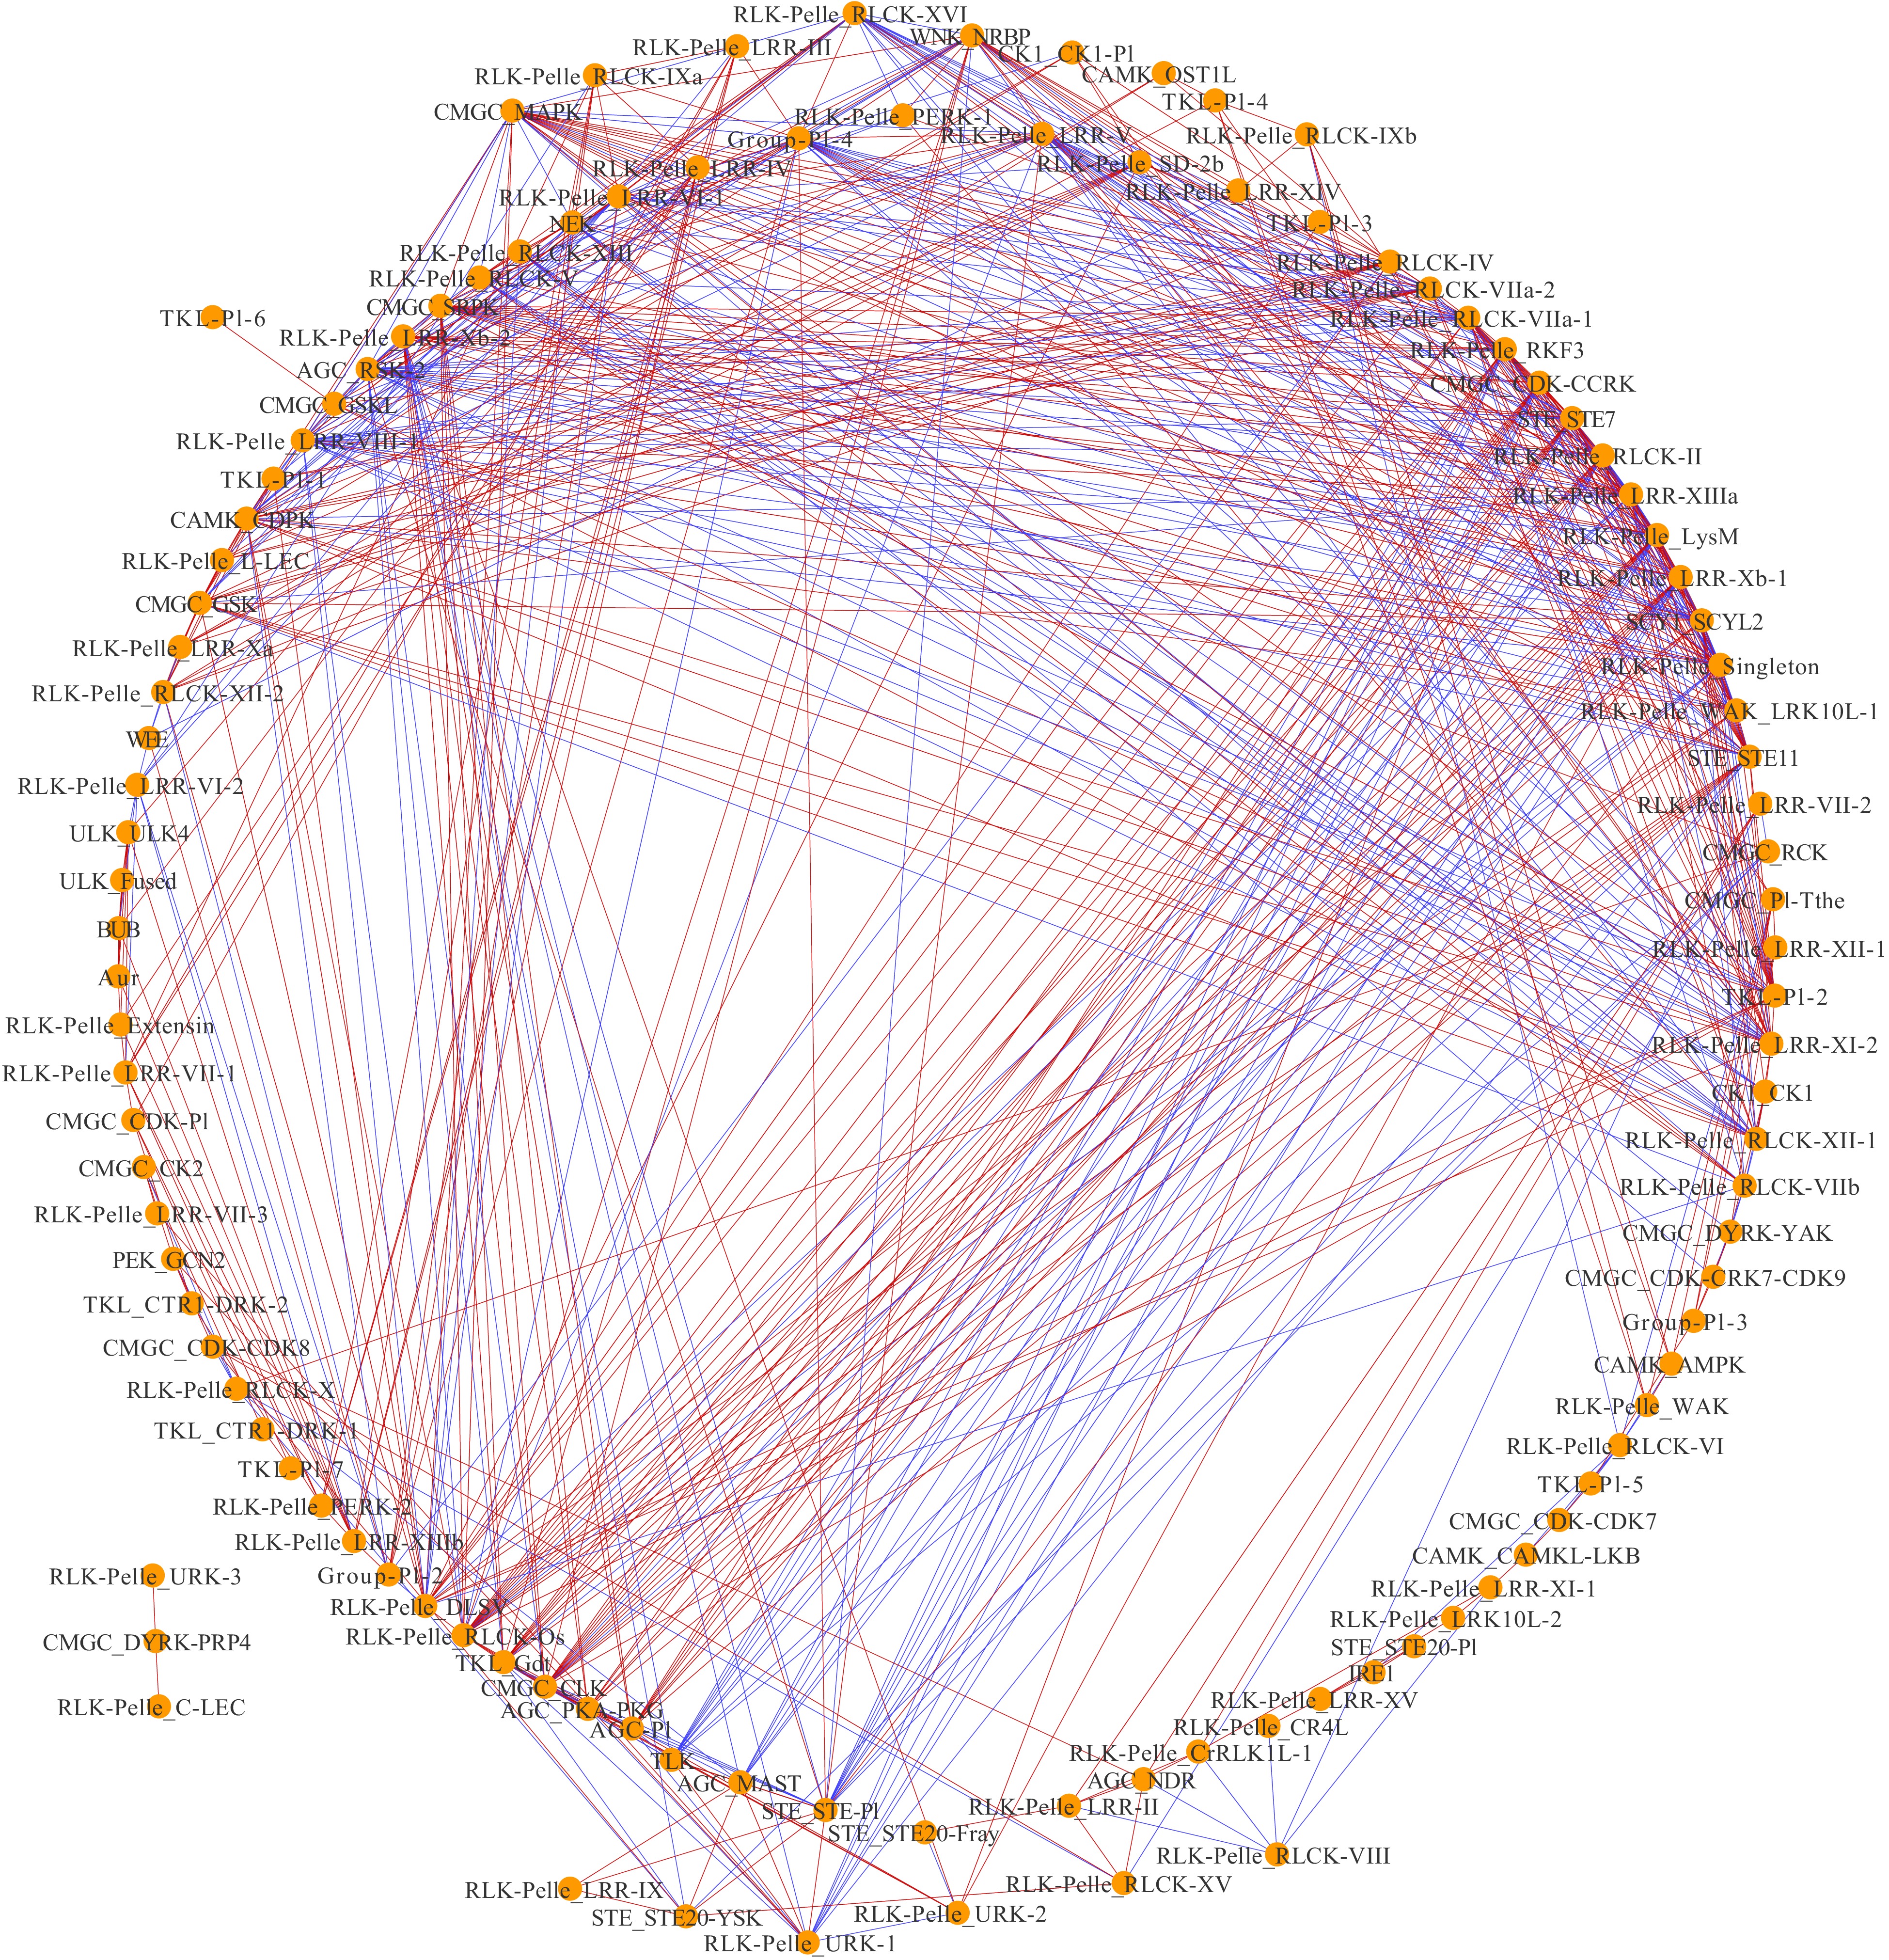
Figure 6. Co-expression networks of pecan PK subfamilies in response to drought. Each node indicated pecan PK subfamilies, and the edges indicated significant co-expression between subfamilies with a PCC of at least 0.9 (p < 0.01). Blue-colored edges indicate negative correlations, and red-colored edges indicate positive correlations.
-
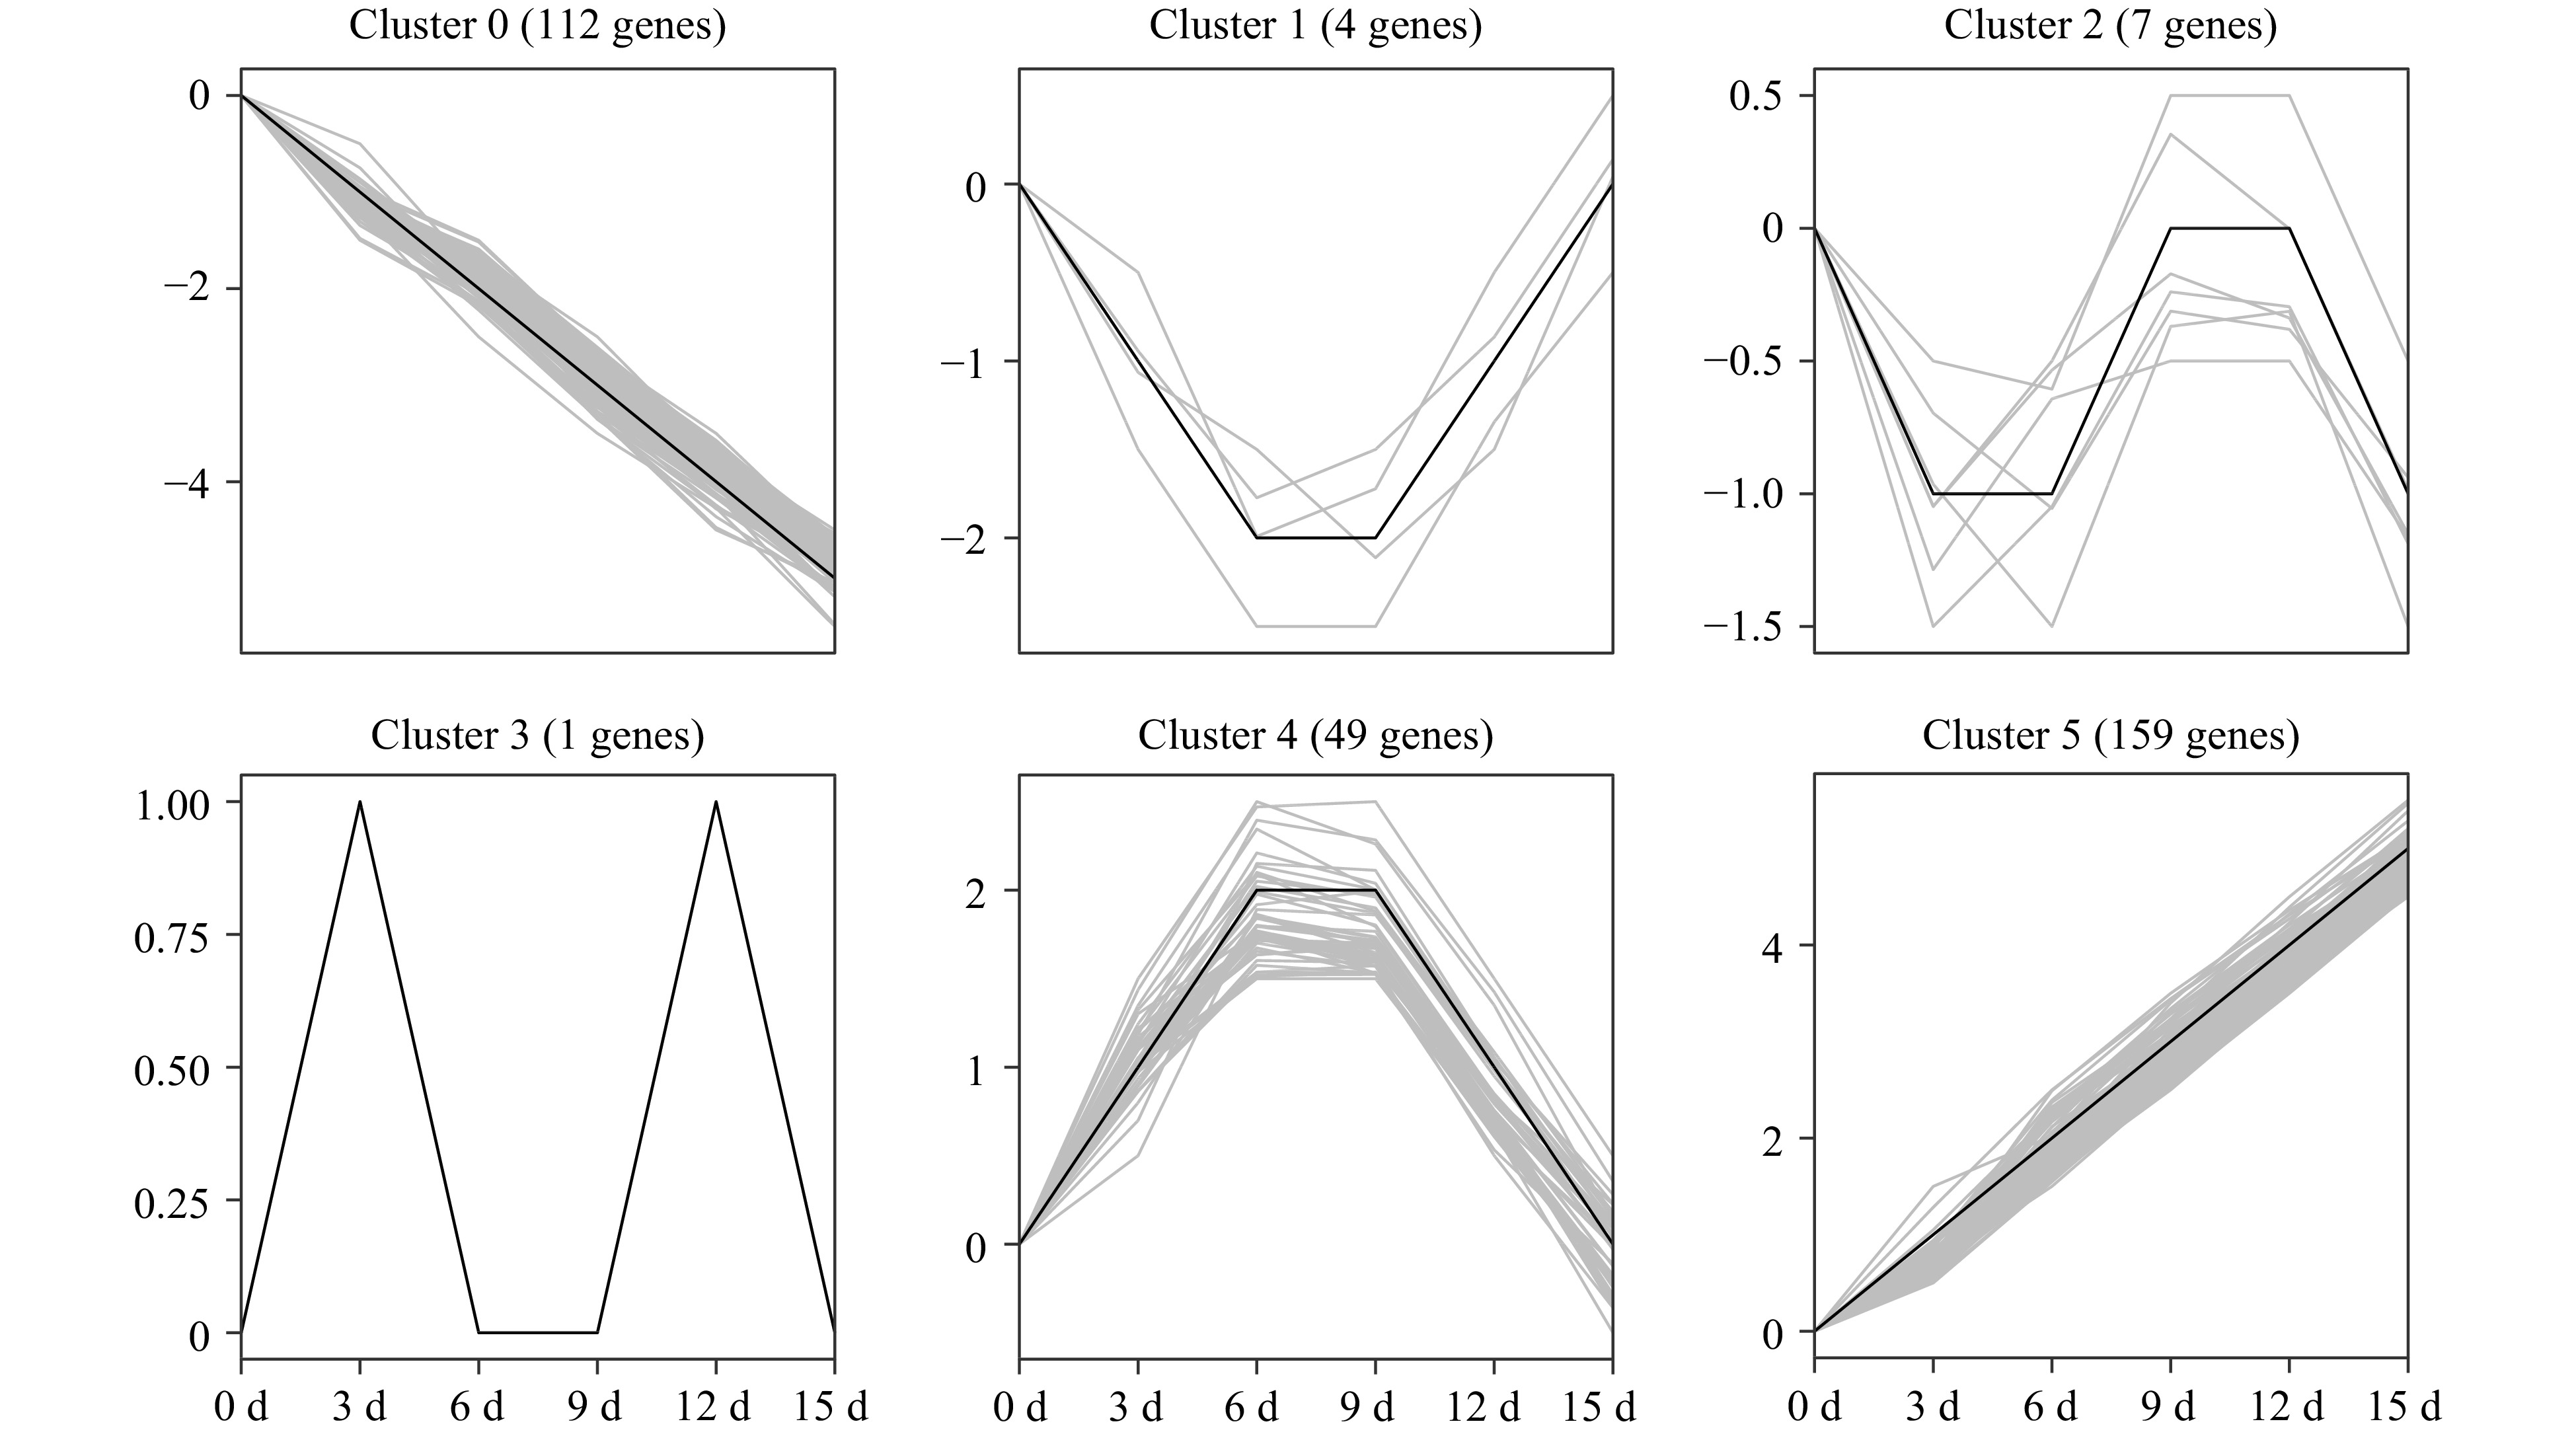
Figure 7. Temporal changes of differentially expressed PK genes under drought stress in pecan. One-year-old grafted 'Pawnee' trees were subjected to drought by withholding water for 0, 3, 6, 9, 12, and 15 d. Leaf samples were collected and used for RNA-Seq experiments. Expression data of 332 DEGs were retrieved and clustered into six clusters. The PK genes of each cluster are also listed in Supplemental Table S10.
Figures
(7)
Tables
(0)