-
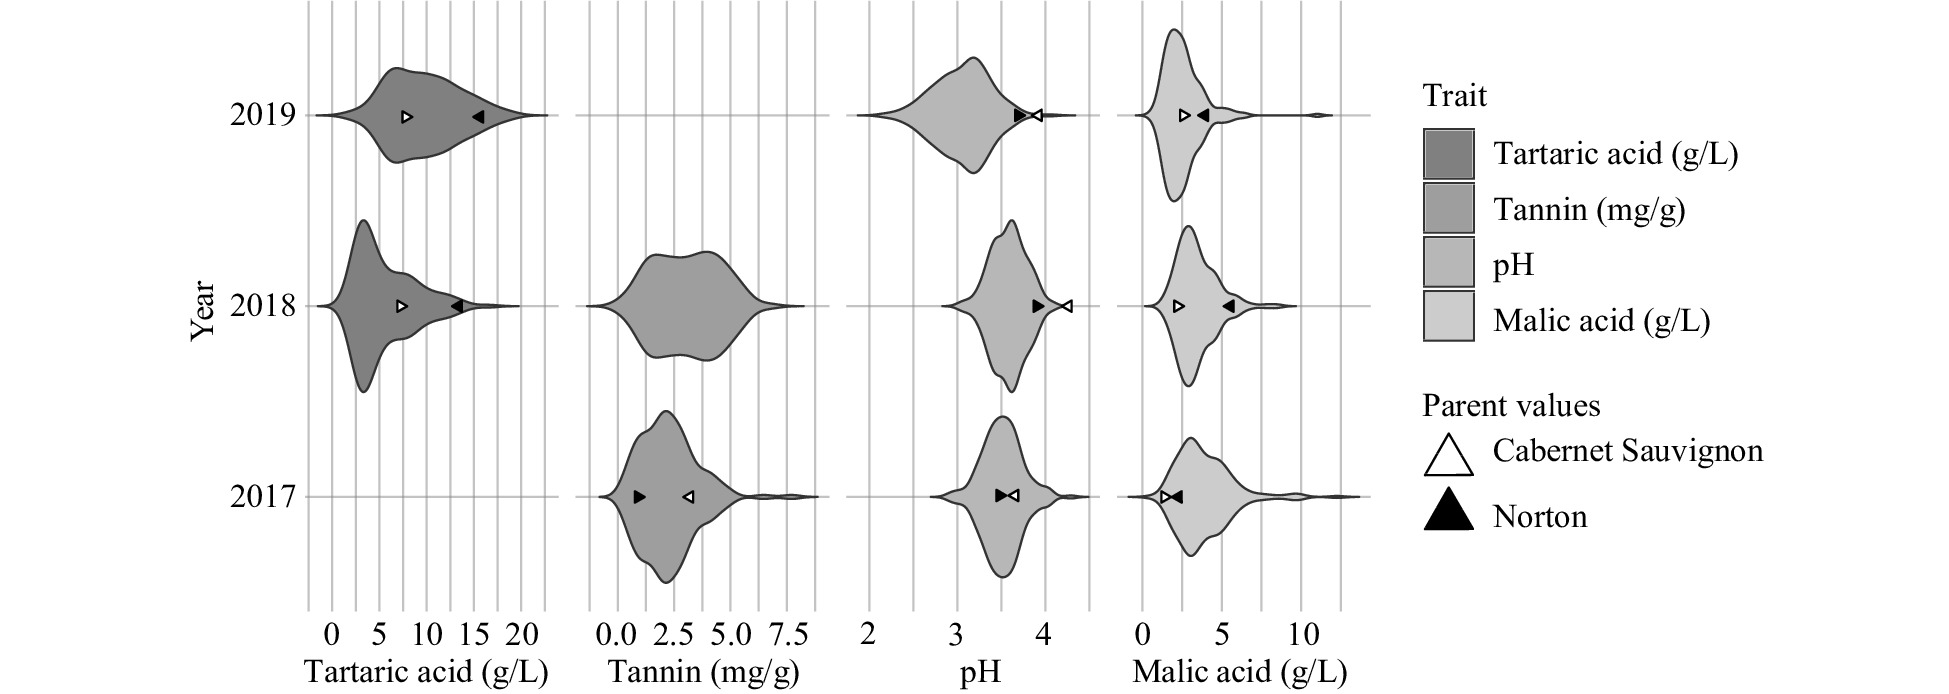
Figure 1. Frequency distribution (violin plot) of berry quality traits by year.
-
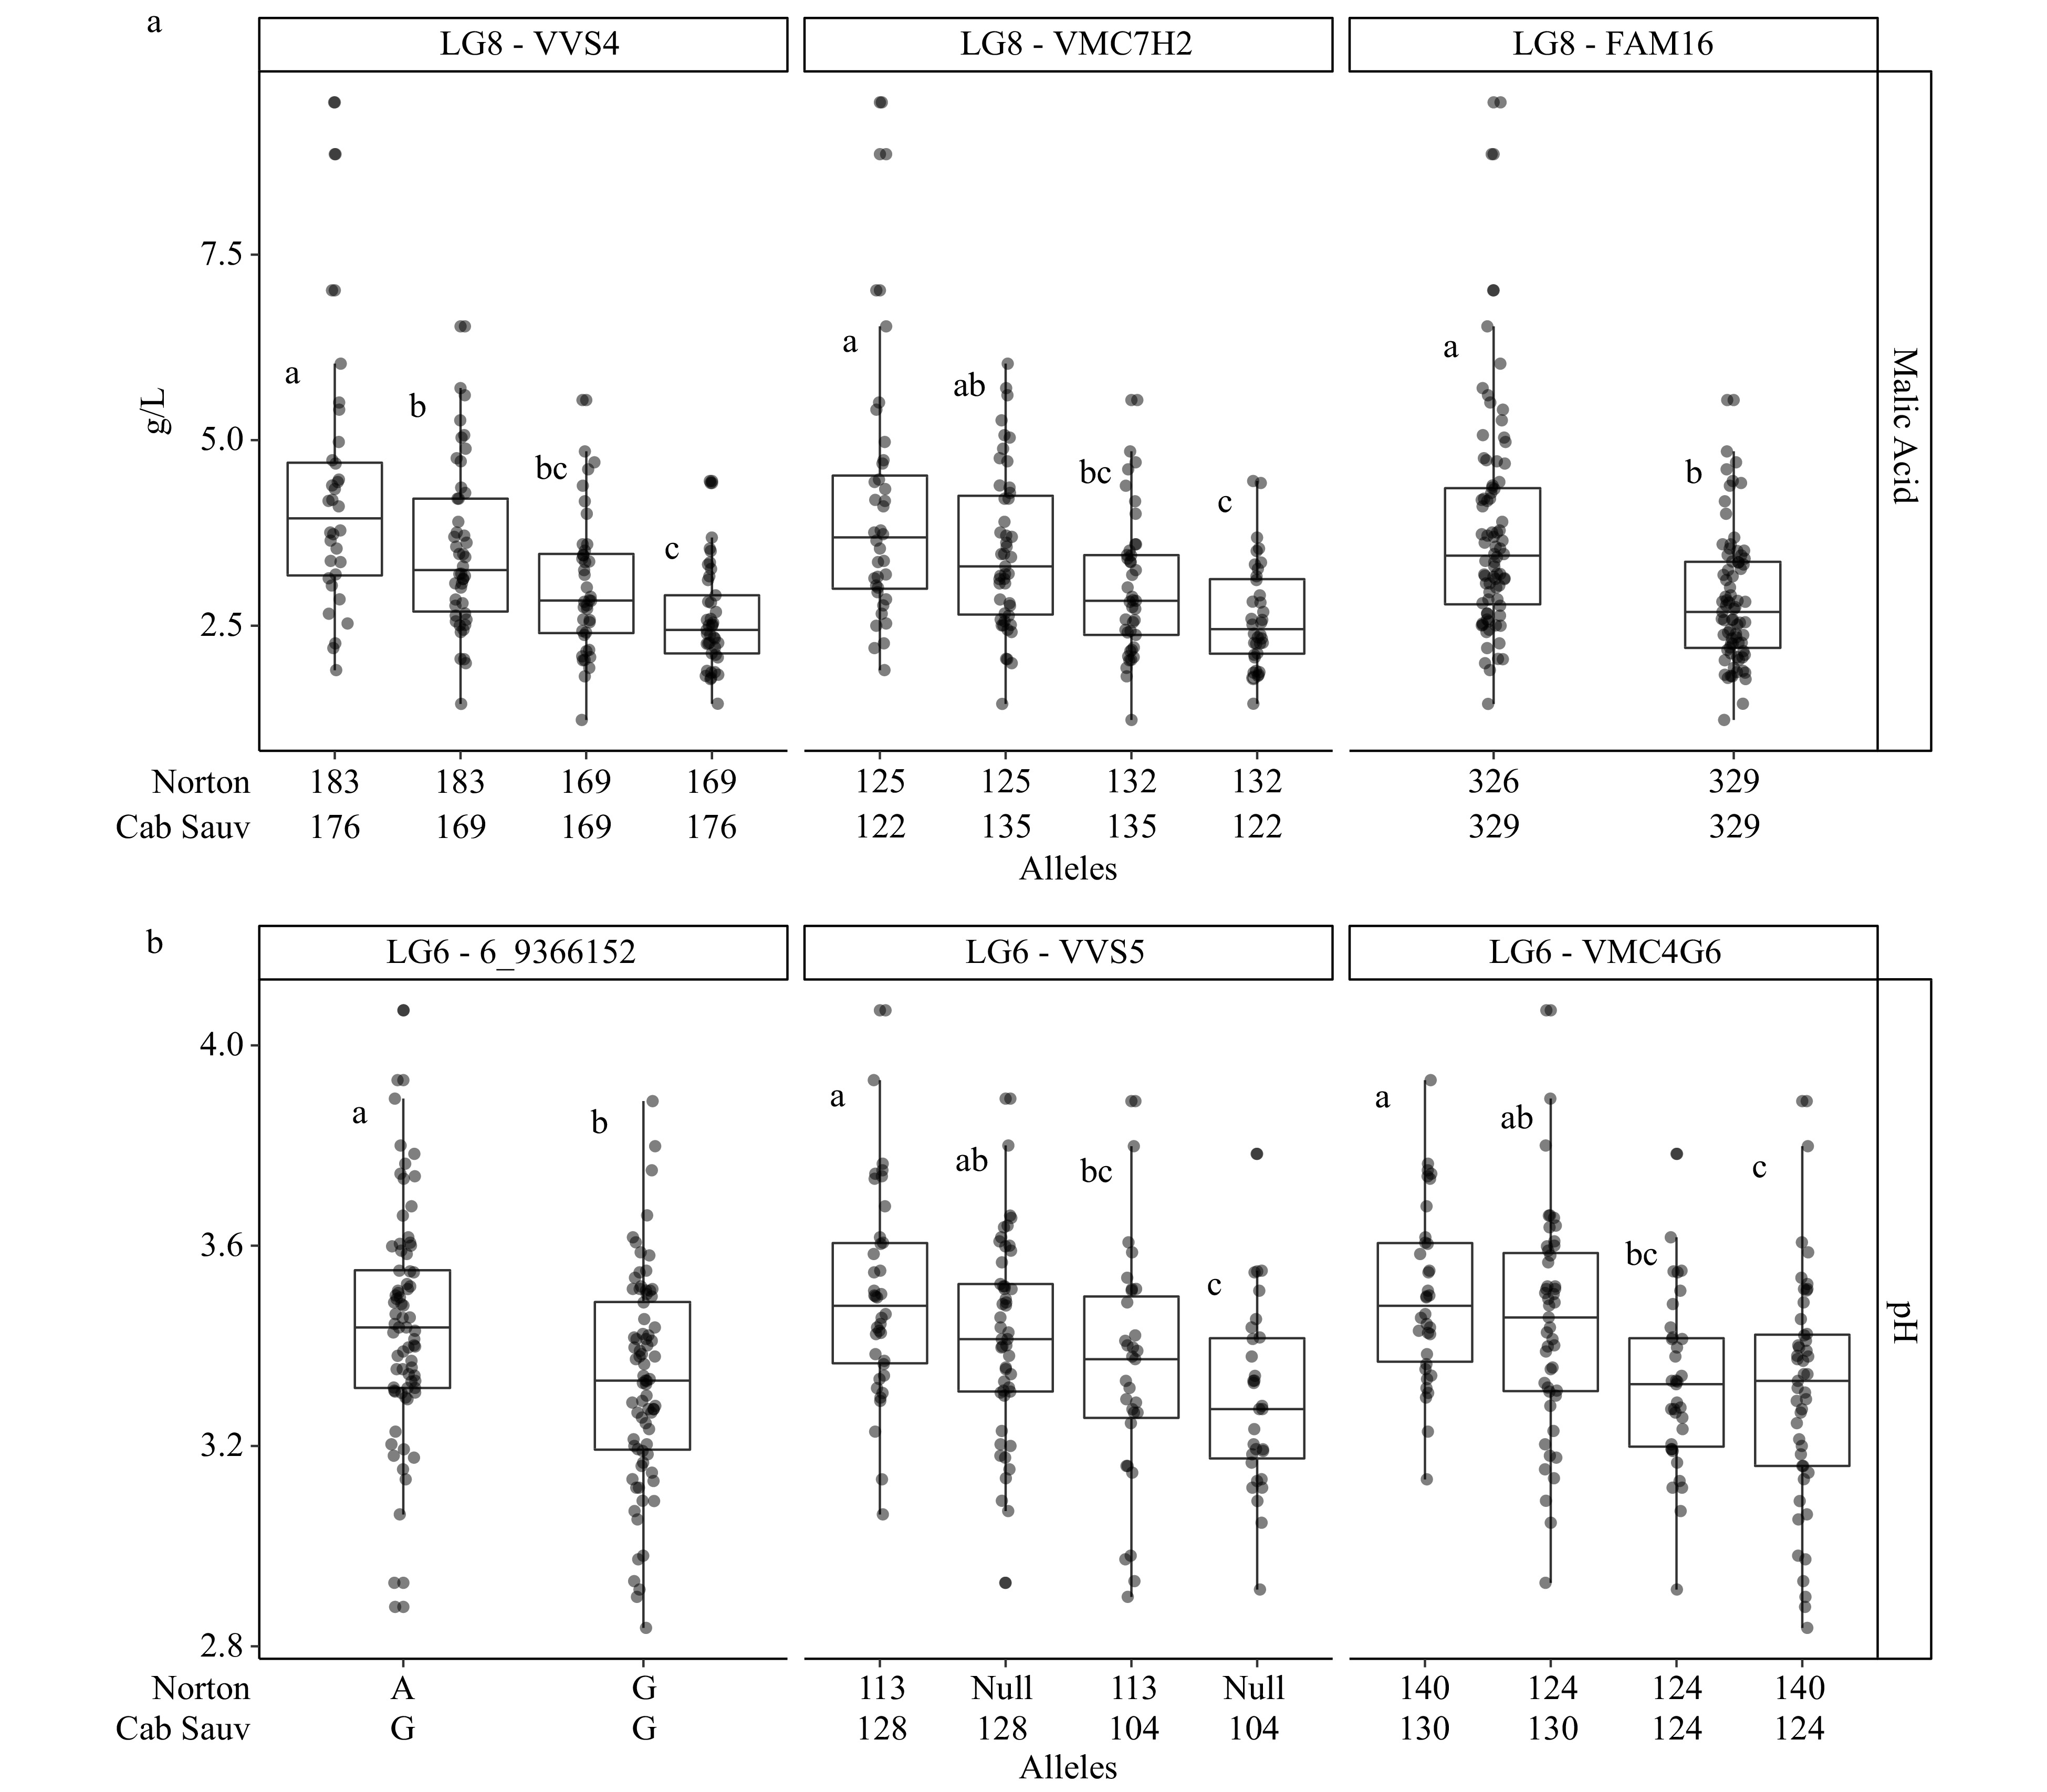
Figure 2. Phenotypes as BLUP values for (a) malic acid and (b) pH assorted by alleles from markers associated with stable QTLs on LG 8 and 6. Statistical significance as determined by Tukey's HSD test (p < 0.05) has been designated with different letters.
-
LG No. of markers Inter-marker distances (cM) Length
(cM)Total SSR SNP Average Maximum 1 149 29 120 0.72 3.4 80.3 2 109 15 94 0.78 3.4 69.1 3 89 13 76 0.86 6.8 63.7 4 154 29 125 0.72 4.5 79.0 5 121 21 100 0.71 4.3 70.4 6 164 17 147 0.67 3.8 78.7 7 170 27 143 0.69 3.6 95.8 8 167 24 143 0.66 3.8 84.8 9 99 14 85 0.85 3.4 70.7 10 99 14 85 0.75 3.6 64.2 11 110 21 89 0.79 5.9 71.4 12 122 14 108 0.72 3.8 66.0 13 145 13 132 0.70 3.1 87.7 14 171 45 126 0.62 3.8 87.0 15 81 8 73 0.96 8.4 63.6 16 114 17 97 0.82 4.3 74.3 17 125 13 112 0.72 2.7 75.1 18 167 36 131 0.72 5.4 94.5 19 112 14 98 0.76 3.4 65.9 Total 2,468 384 2,084 0.75 8.4 1,441.9 Table 1. Marker distributions of the 'Norton' × 'Cabernet Sauvignon' consensus genetic map.
-
Trait Year N1 Mean H2 (2) Minimum Median Maximum Tartaric acid (g/L) 18 138 5.5 0.24 1.7 4.4 16.6 19 183 9.7 1.9 9.3 19.2 Tannin (mg/g3) 17 131 2.3 0.46 0.36 2.1 7.7 18 175 3.1 0.07 3.2 6.8 pH 17 179 3.5 0.32 2.9 3.5 4.3 18 143 3.6 3.0 3.6 4.1 19 186 3.1 2.2 3.1 4.0 Malic acid (g/L) 17 178 3.9 0.70 0.52 3.5 12.3 18 138 3.4 1.3 3.2 8.5 19 185 2.5 0.50 2.3 11.0 1 N: Number of individuals, (2) H2: Broad sense heritability, 3 epicatechin equivalents Table 2. Summary statistics and broad-sense heritability values for evaluated traits.
-
pH Malic acid Tannin Tartaric acid 2017 2018 2017 2018 2017 2018 2018 0.54 ***1 0.66 *** 0.13 ns 2019 0.52 *** 0.67 *** 0.50 *** 0.66 *** 0.23 * 1 ***: p < 0.001, *: p < 0.05, ns: not significant Table 3. Pearson correlation coefficients between years of trait evaluation.
-
Trait LG Year Max LOD GW LOD threshold PVE Peak (cM) 1.5-LOD interval (cM) Physical interval (bp) Tartaric acid 1 2019 7.0 5.2 12.3 43.0 41.5−44.6 8335044−9738524 6 2019 5.2 5.2 8.8 39.1 30.6−41.5 6679935−7615750 7 2019 6.9 5.2 12.1 36.7 35.8−37.3 8215450−9475359 9 2018 7.0 5.9 14.1 5.2 5.0−6.1 198079−460535 17 2018 7.1 5.9 14.3 56.8 56.4−56.8 9295617−10144592 Tannin 2 2018 5.8 5.5 24.7 54.6 36.5−54.6 6360230−15748193 pH 4 2019 9.0 5.3 21.6 53.4 51.8−56.4 16450987−18940320 6 2017 5.1 5.1 16.2 2.8 2.8−43.9 141387−11607560 2018 7.0 5.4 19.2 46.0 44.0−46.0 14849083−15724160 2019 6.6 5.3 20.2 49.4 43.4−54.0 8139288−16573962 8 2018 5.9 5.4 13.0 32.8 32.0−33.2 8553958−10498296 Malic acid 8 2017 9.0 5.2 19.6 30.5 30.2−36.0 9992297−11975066 2018 7.3 5.3 20.1 32.8 14.0−39.6 2400696−11975066 2019 7.6 5.1 13.4 31.2 30.6−31.2 9992297−10385236 14 2019 6.8 5.1 13.7 7.9 6.4−8.2 1426689−1955725 18 2019 5.9 5.1 9.5 21.2 21.2−21.8 4020114−4997180 Table 4. Summary of QTLs for wine grape juice components in 'Norton' × 'Cabernet Sauvignon' F1 population.
-
Trait LG Marker Allele Effect size Parental genotype Physical position (bp) 'Norton' 'Cab Sauv' Tartaric acid 1 1_8118509 T 1.5 *1 AT AA 8118509 VVIP60 332 −2.4 *** 310/332 307/315 8803413 VMC7g5 167 2.3 *** 157/167 171/186 9804330 6 VMC2G2 131 −1.3 * 128 127/131 5819478 6_6679935 A −1.6 ** GG AG 6679935 VMC2F10 105 1.5 * 95/114 95/105 7615750 7 ctg9481 403 −0.40 ns 394/397 394/403 7446186 VMC1A2 149 0.52 ns 108/217 108/149 8230151 7_16971155 A −1.2 − GG AG 16971155 9 9_240934 T −0.30 ns GT GG 240934 FAM26 301 1.0 − 295/301 295/303 461325 17 17_9295617 C 0.62 ns CT TT 9295617 17_9884306 C 1.7 ** AC AA 9884306 17_10144592 C −1.1 − AC AA 10144592 Tannin 2 VVIO55 148 −0.81 *** 144 144/148 5523290 2_6360230 C 0.81 ** CT TT 6360230 FAM24 266 0.84 *** 266/270 270/277 13396269 FAM24 277 0.77 *** 266/270 270/277 13396269 VMC8C2 196 0.80 *** 148/196 148/150 17514943 VMC8C2 150 0.80 *** 148/196 148/150 17514943 pH 4 VVIN75 194 0.20 *** 196/212 188/194 14823485 VMC2E10 59 0.25 *** 53/55 57/59 17456655 VVIP77 191 0.21 *** 180/186 186/191 19317923 62 6_9366152 A 0.09 ** GG AG 9366152 6_12192456 T −0.11 *** CC CT 12192456 VVS5 128 0.10 *** 113/NULL 104/128 12956677 6_13625084 C 0.14 *** GG CG 13625084 6_14347587 T 0.12 *** CC CT 14347587 VMC4G6 130 0.12 *** 124/140 124/130 15179752 8 8_7718022 T 0.03 ns CC CT 7718022 VMC7H2 135 0.07 − 125/132 122/135 10149243 8_10699999 T −0.03 ns CC CT 10699999 Malic acid 82 VVS4 183 0.74 *** 169/183 169/176 9992297 VMC7H2 125 0.68 *** 125/132 122/135 10149243 8_10159975 T 0.69 *** CT CC 10159975 8_10222803 G 0.53 ** AG AA 10222803 FAM16 326 0.67 *** 326/329 329/329 10384476 14 VVC62 204 0.65 ** 184/188 184/204 1426689 14_1714481 A 0.60 ** CC AC 1714481 14_2083206 A 0.51 * GG AG 2083206 18 18_4020114 T 0.42 * AT AA 4020114 18_4607745 G 0.54 * CG CC 4607745 VMCNg1b9 151 0.22 ns 151/160 160/160 5645610 1 ***: p < 0.001, **: p < 0.01, *: p < 0.05, −: p < 0.10, ns: not significant, 2 QTL effects were calculated using BLUP values in place of single year data. Table 5. Allele effects and parental genotypes of markers associated with berry acid and tannin QTL.
-
Year Marker type Population size Number of markers Map size (cM) Average distance between loci (cM) Number of gaps >10 cM 2017 SSR 183 413 1,678.6 4.1 26 2019 SSR, SNP 159 2,072 2,203.5 1.1 4 2020 SSR, SNP 223 2,468 1,441.9 0.75 0 Table 6. Comparison between the previously published and current genetic map constructed for the 'Norton' × 'Cabernet Sauvignon' F1 population
Figures
(2)
Tables
(6)