-
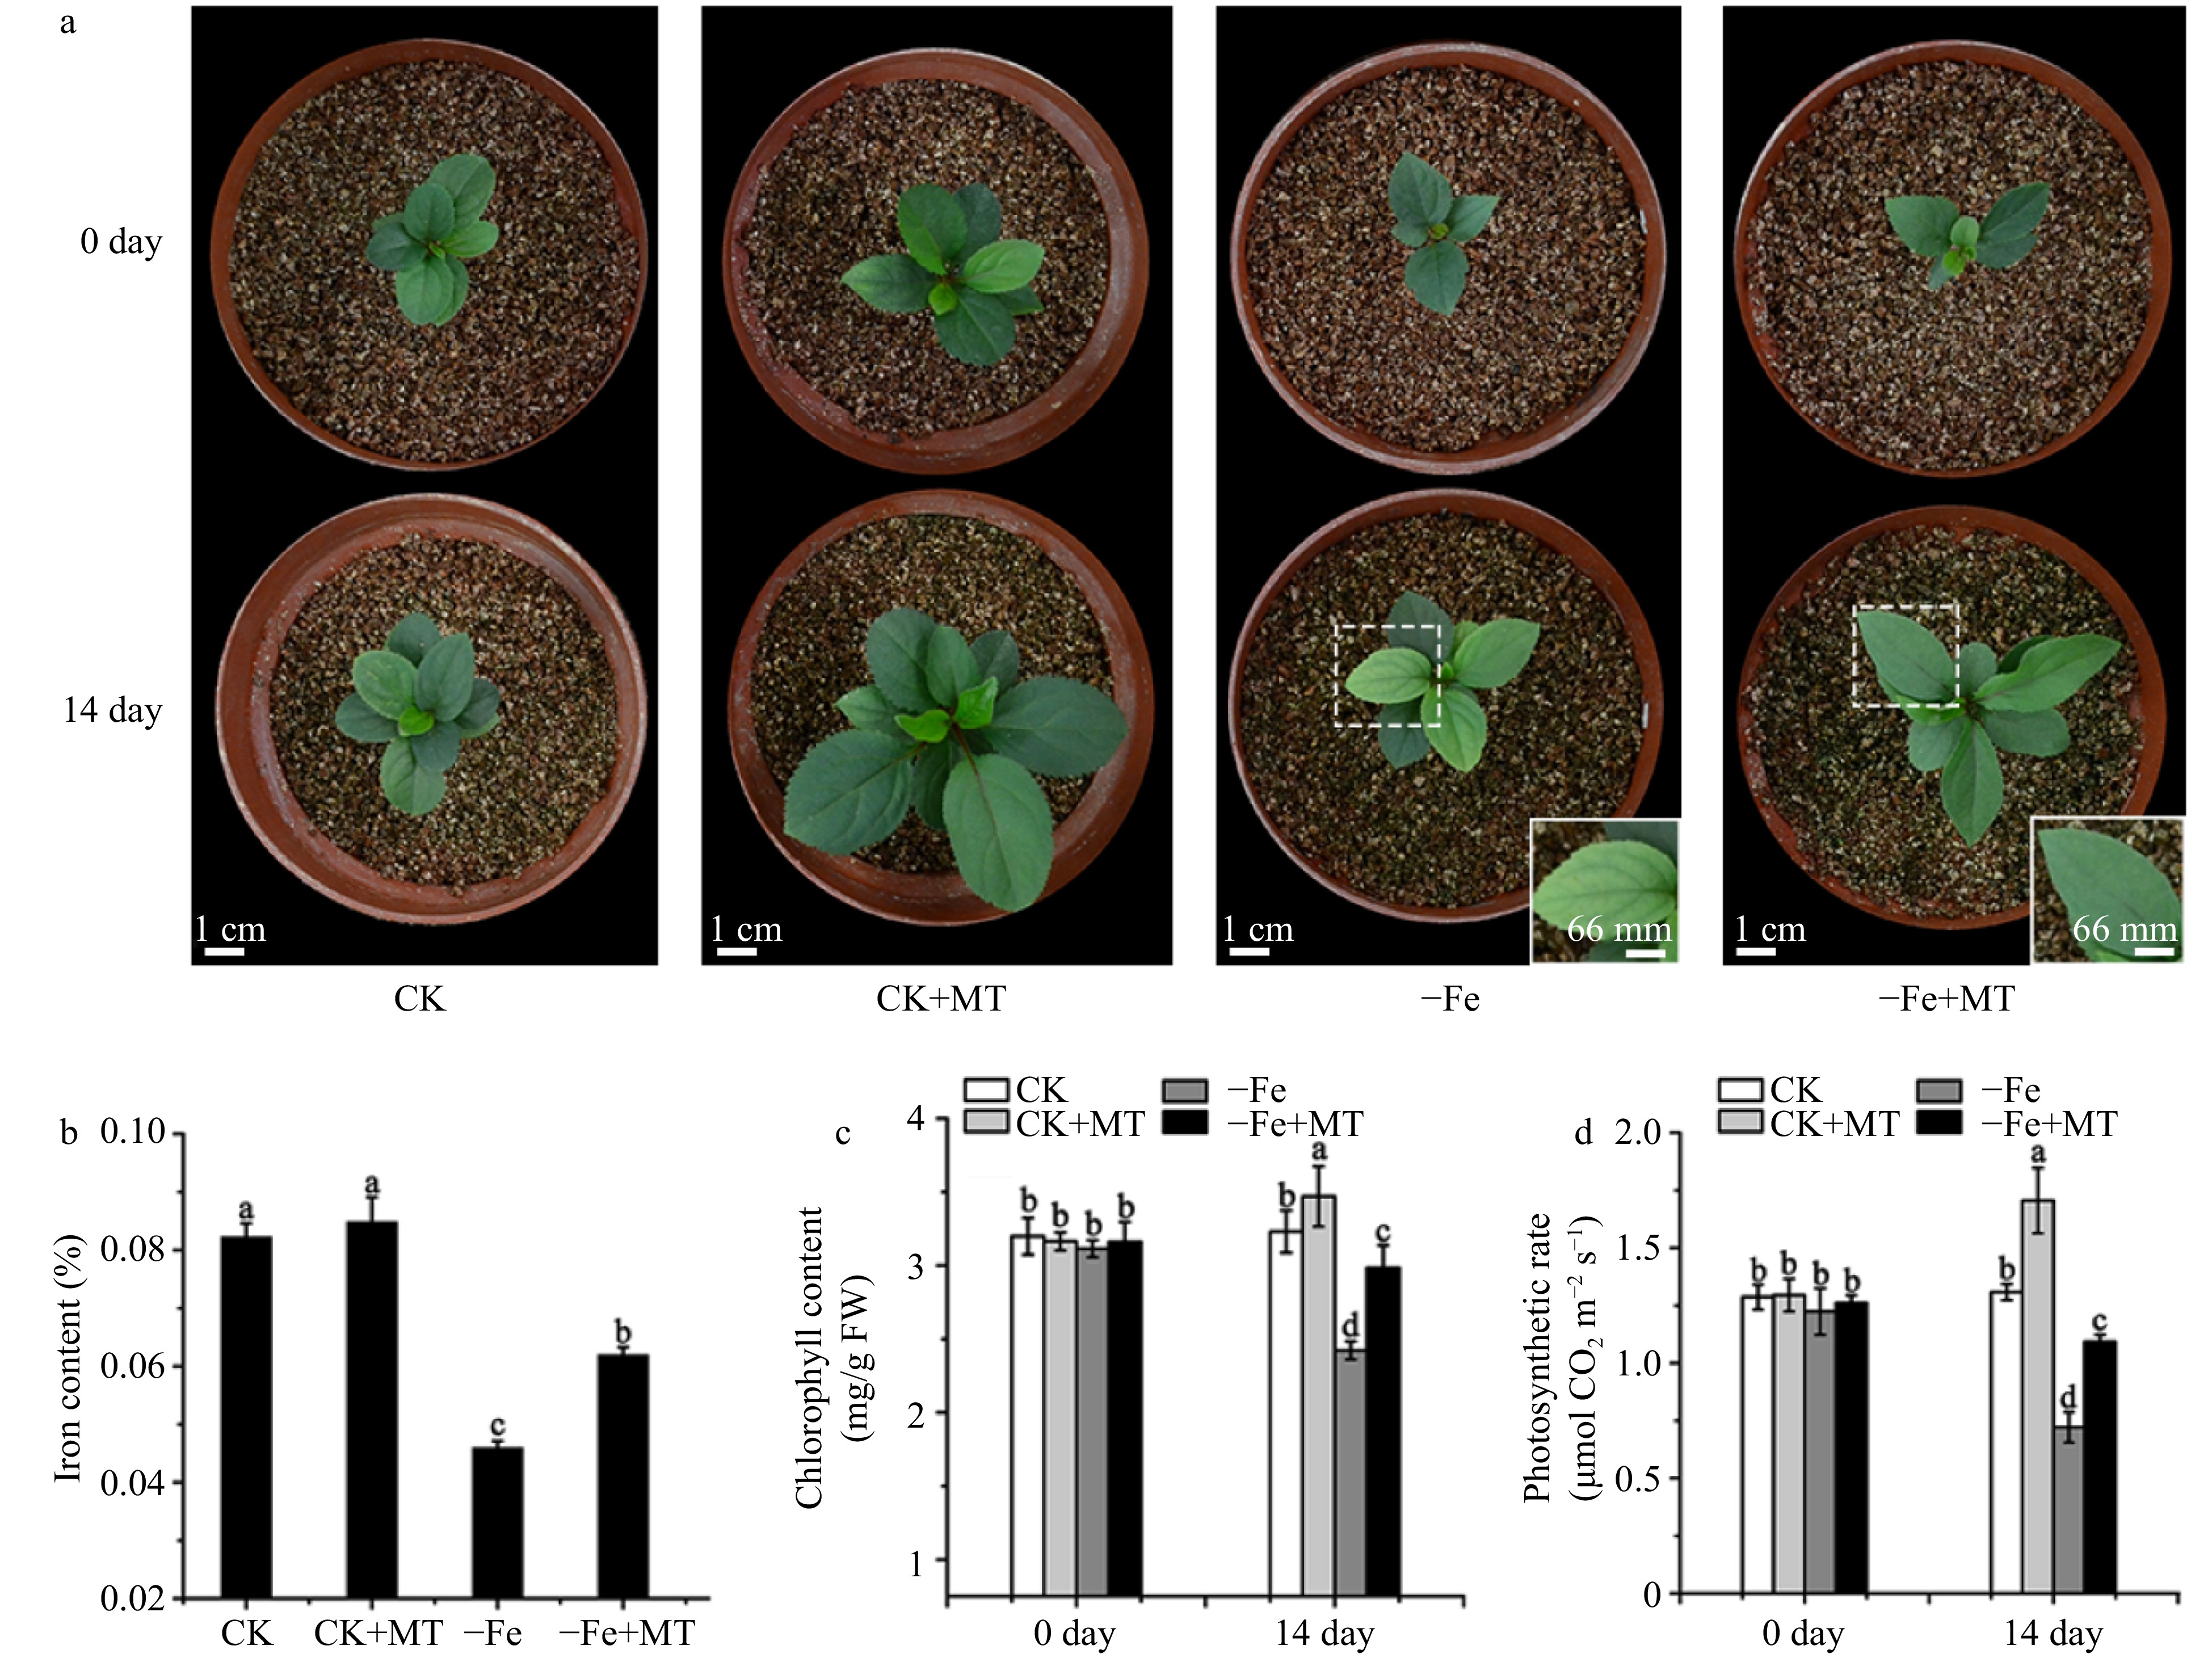
Figure 1. Phenotypes of M. baccata apple plants under Fe deficiency or normal growth conditions with and without melatonin. (a) The growth conditions of M. baccata plants at 0 and 14 d, respectively. Bar: 1 cm or 66 mm, respectively. (b) The Fe content in leaves under Fe deficiency for 14 d. (c) The chlorophyll content in leaves at 0 and 14 d, respectively. (d) The photosynthetic rate of M. baccata apple plants at 0 and 14 d, respectively. CK: plants under normal growth conditions (40 μM Fe); −Fe: plants under Fe deficient conditions (4 μM Fe); MT: melatonin. Data are means ± SD of three independent experiments. Lowercase letters: significant differences based on LSD multiple comparison (p < 0.05).
-
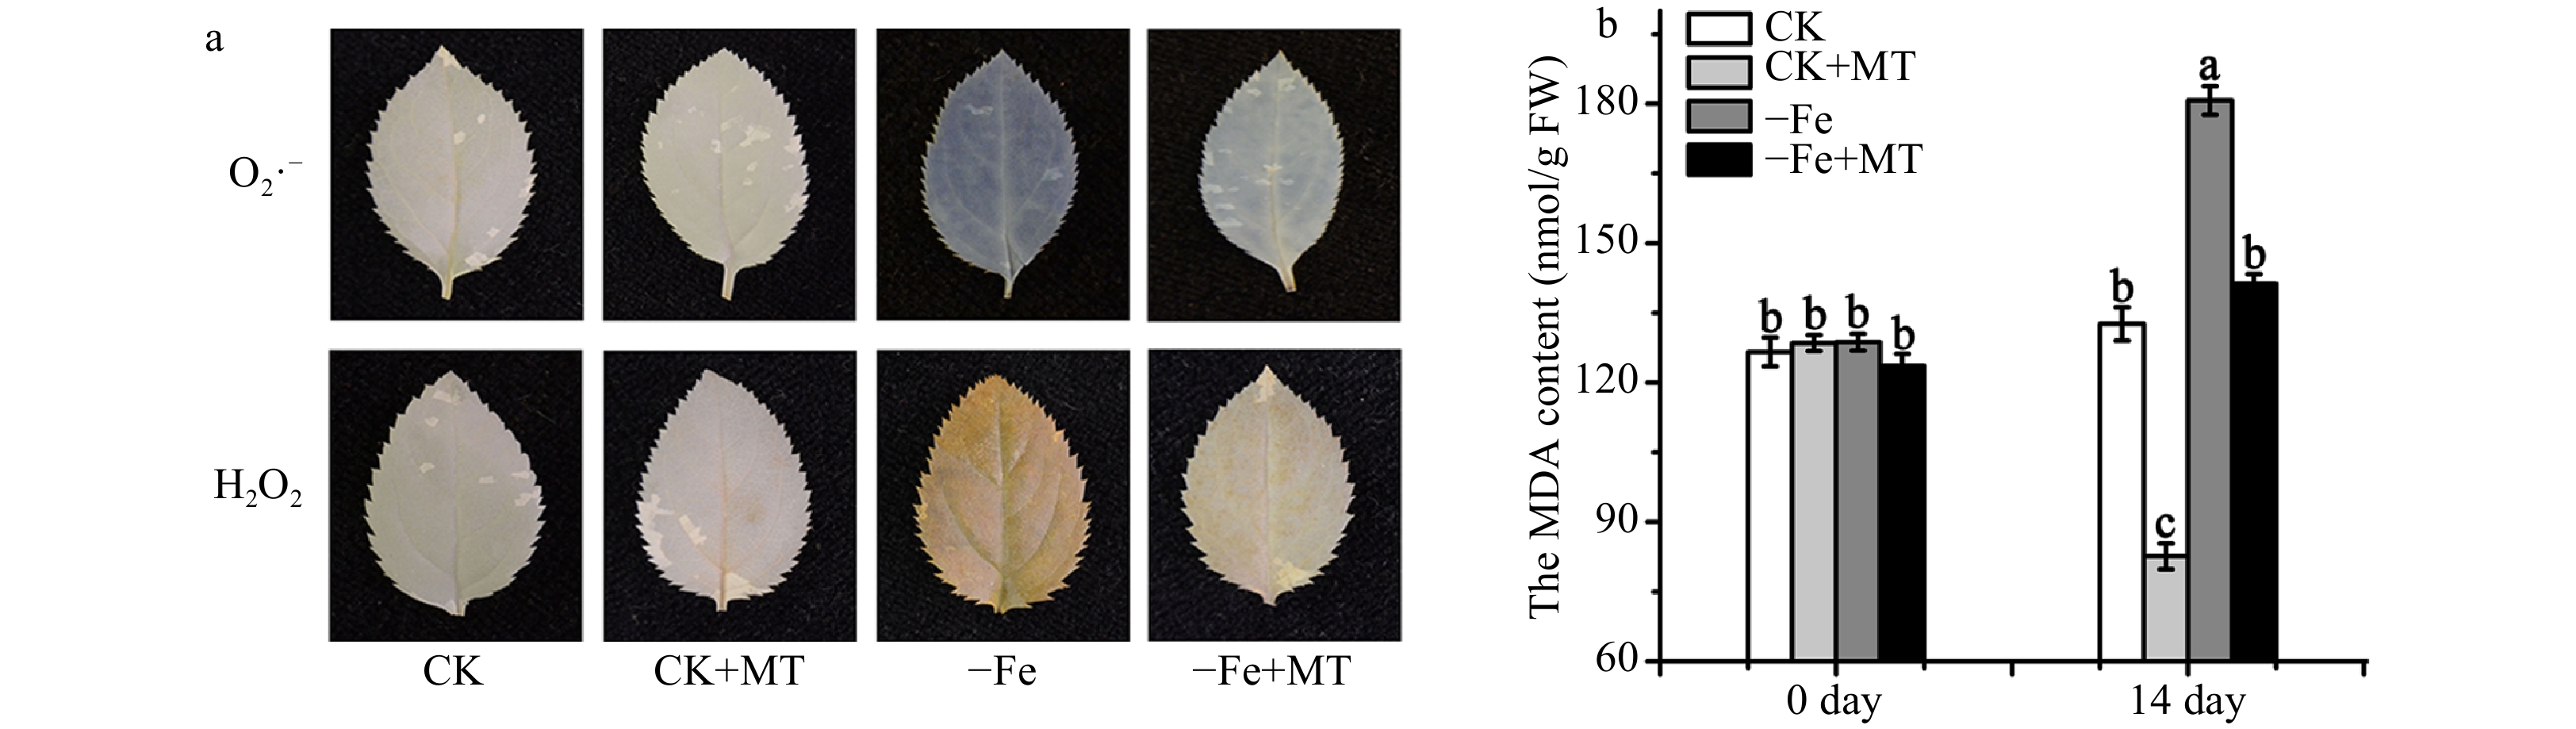
Figure 2. ROS and MDA level in M. baccata plants under Fe deficiency or normal growth conditions with and without melatonin. (a) The O2•− and H2O2 levels in leaves. (b) The MDA levels in leaves. CK: plants under normal growth conditions (40 μM Fe); −Fe: plants under Fe deficient conditions (4 μM Fe); MT: melatonin. Data are means ± SD of three independent experiments. Lowercase letters: significant differences based on LSD multiple comparison (p < 0.05).
-
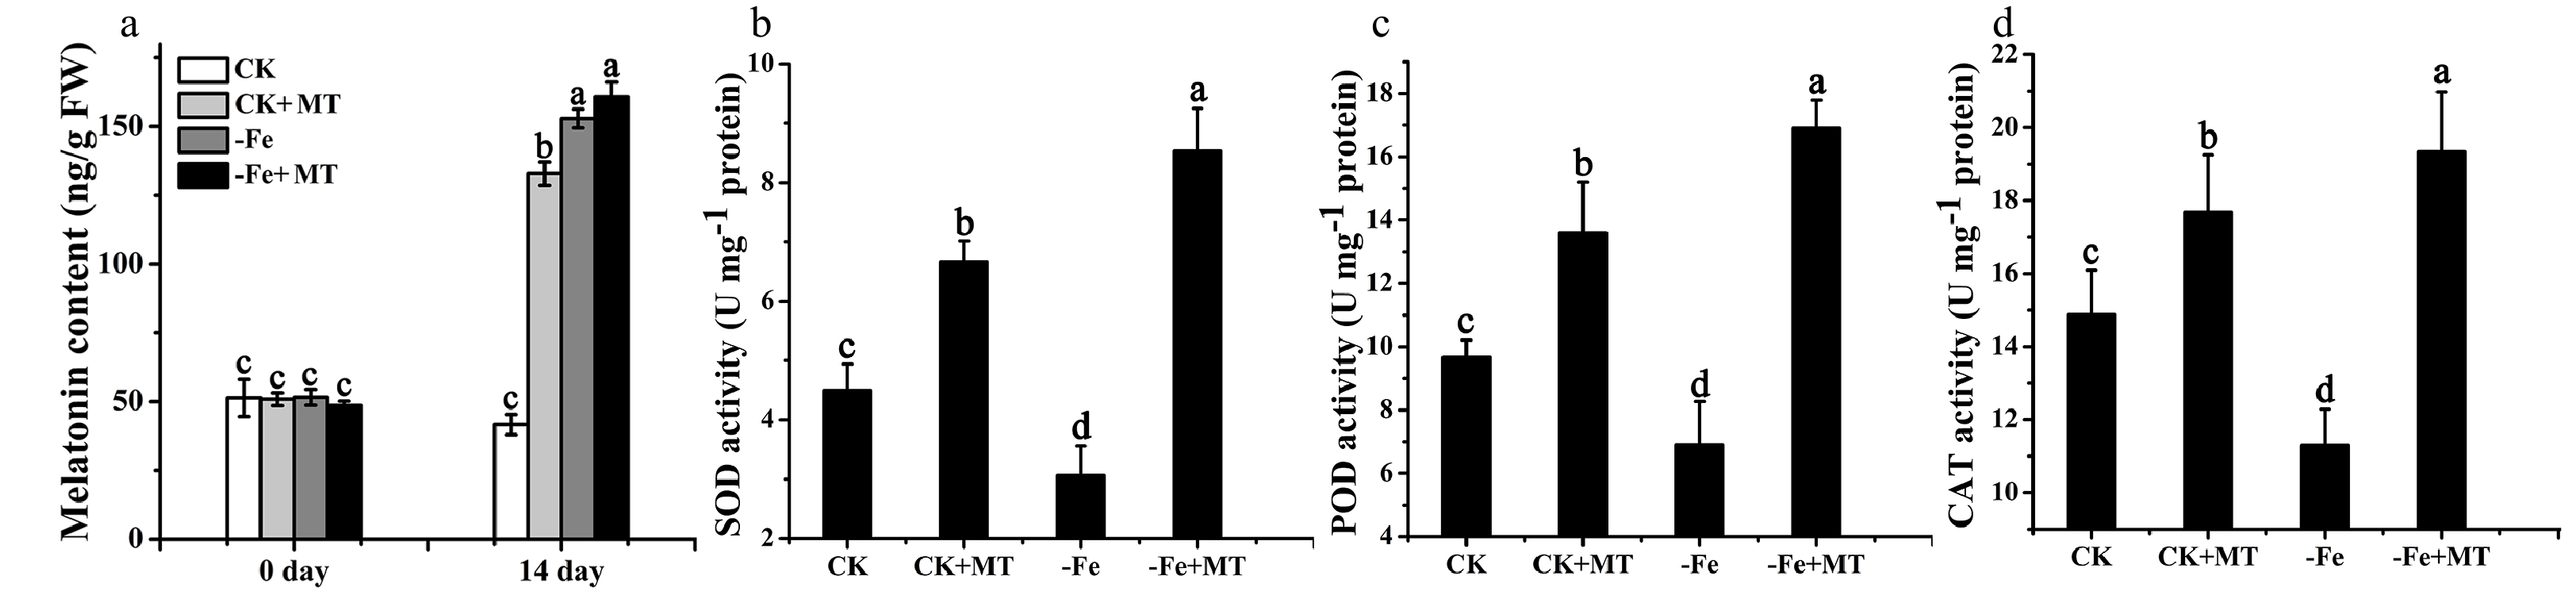
Figure 3. Melatonin content and activities of antioxidant enzymes in M. baccata plants under Fe deficiency or normal growth conditions, with and without melatonin. (a) Melatonin content of M. baccata plants detected by HPLC. The activities of SOD (b), POD (c) and CAT (d) in leaves. CK: plants under normal growth conditions (40 μM Fe); −Fe: plants under Fe deficiency conditions (4 μM Fe); MT: melatonin. Data are means ± SD of three independent experiments. Lowercase letters: significant differences based on LSD multiple comparison (p < 0.05).
-
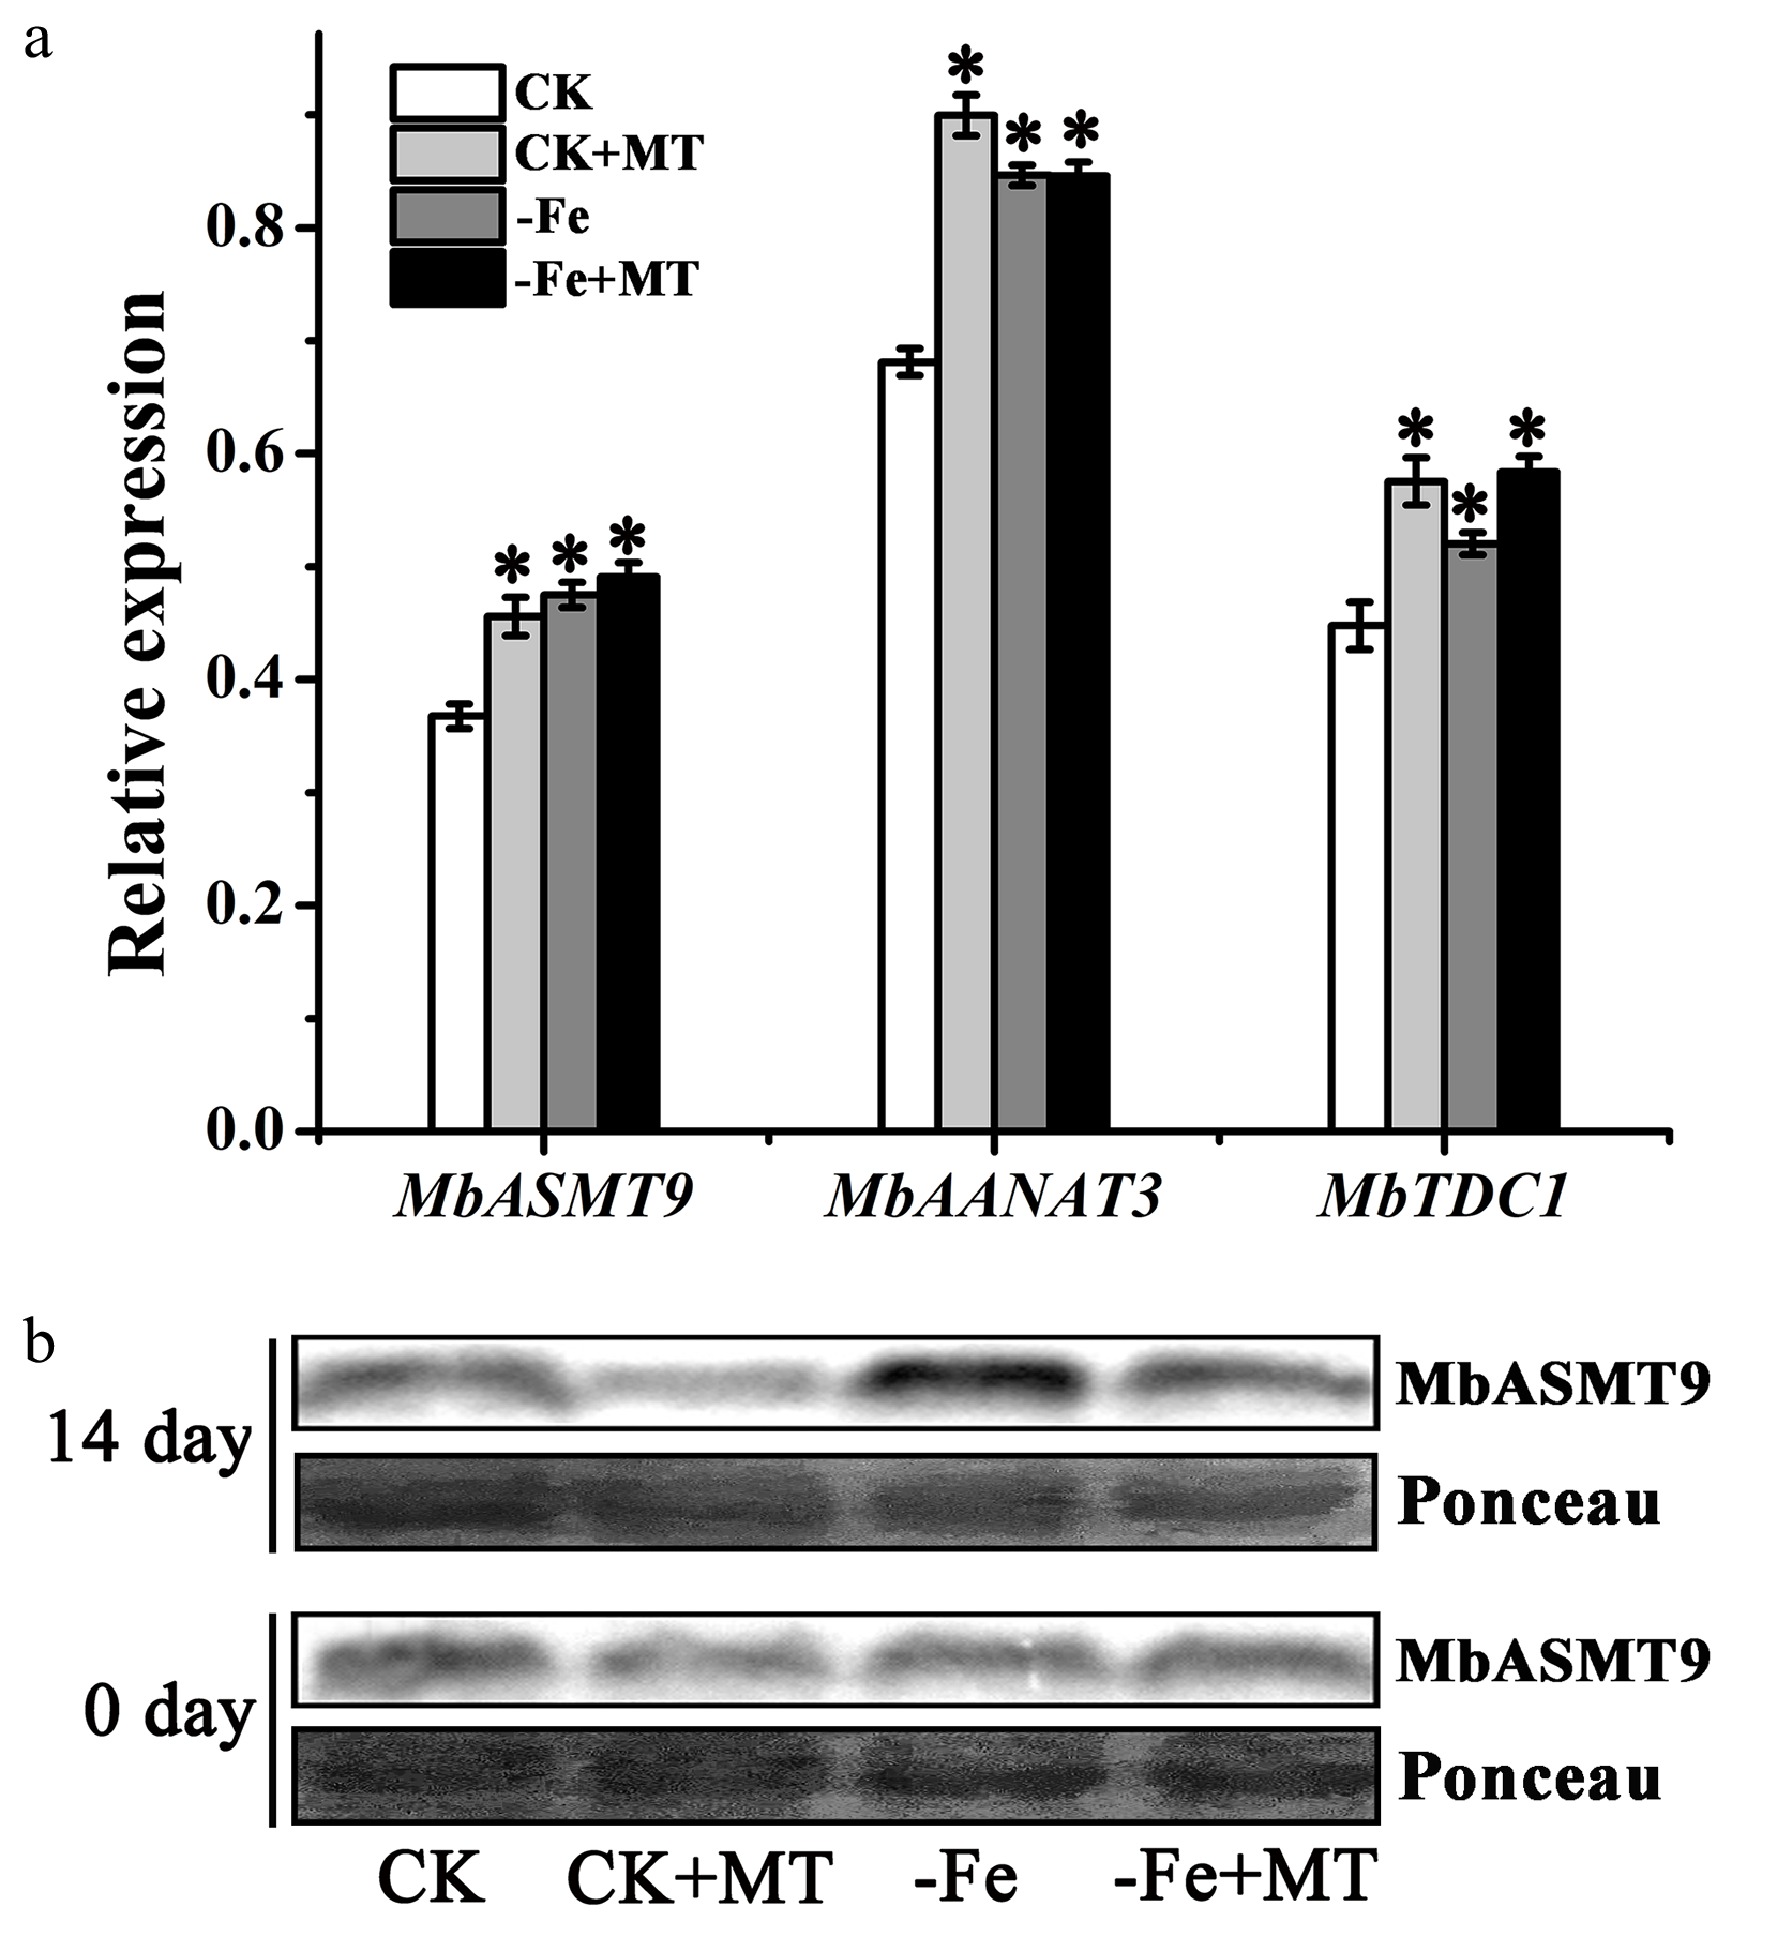
Figure 4. Expression of melatonin synthetase in M. baccata plants under Fe deficiency or normal growth conditions, with and without melatonin. (a) Relative expression of MbASMT9, MbAANAT3 and MbTDC1 genes detected by qPCR after 14 d. (b) Protein level of MbASMT9 detected by western blot. Ponceau stained bands indicated the quantity loading of total protein. Data are means ± SD of three separate experiments. * p < 0.05 (Student’s t-test).
-
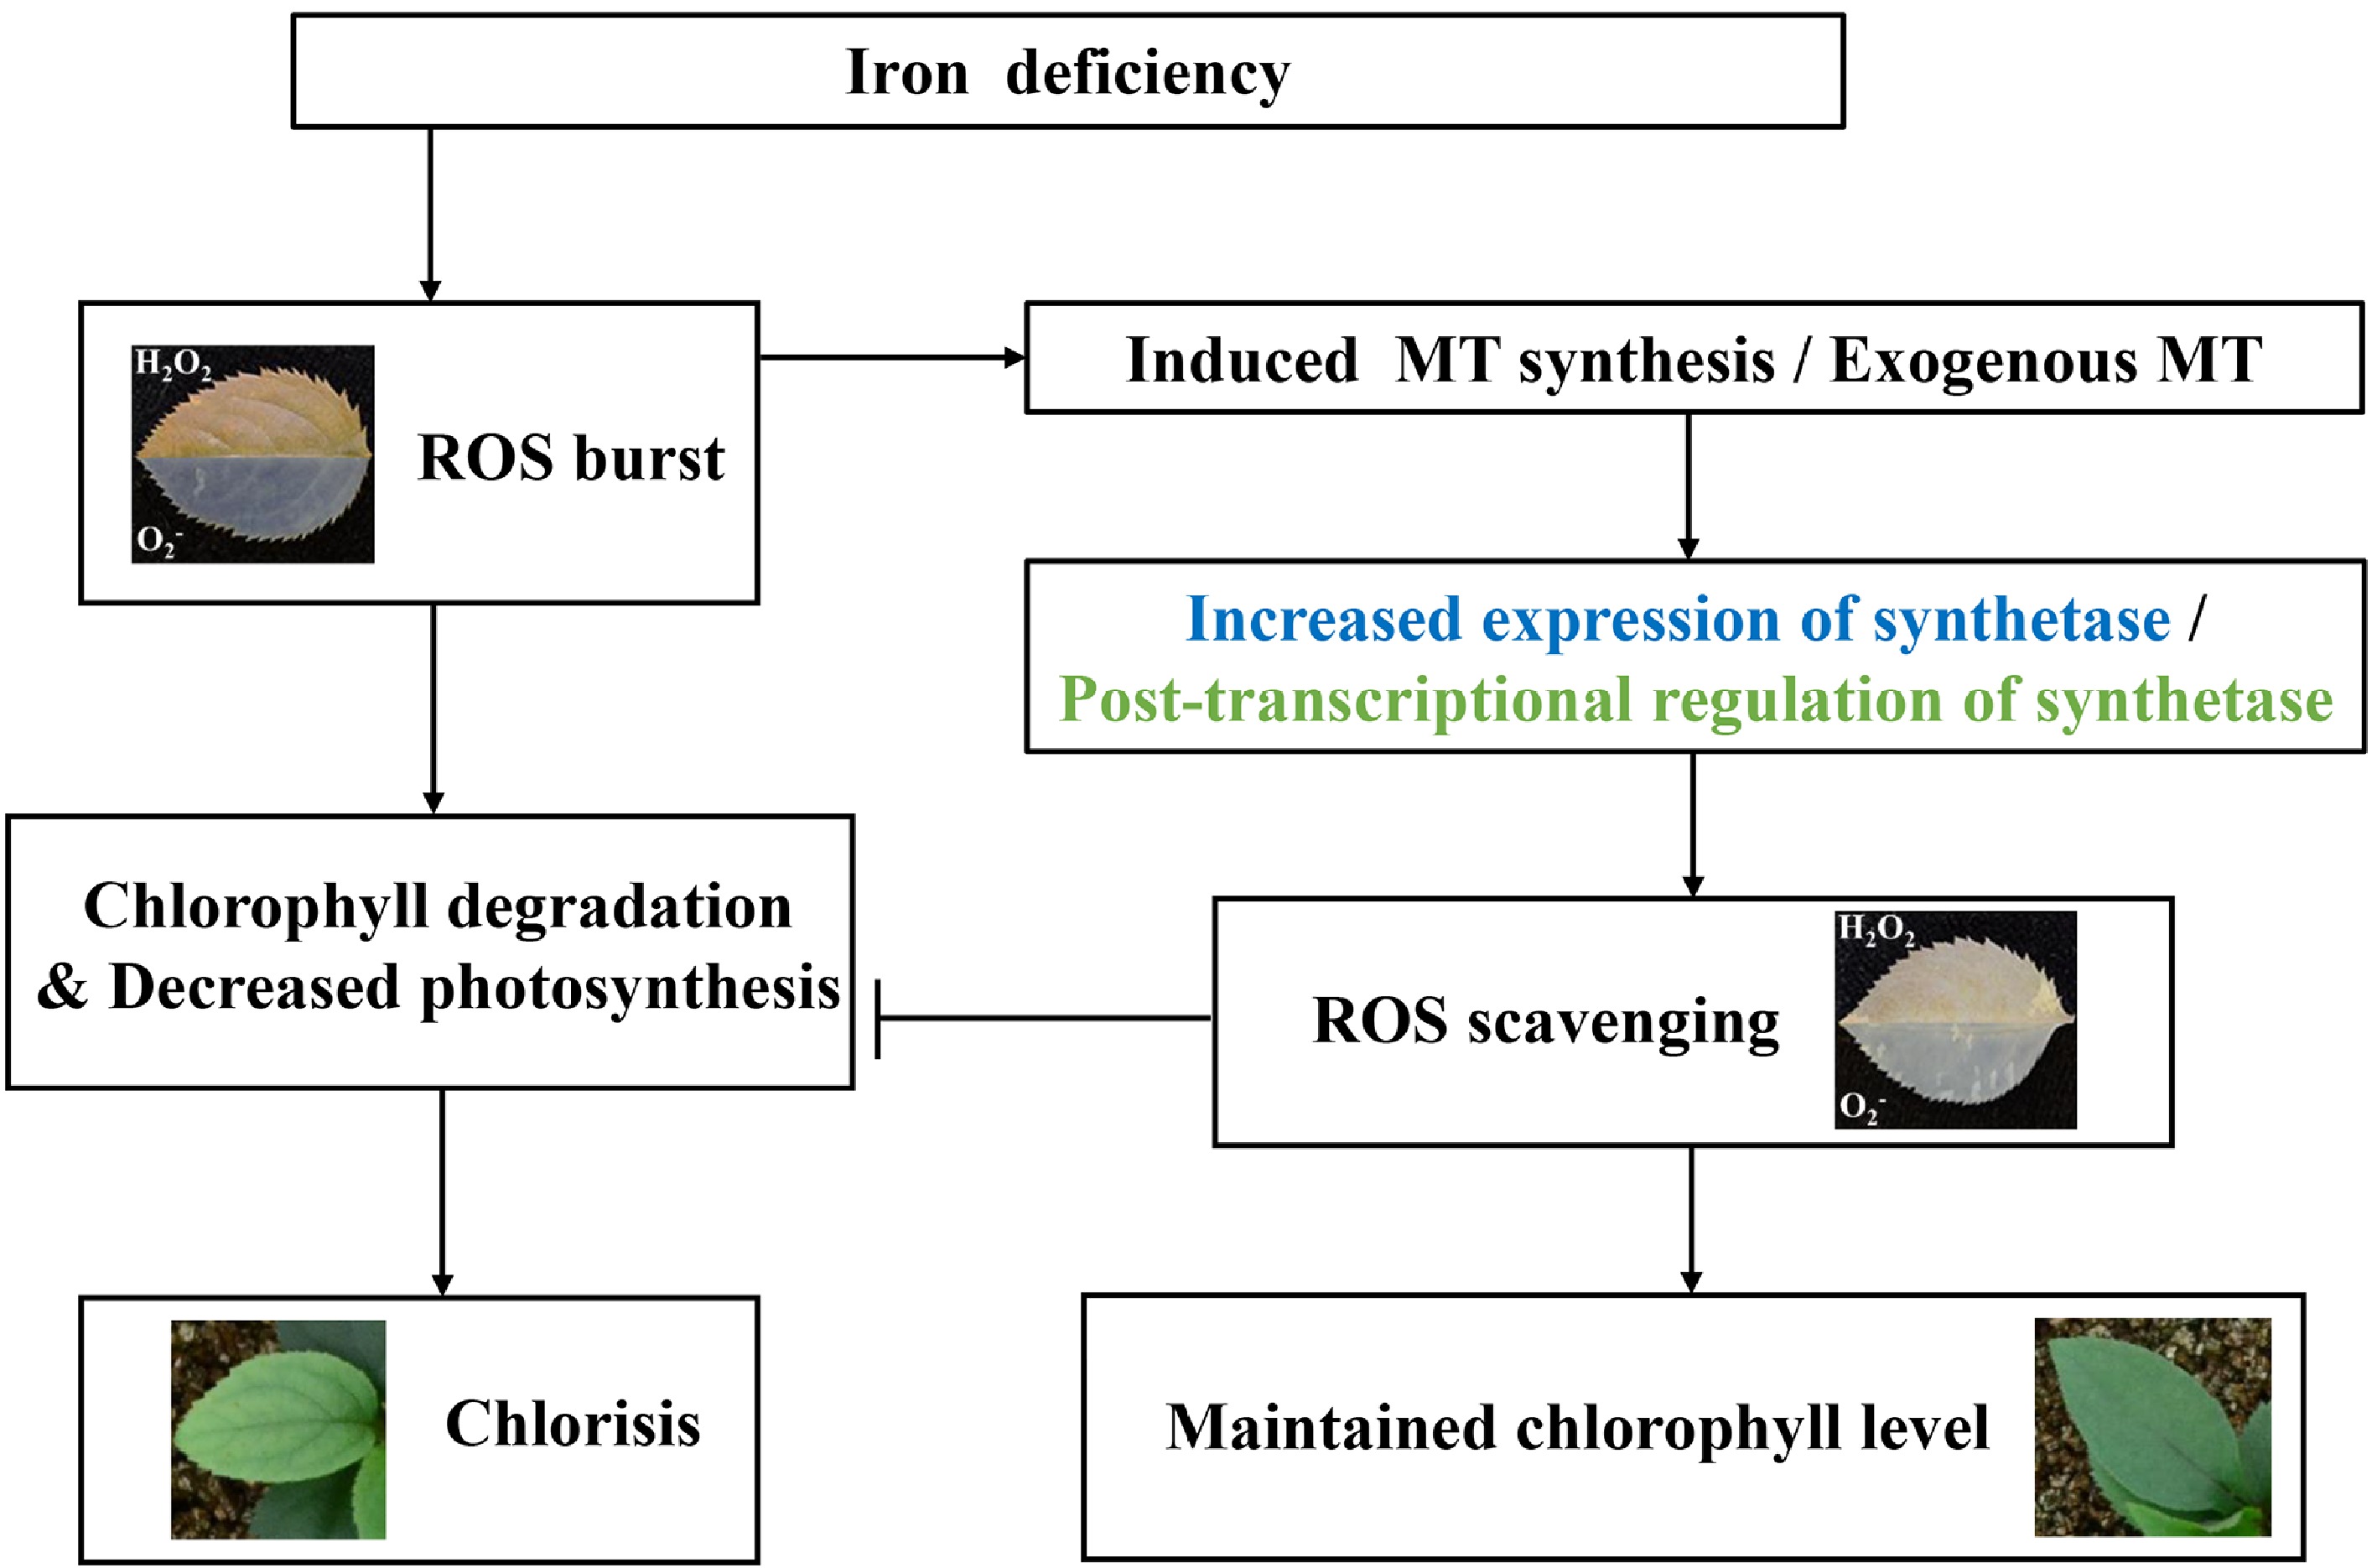
Figure 5. The speculated model regarding the protective functions of melatonin against Fe deficiency stress in apple. Fe deficiency induced the ROS burst, which resulted in the degradation of chlorophyll and decreased photosynthesis. It led to the chlorosis of leaves in apple. Furthermore, the ROS burst triggered by Fe deficiency induced the synthesis of endogenous melatonin. Endogenous or exogenous melatonin alleviated the oxidative damage triggered by Fe deficiency, through scavenging ROS and consequently protecting chloroplasts in apple. Hence, the leaves of apple remained green under Fe deficiency. Arrows: the stimulation; Even bars: the inhibition.
Figures
(5)
Tables
(0)