-
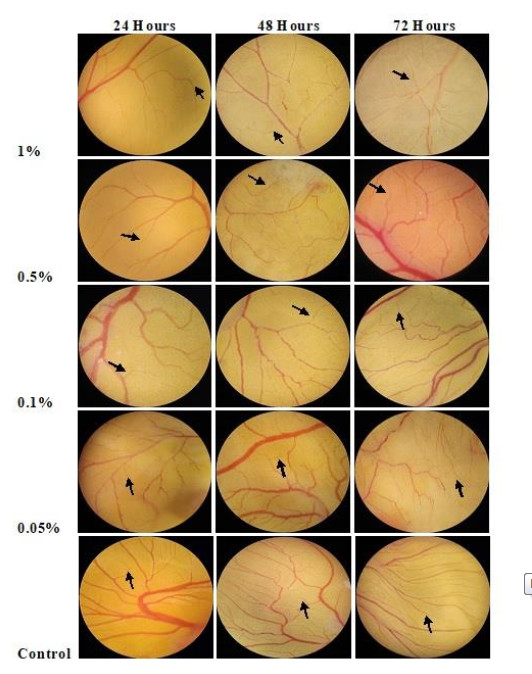
Figure 1. CAM assay in chick embryos exposed to various treatment concentrations showing branching points of blood vessels at different time of exposure (arrows showing the blood vessels branch point)
-
Concentrations (%) Lyophilized hot water extract (g) Sterile water (ml) 1.00 0.10 10 0.50 0.05 10 0.10 0.01 10 0.05 0.005 10 Control 0.00 10 Table 1. Formulation of different treatment concentrations of P. florida lyophilized hot water extract
-
Concentrations (%) Mean blood vessel branch 24HRS 48HRS 72HRS 1.00 24.80±3.14a 36.13±9.58a 41.07±12.62b 0.50 28.73±2.91a 40.73±7.40a 48.87±5.14ab 0.10 31.60±2.96a 41.93±3.52a 52.67±10.23ab 0.05 37.27±10.37a 42.60±11.33a 59.80±3.12ab Control 42.47±12.76a 56.13±2.08a 66.93±7.55a *Values within the parentheses are the standard deviation in each treatment means
*Treatment means with the same letter of superscript are not significantly different from each other at a 5% level of significance using DMRTTable 2. Number of blood vessels branch points formed in the developing chick embryos treated with P. florida lyophilized hot water extract
-
Concentrations (%) % Angiosuppressive 48HRS Activity 72HRS 1.00 35.69 16.43 36.85 24.26 0.50 27.12 15.56 25.88 14.94 0.10 25.33 4.77 19.69 22.44 0.05 23.57 22.99 10.07 9.17 Control 0 0 Table 3. Percentage angiosuppressive activity of P. florida lyophilized hot water extract on the developing chick embryos exposed to different treatment concentration
-
Model Time B Std. Error t Sig. 1 48 (Constant) 23.563 9.413 2.503 .037 concentration _0.1 1.770 13.312 0.133 .898 concentration _0.5 3.560 13.312 0.267 .796 concentration_1 12.120 13.312 0.910 .389 2 72 (Constant) 10.067 10.799 0.932 .379 concentration _0.1 9.623 15.272 0.630 .546 concentration _0.5 15.810 15.272 1.035 .331 concentration_1 26.777 15.272 1.753 .118 Table 4. Summary of simple regression analysis on the effect of concentration on the percentage angiosuppressive activity by time point
Figures
(1)
Tables
(4)