-
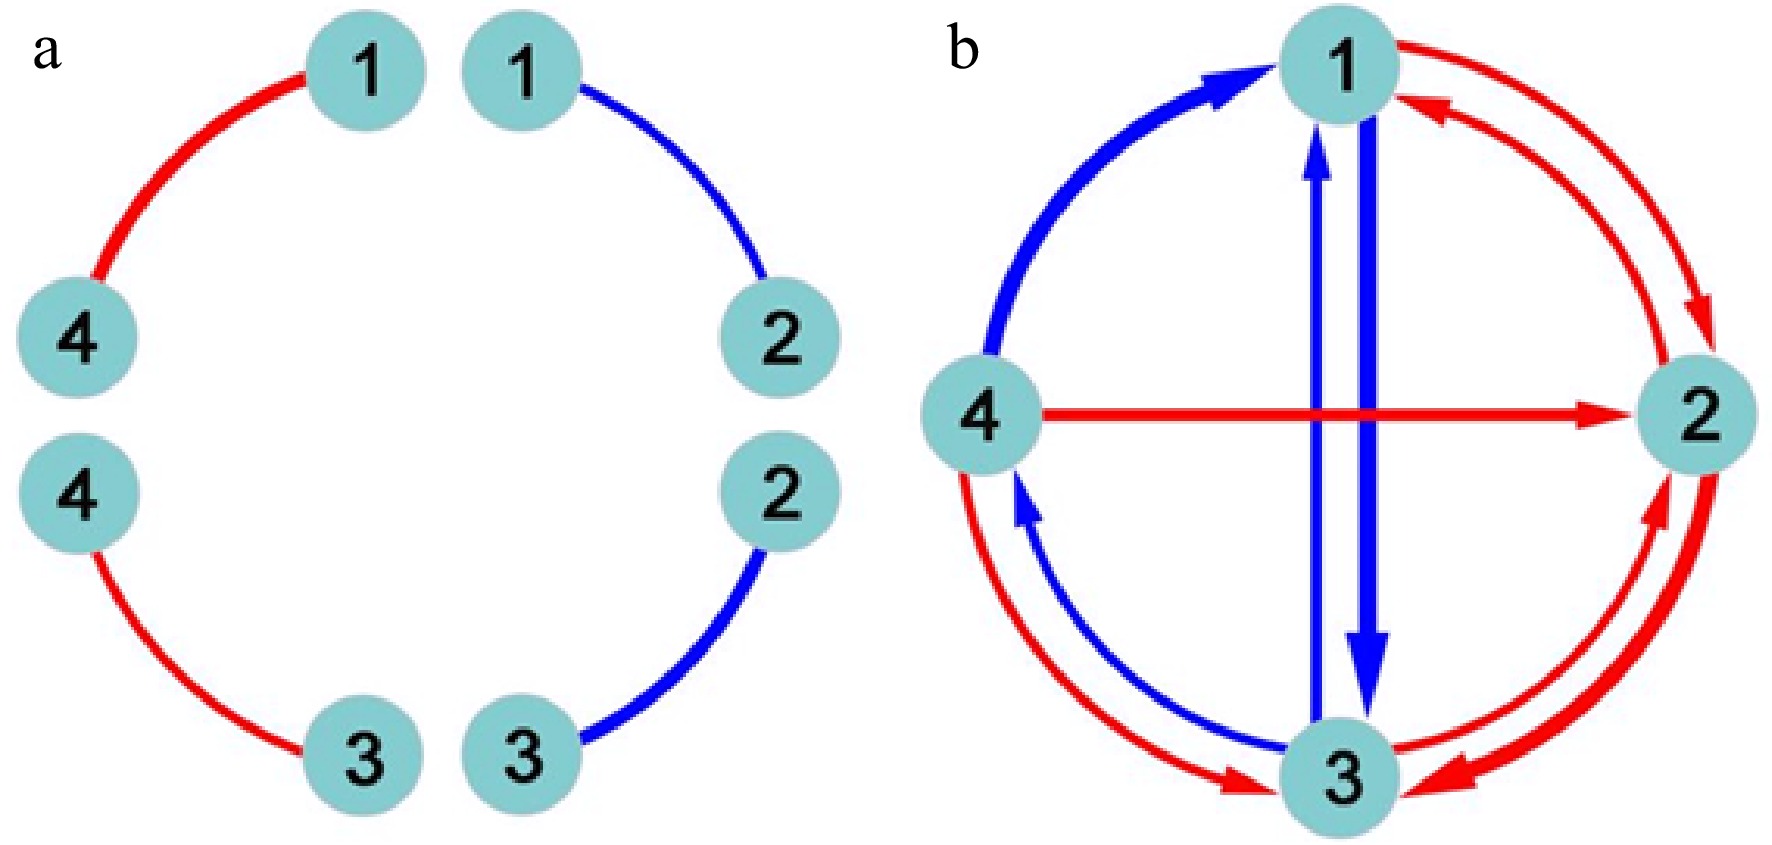
Figure 1. Detection of epistasis by (a) classic quantitative genetic approaches and (b) functional network mapping. Four loci are assumed, with pairwise interactions being shown. Classic approaches can only estimate the sign and strength of epistasis, but fail to identify the direction of epistasis. Red and blue lines denote positive and negative epistasis, respectively, with the thickness proportional to the strength of epistasis.
-
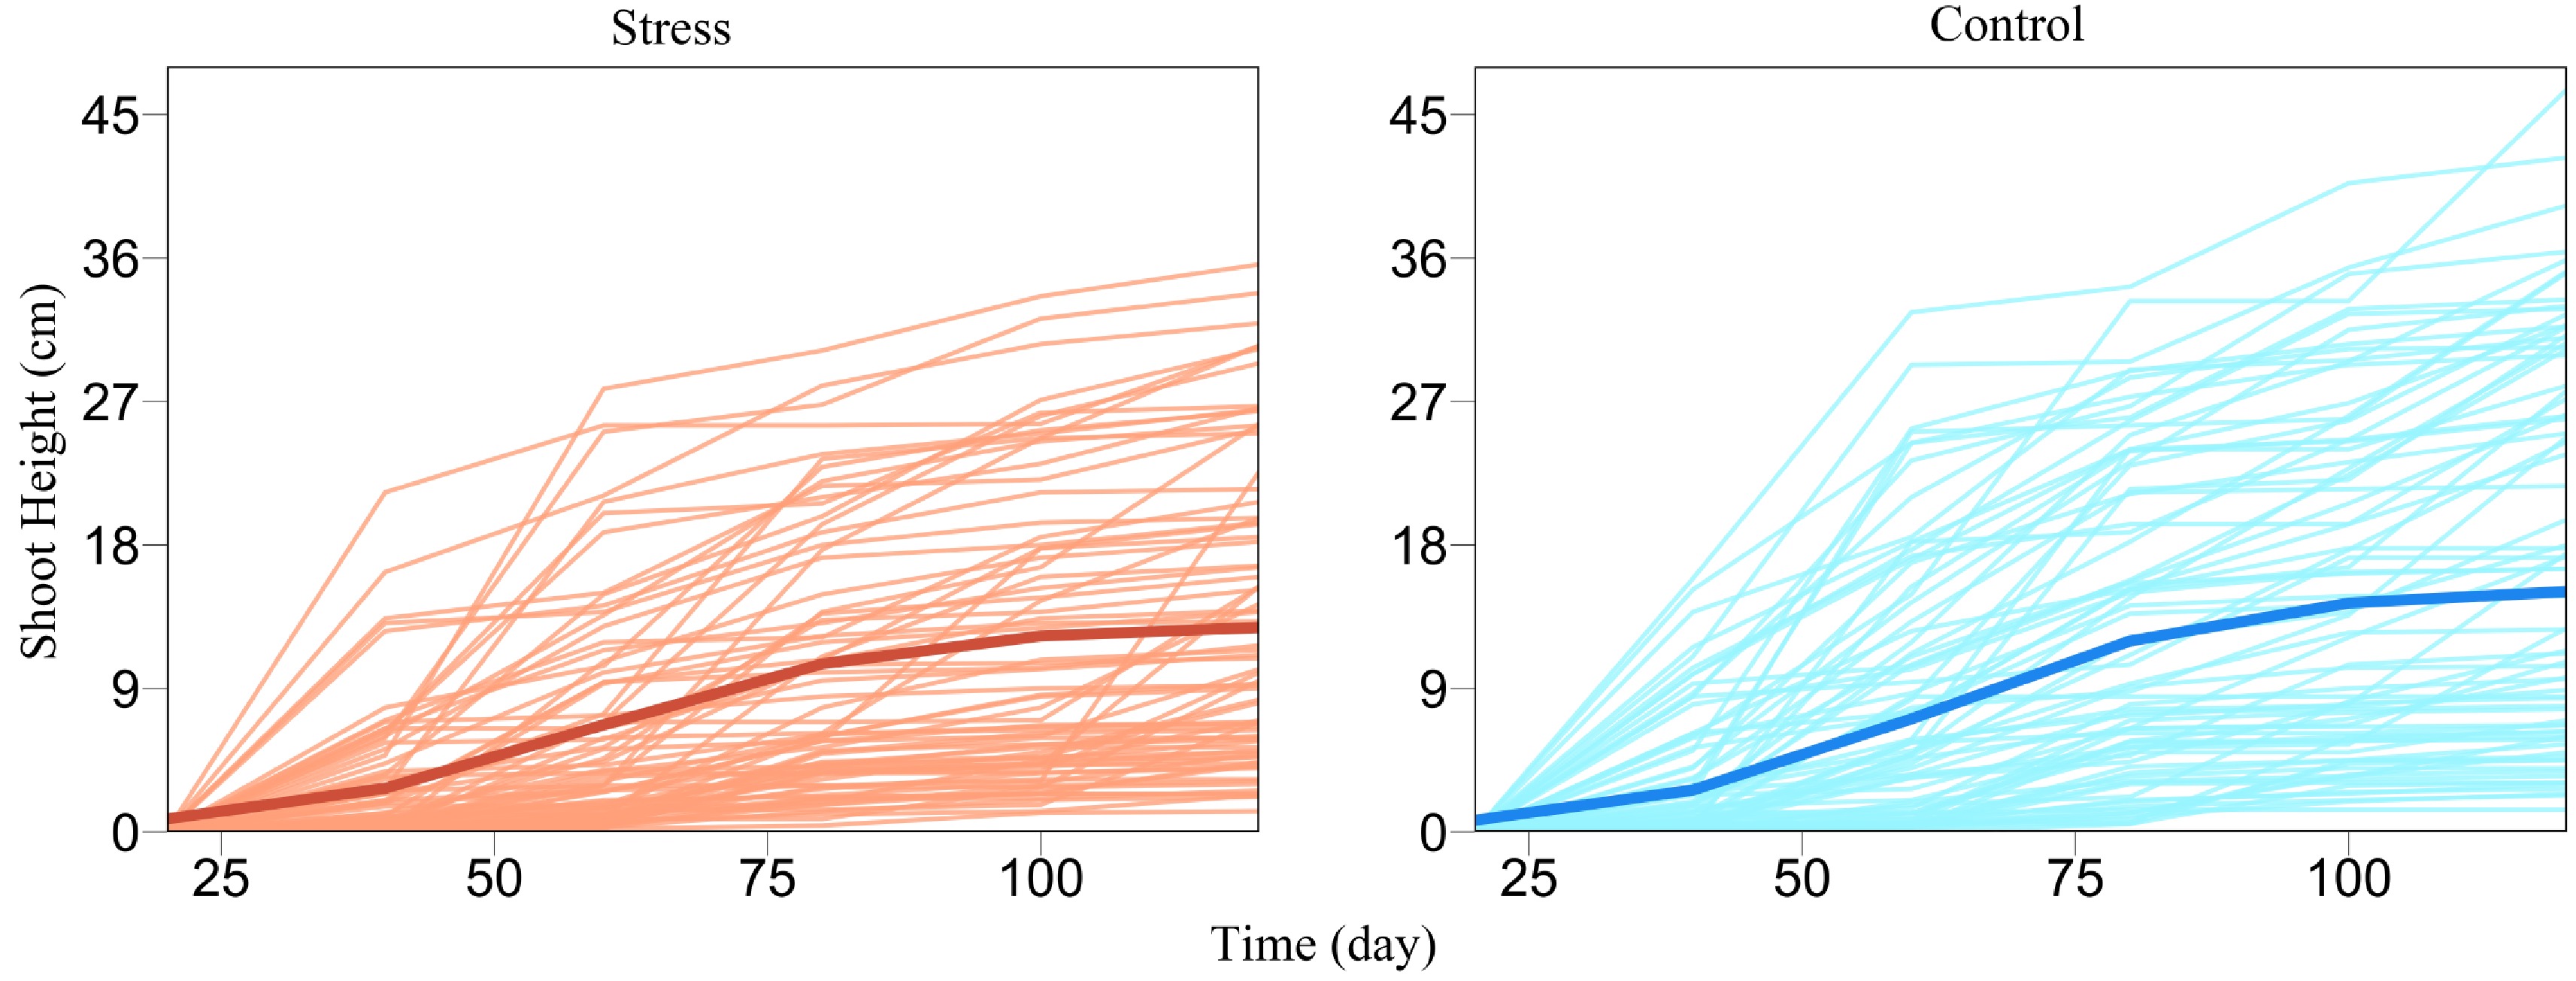
Figure 2. Growth curves of juvenile shoot heights (thin lines) for a GWAS population of Euphrates poplar cultured in salt-exposed (stress) and salt-free (control) conditions. The mean curve of young trees (thick line) under each condition is fitted by a logistic growth equation.
-
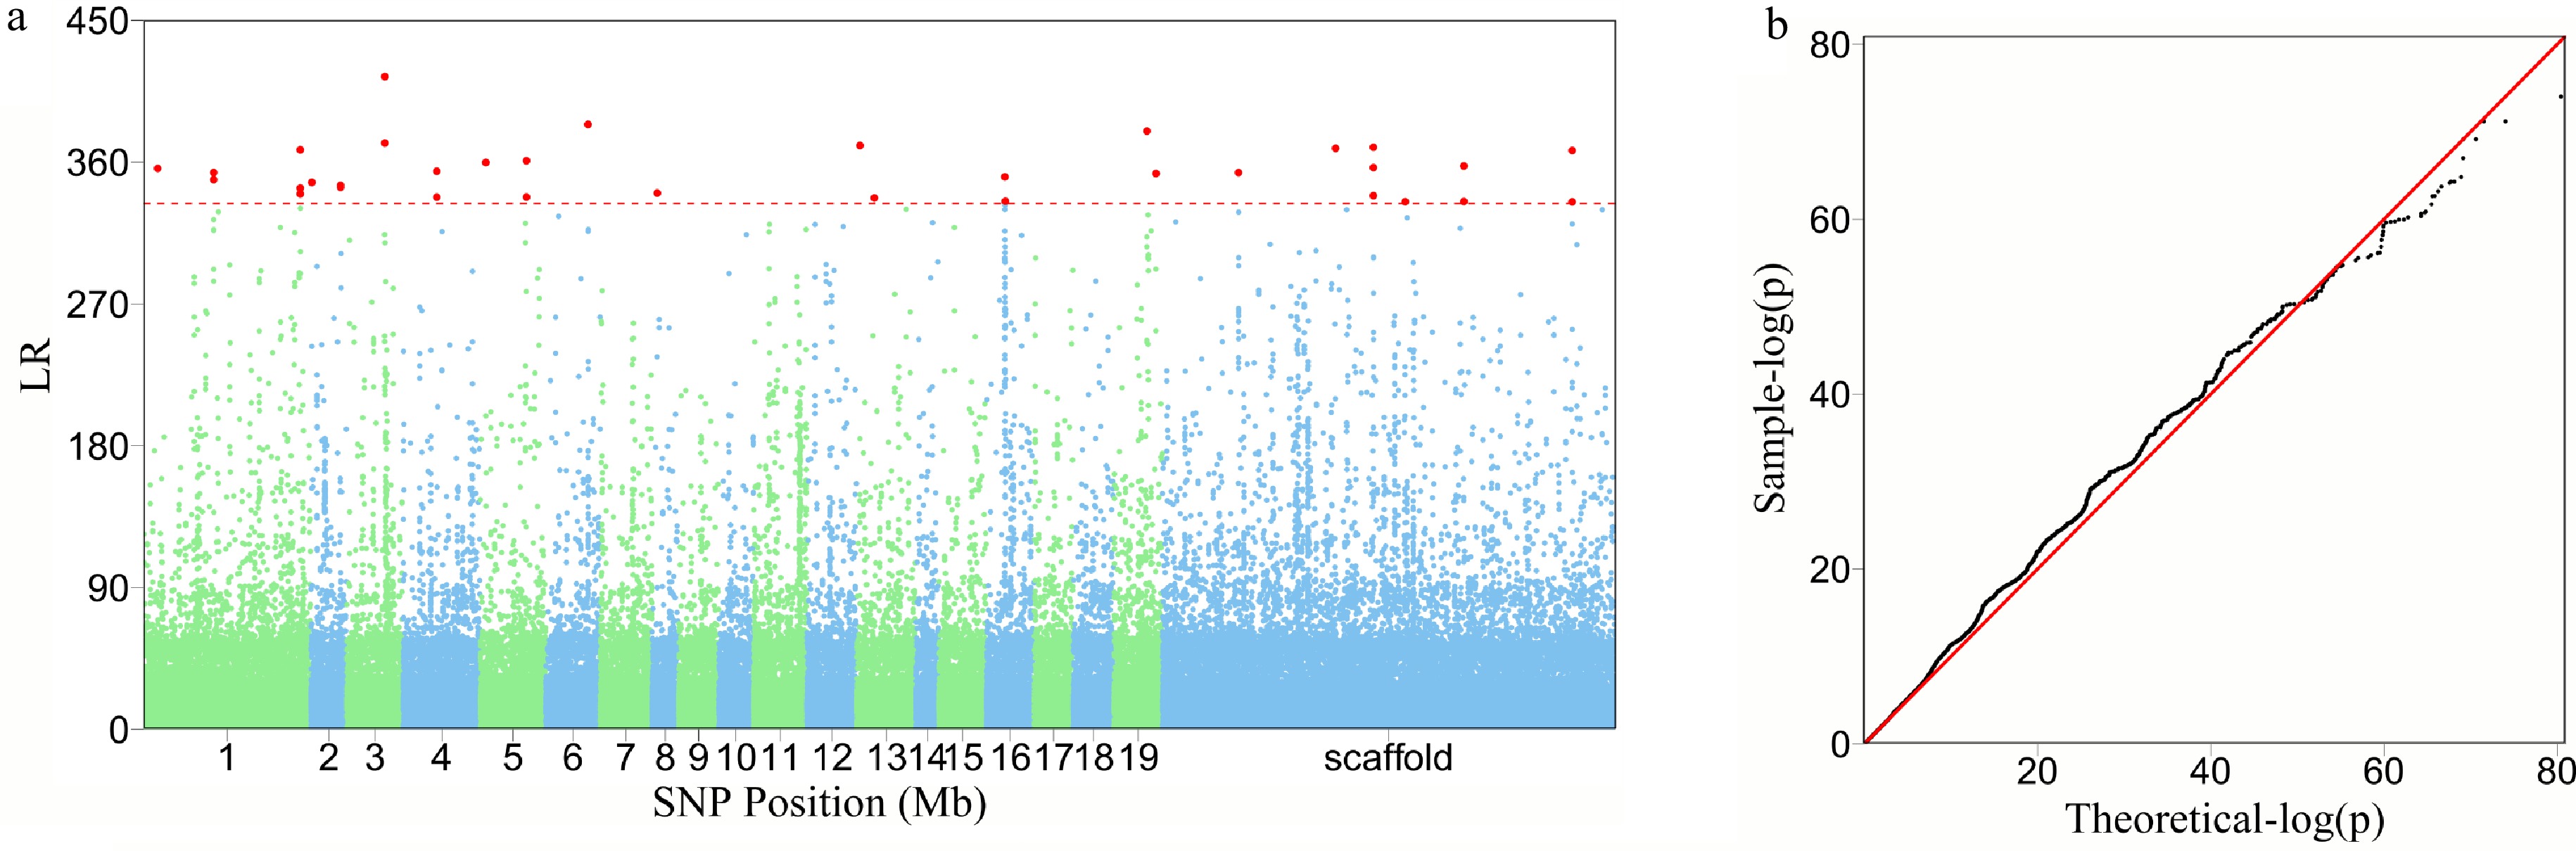
Figure 3. The detection of significant QTLs for salt resistance in Euphrates poplar by FunMap. (a) Manhattan plot of significance tests across 19 Populus chromosomes and scaffolds based on log-likelihood ratios (LR). The horizontal line is the critical threshold at 5% significance level determined by permutation tests. (b) QQ plot of statistical tests for the GWAS population.
-
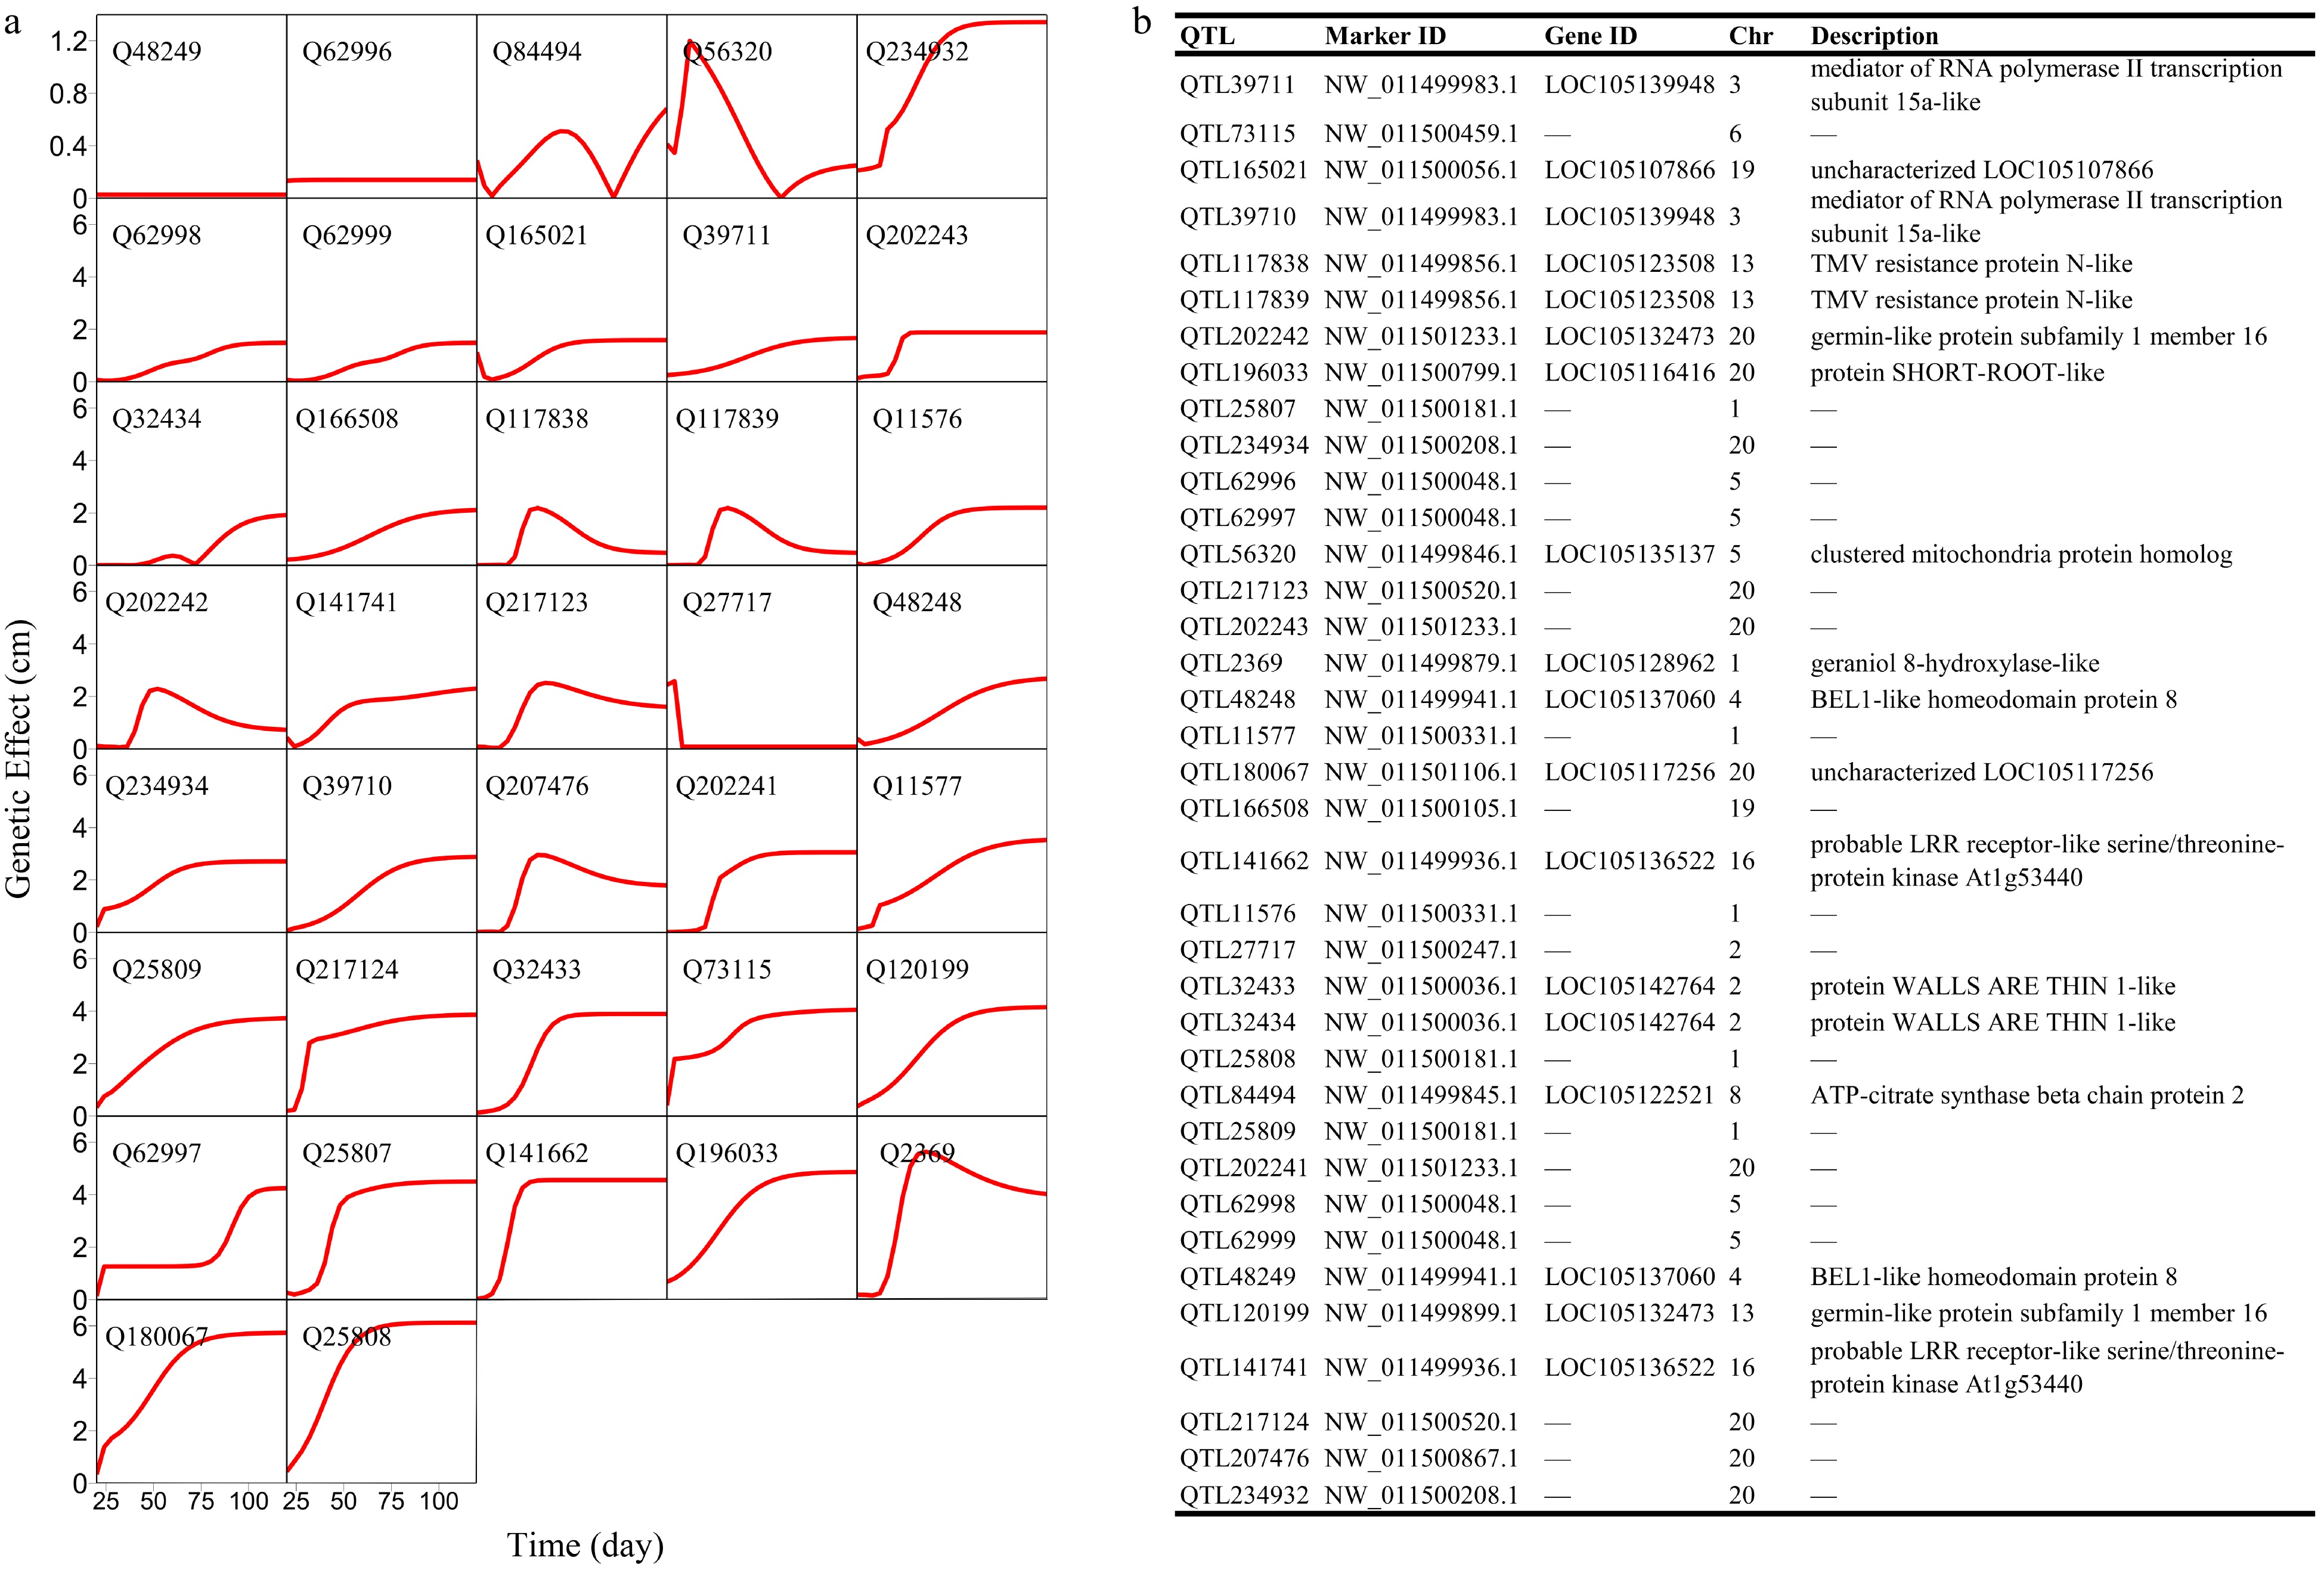
Figure 4. Genetic effect curves of (a) salt resistance QTLs and (b) their gene enrichment analysis.
-
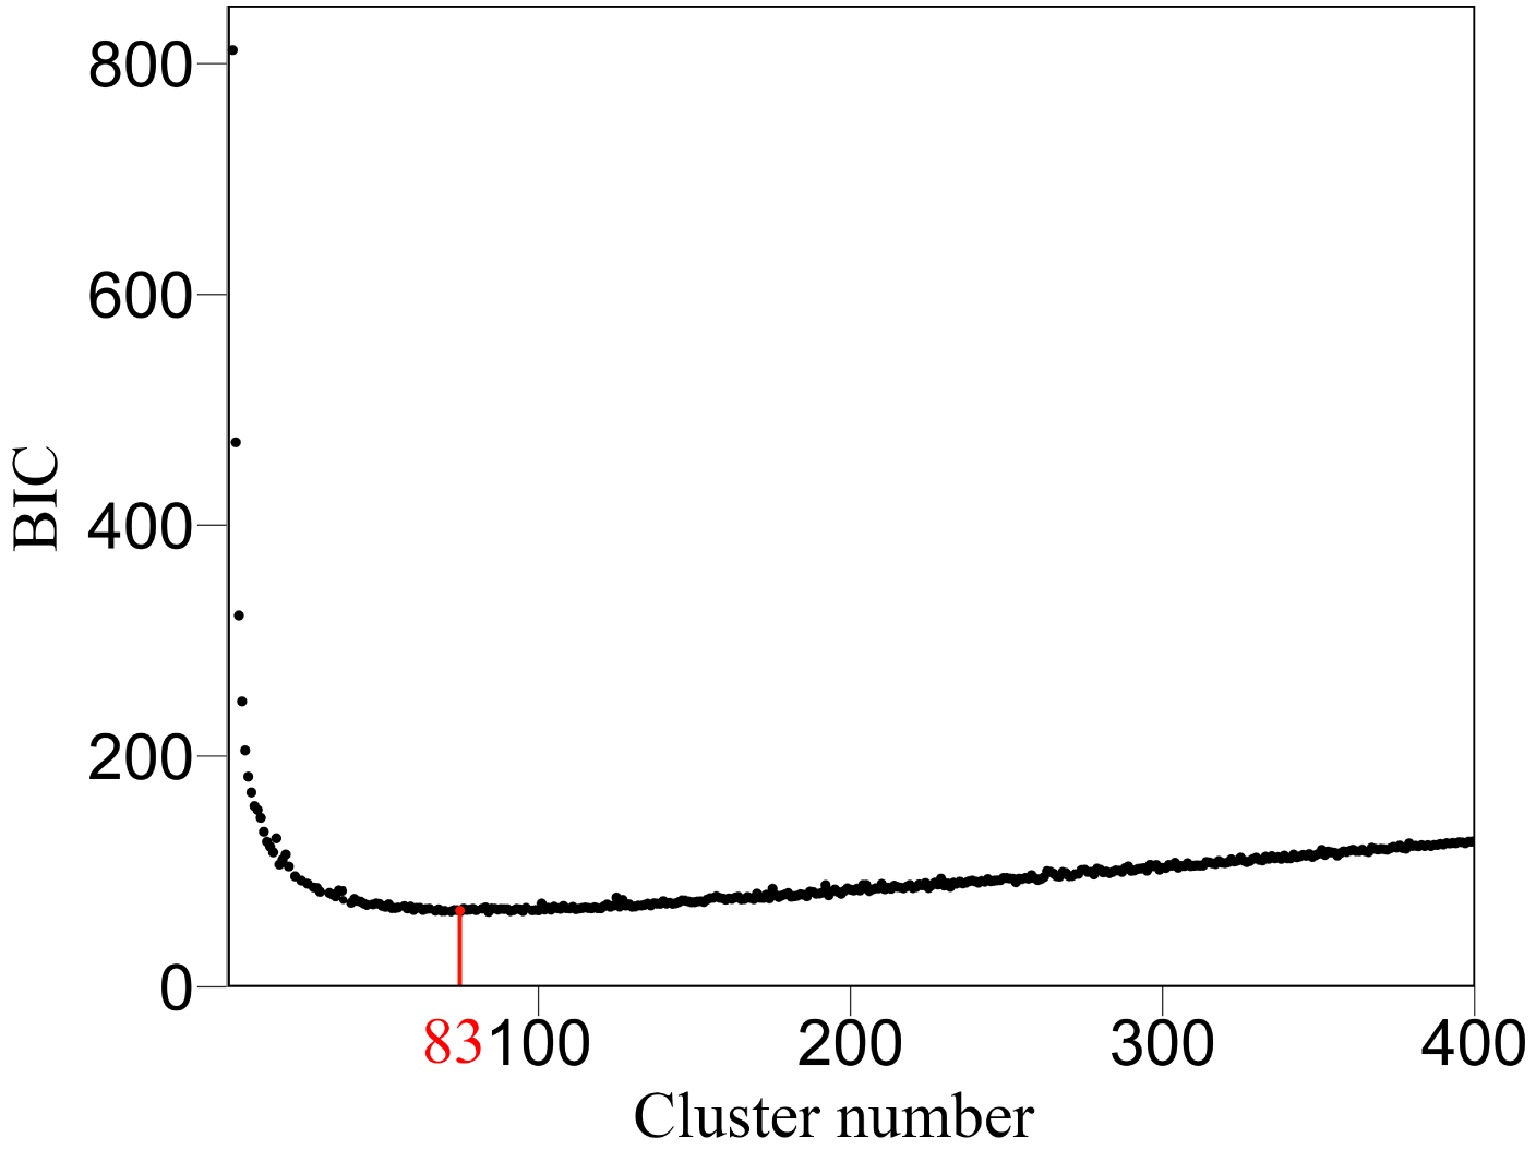
Figure 5. Classification of all SNPs into 83 modules (according to BIC) based on their similarity of temporal genetic effects.
-
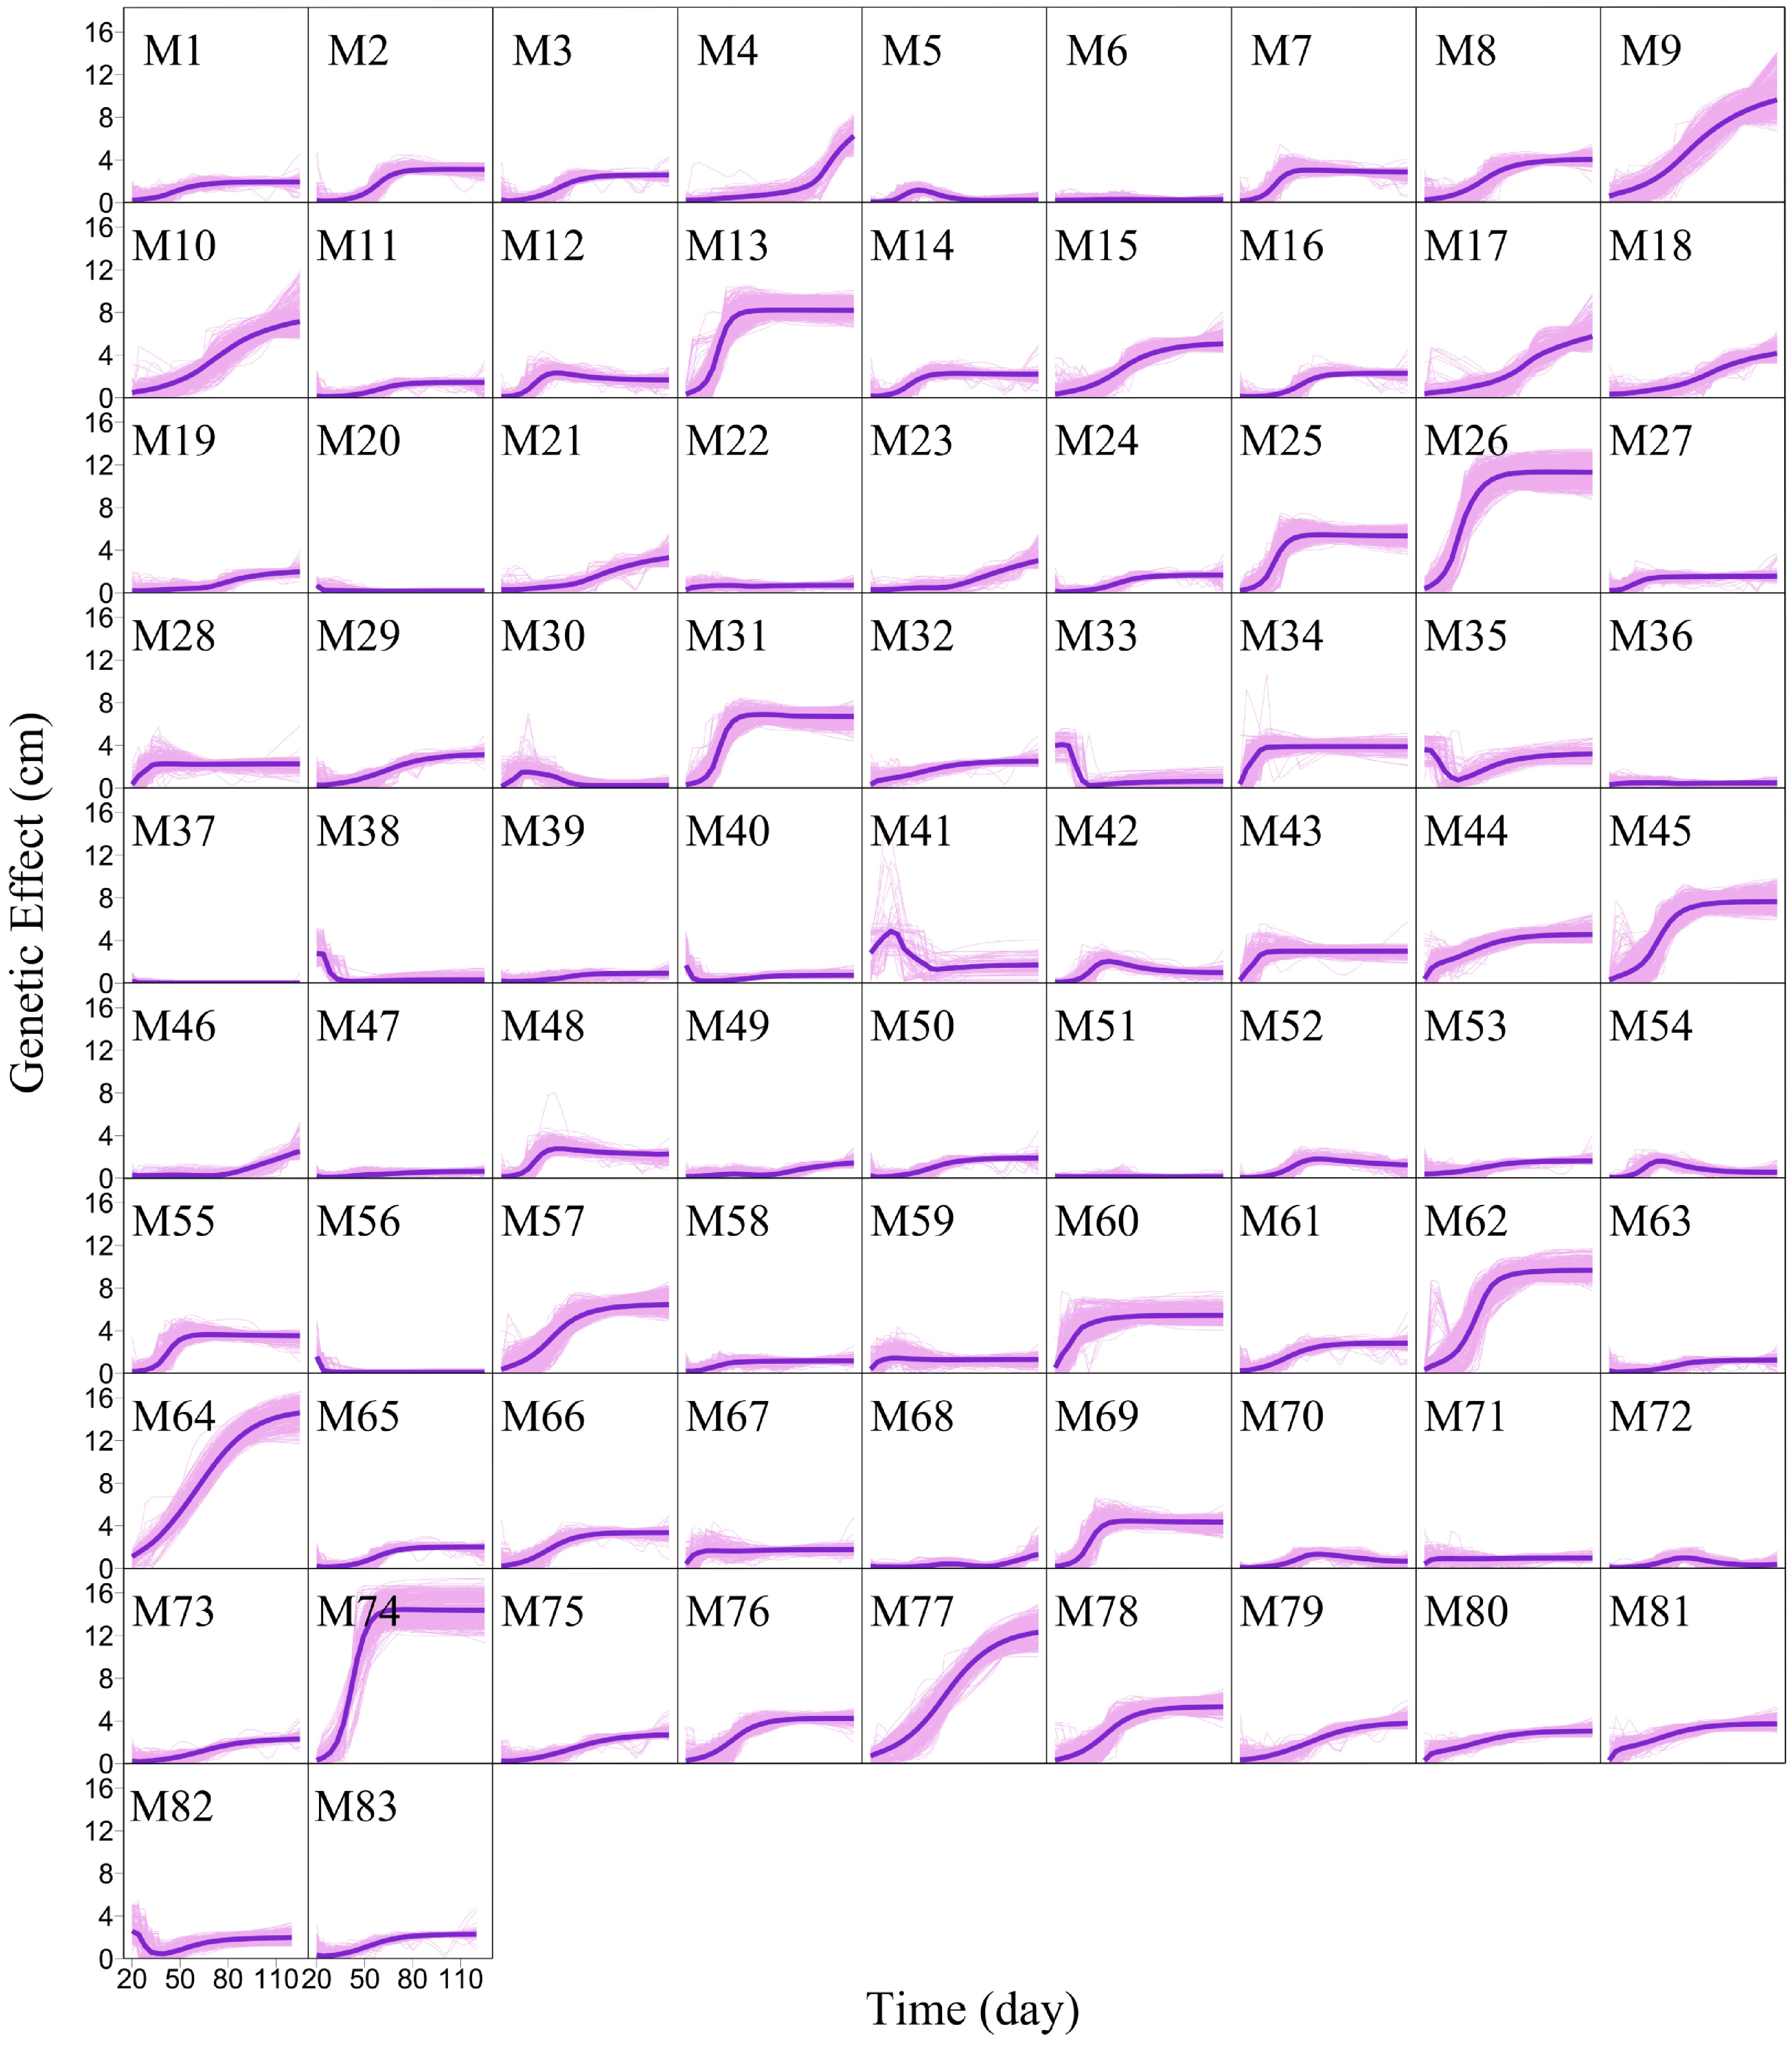
Figure 6. Mean genetic effect curves of each module M1 – M83. The background represents the genetic effect curves of all SNPs from a module.
-
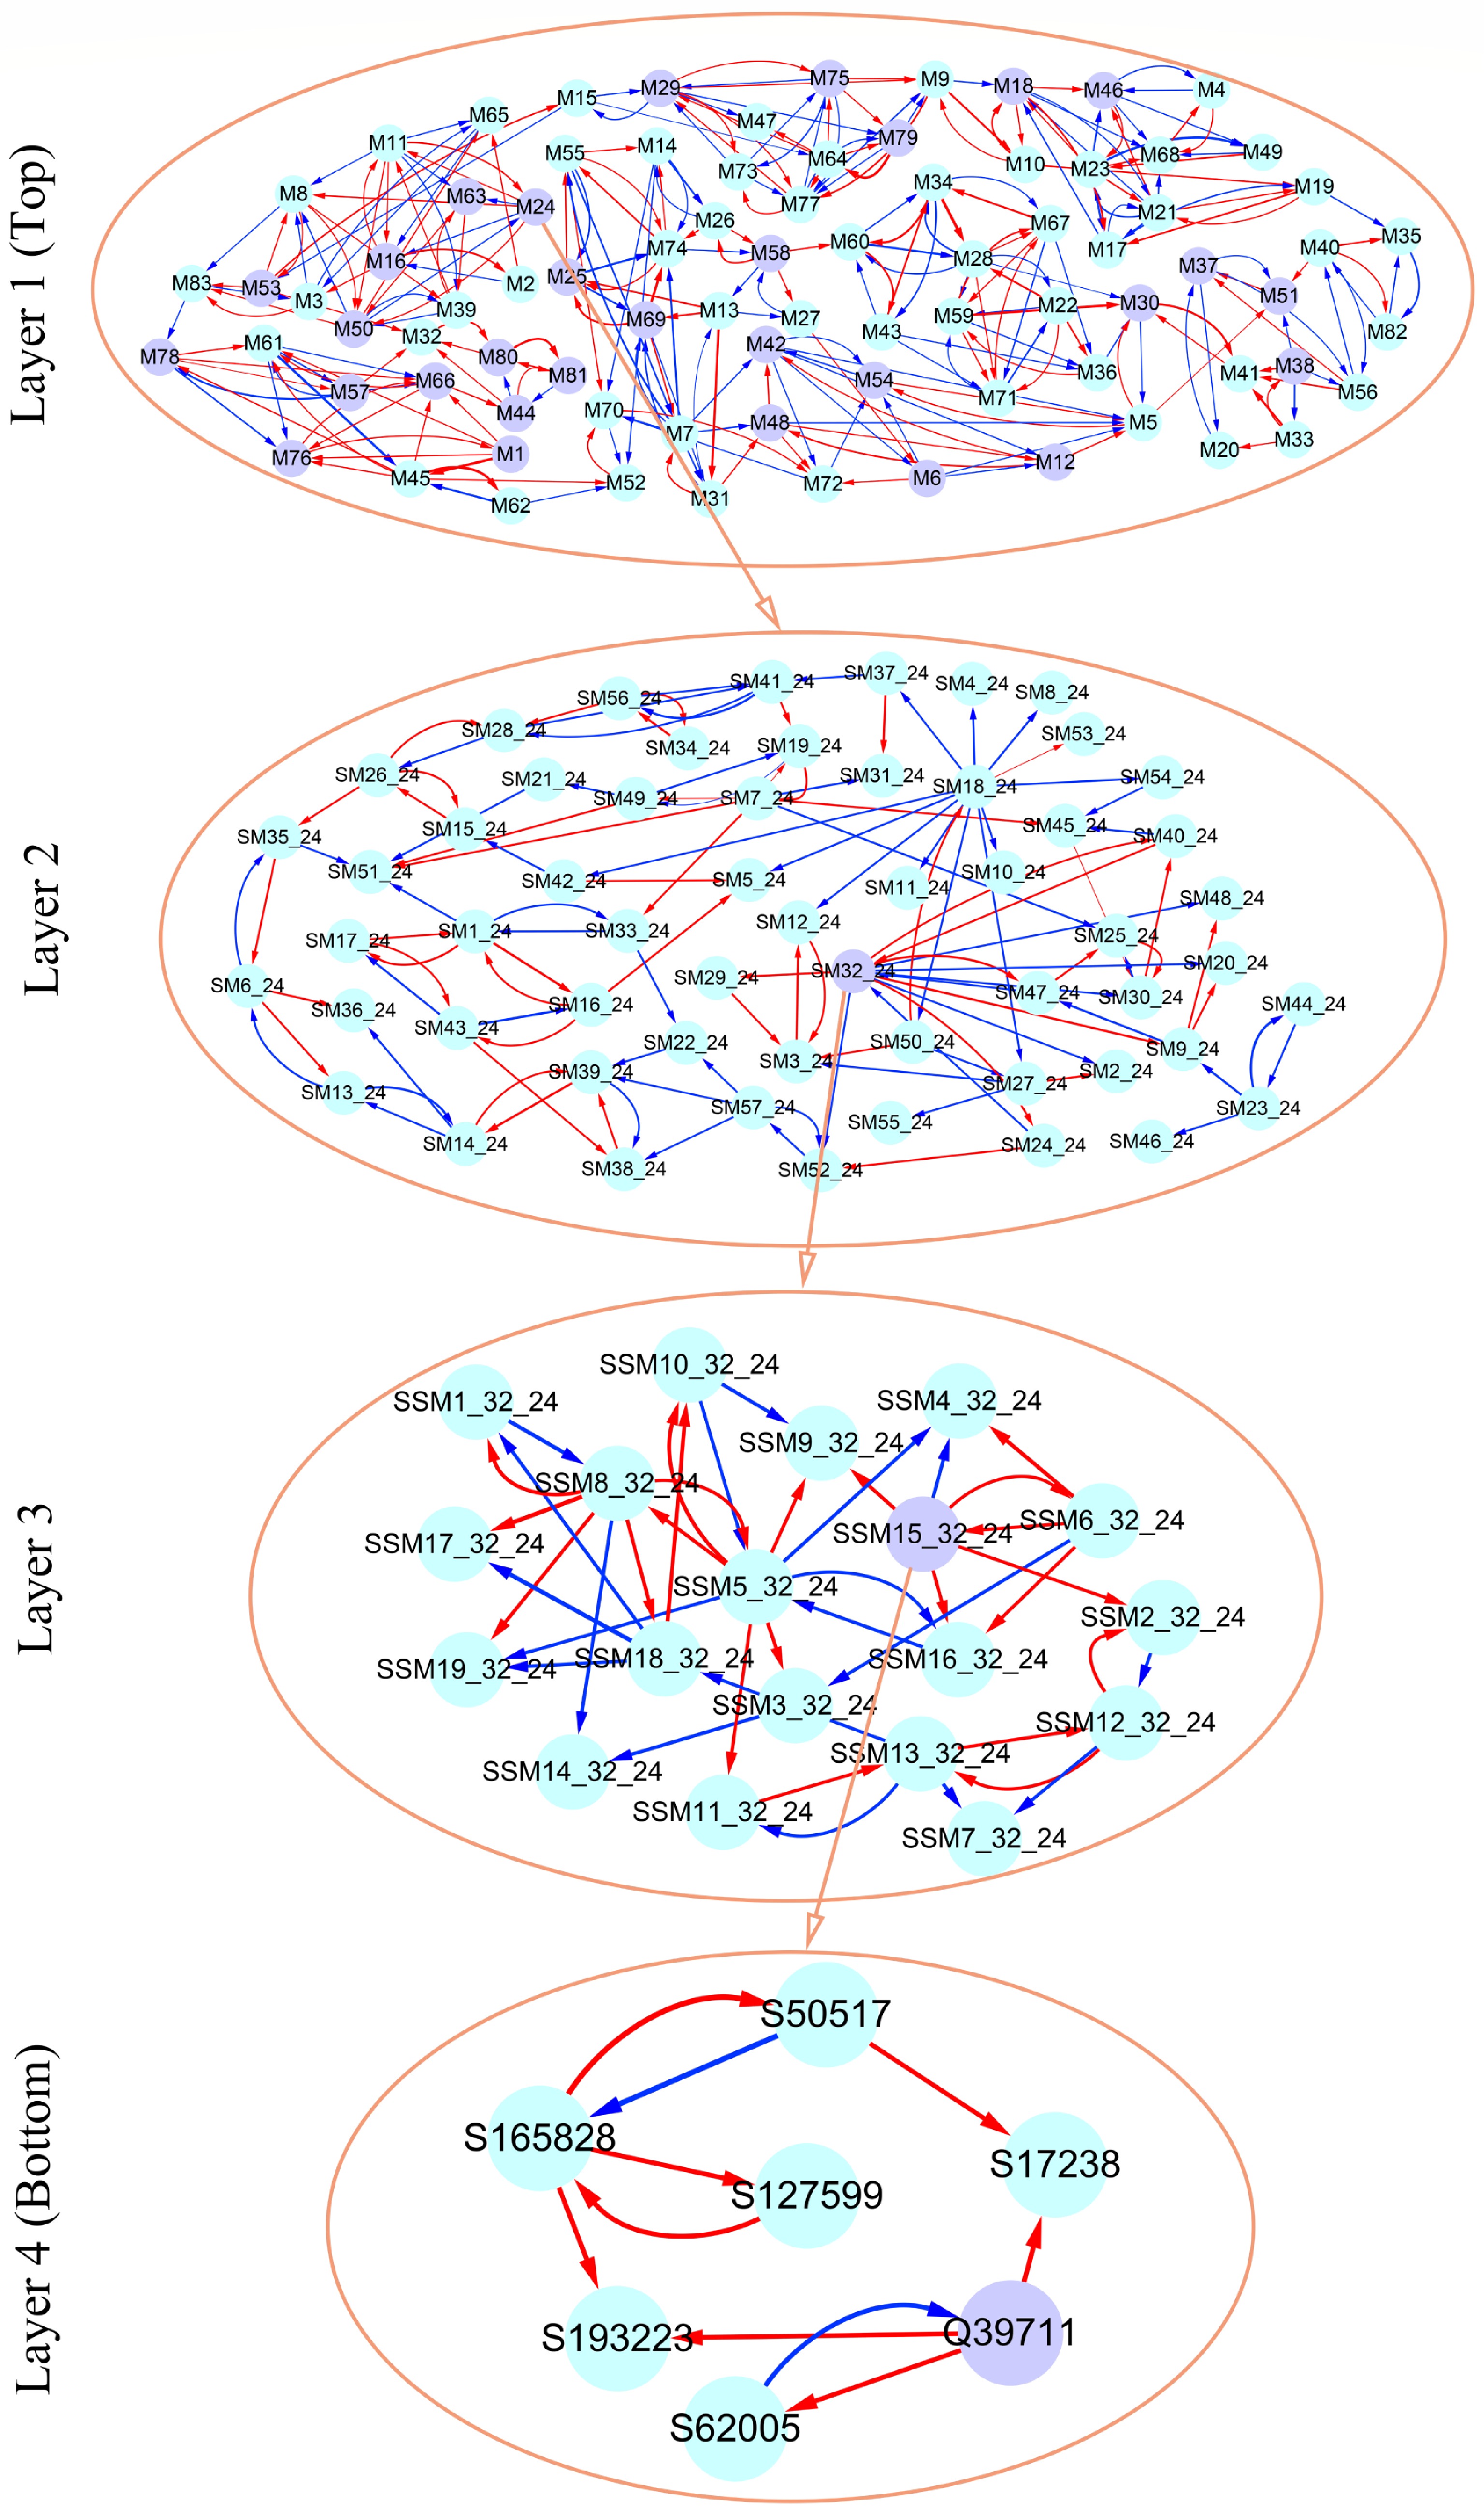
Figure 7. Multilayer interactome network for salt resistance in Euphrates poplar. At layer 1 (top) is the coarse-grained network among 83 modules. Layer 2 and 3 networks are the networks among submodules from module M24 and among sub-submodules from submodule SM32 of M24. At layer 4 (bottom) is the fine-grained SNP network from sub-submodule SSM15_32 of SM32. Arrowed red and blues lines stand for the positive and negative regulation of one SNP for the other SNP, respectively.
-
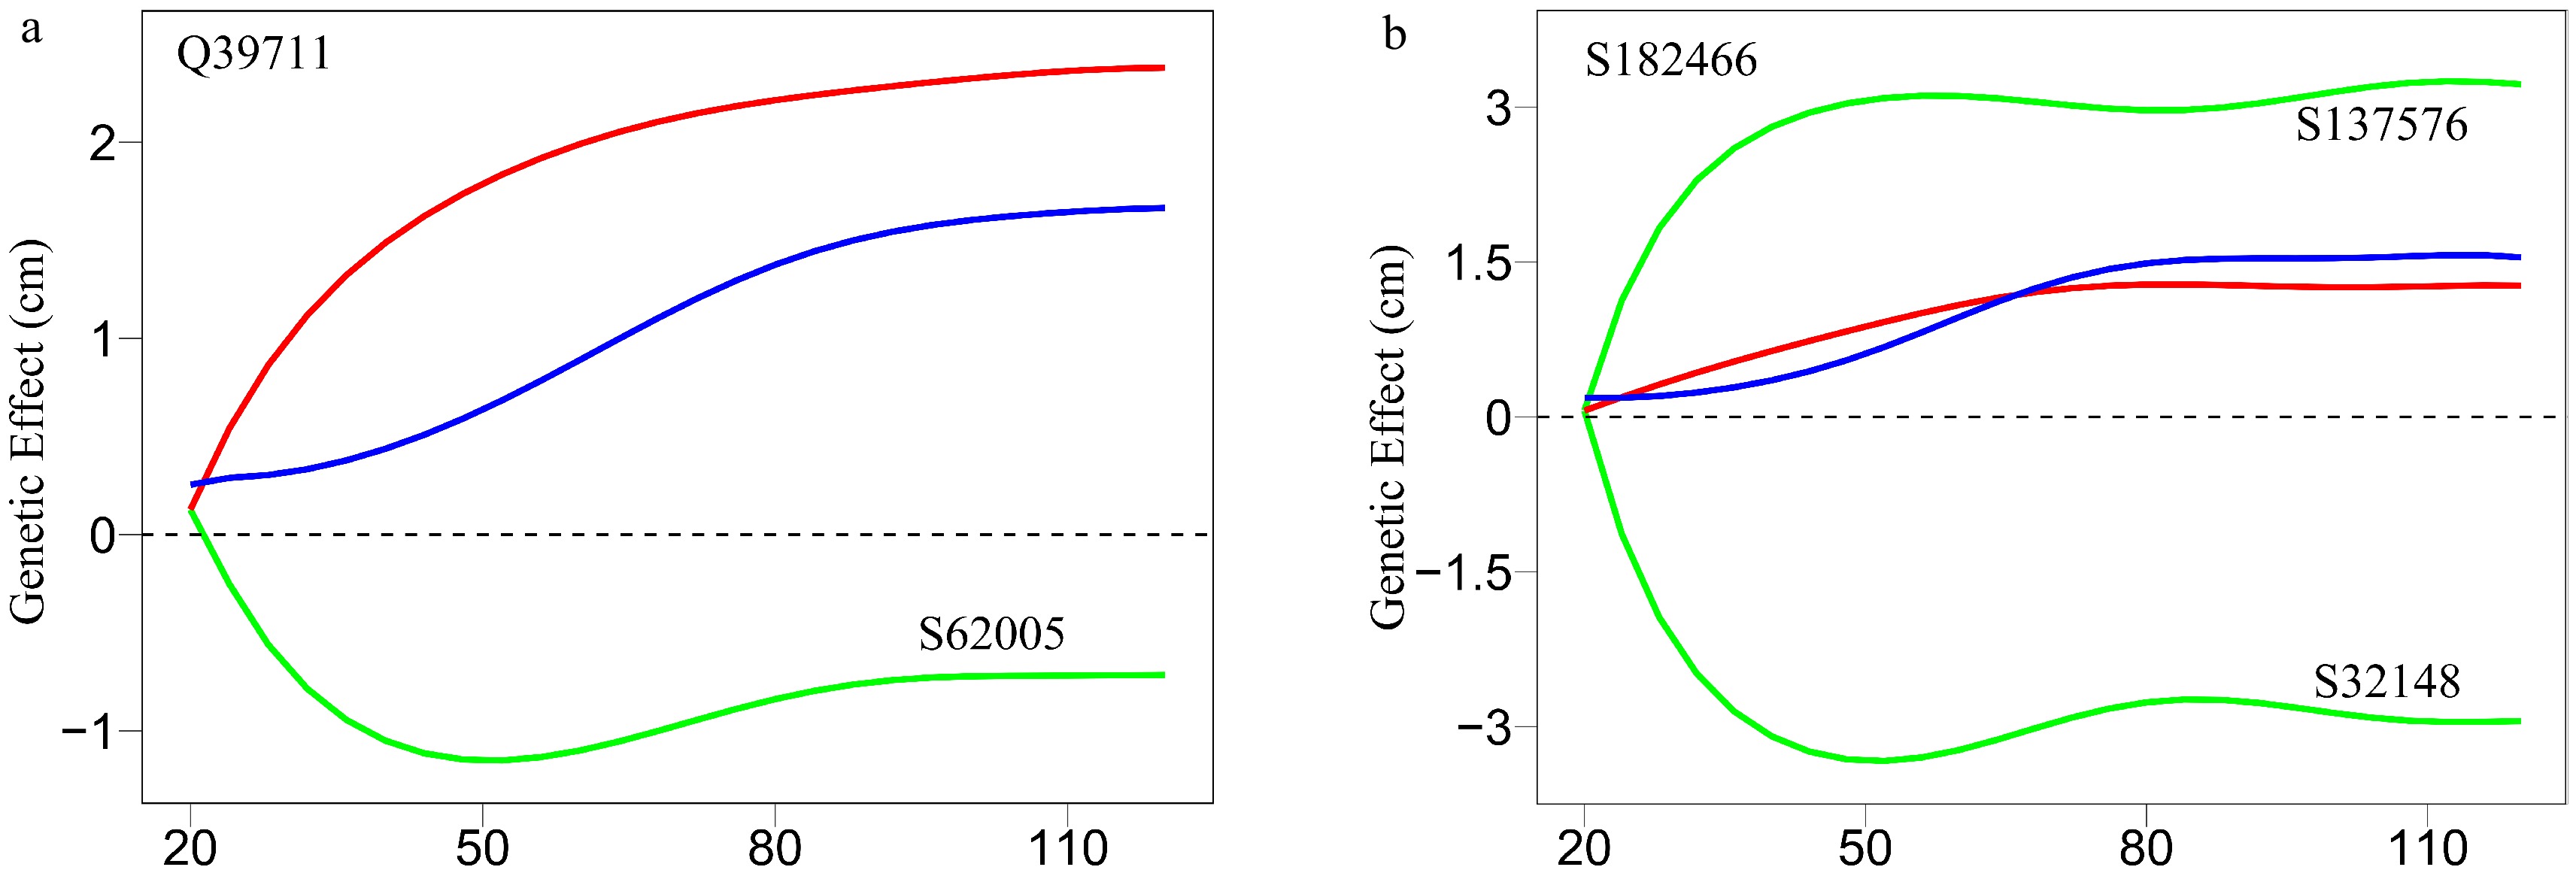
Figure 8. Decomposition of new genetic effects (blue line) into independent effects (red line) and dependent effects (green line) for (a) a QTL Q39711 and (b) an insignificant SNP S182466.
Figures
(8)
Tables
(0)