-
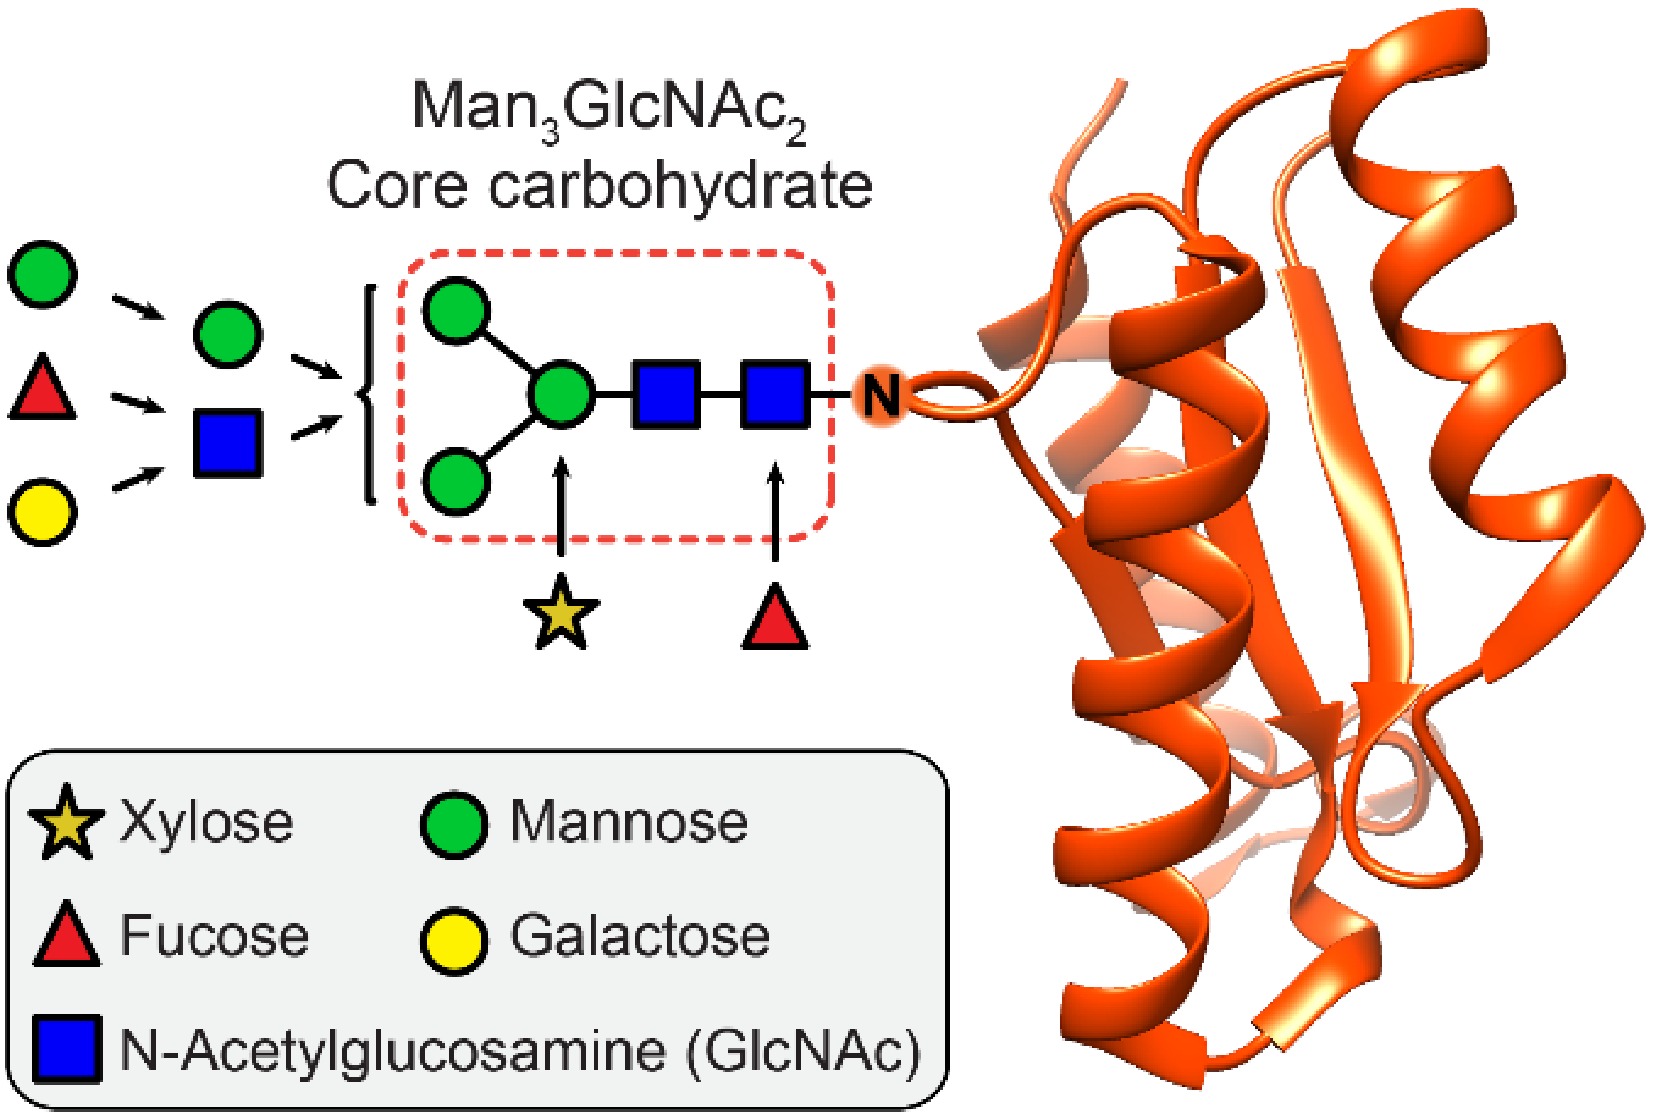
Figure 1. Structural composition of plant protein N-glycosylation. The Man3GlcNAc2 core carbohydrate is attached via an asparagine side chain (N) to the protein part (red). The core carbohydrate region can be decorated extensively by a variety of sugar moieties.
-
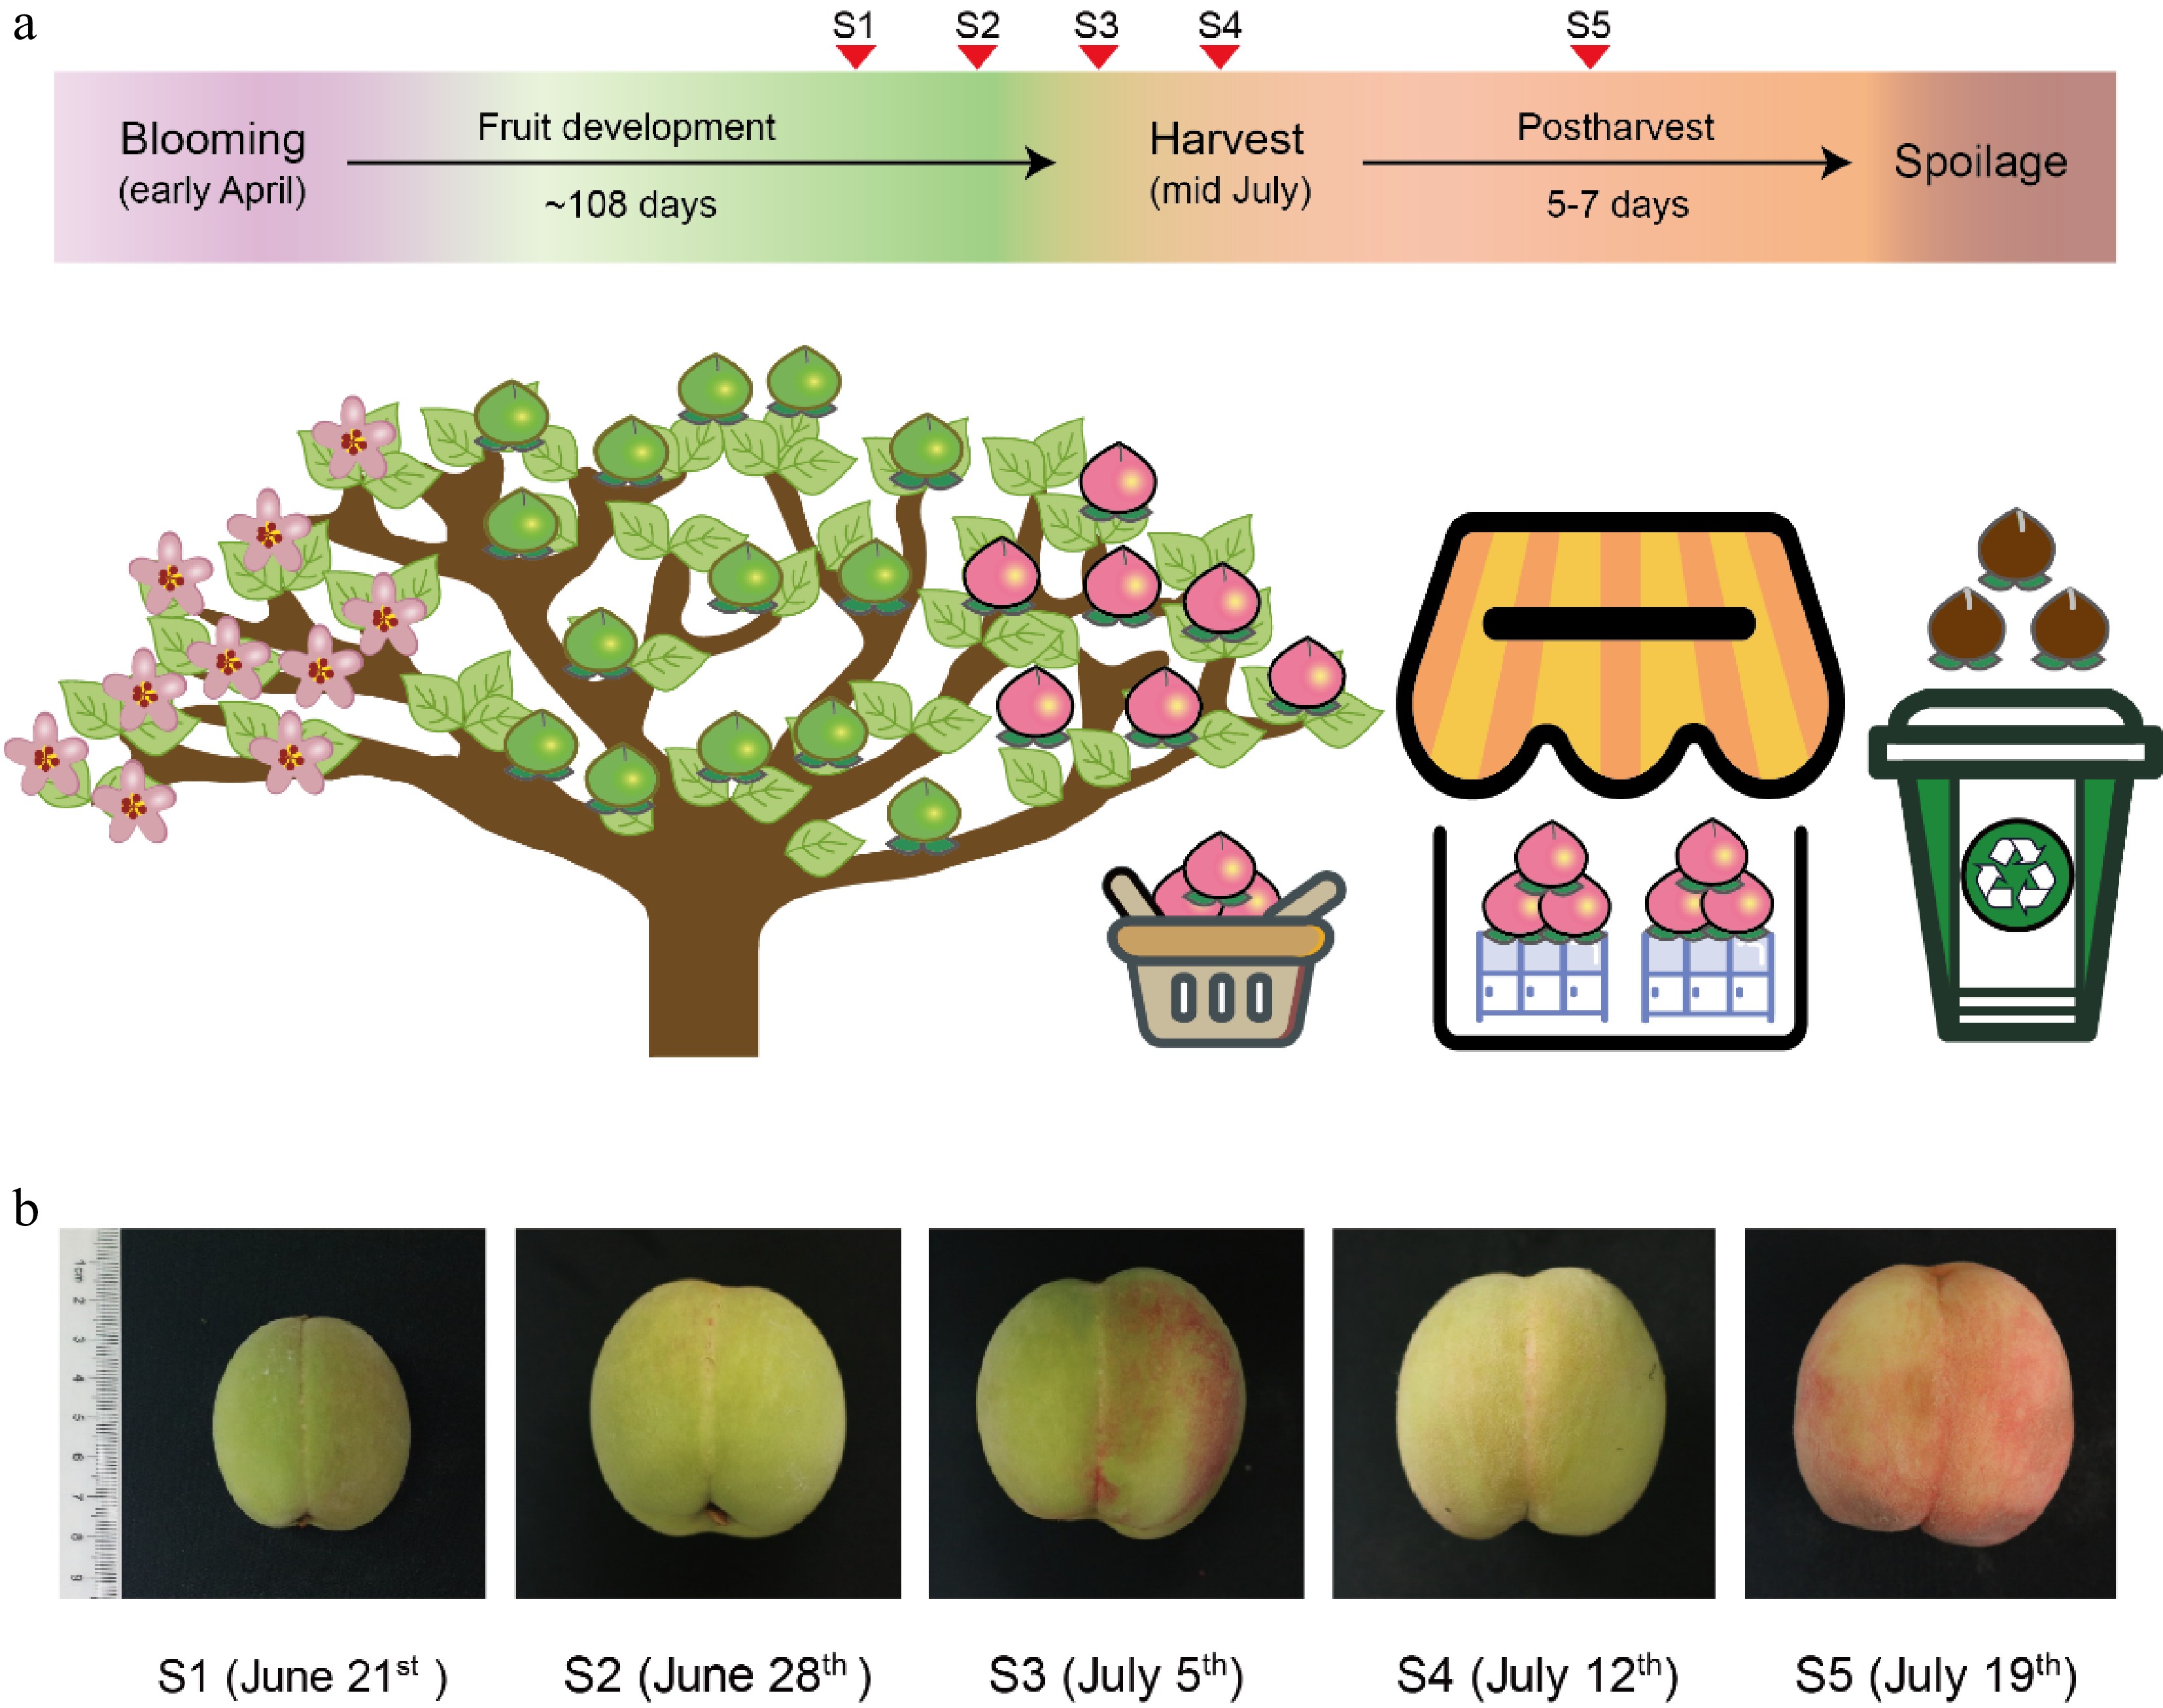
Figure 2. Peach fruit development and ripening. (a) Stages of fruit development before and after peach harvest. The red triangle markers show the time points of sample collection stages S1−S5. (b) Size and color of peach fruits at stages S1−S5 with the collection date shown in parenthesis.
-
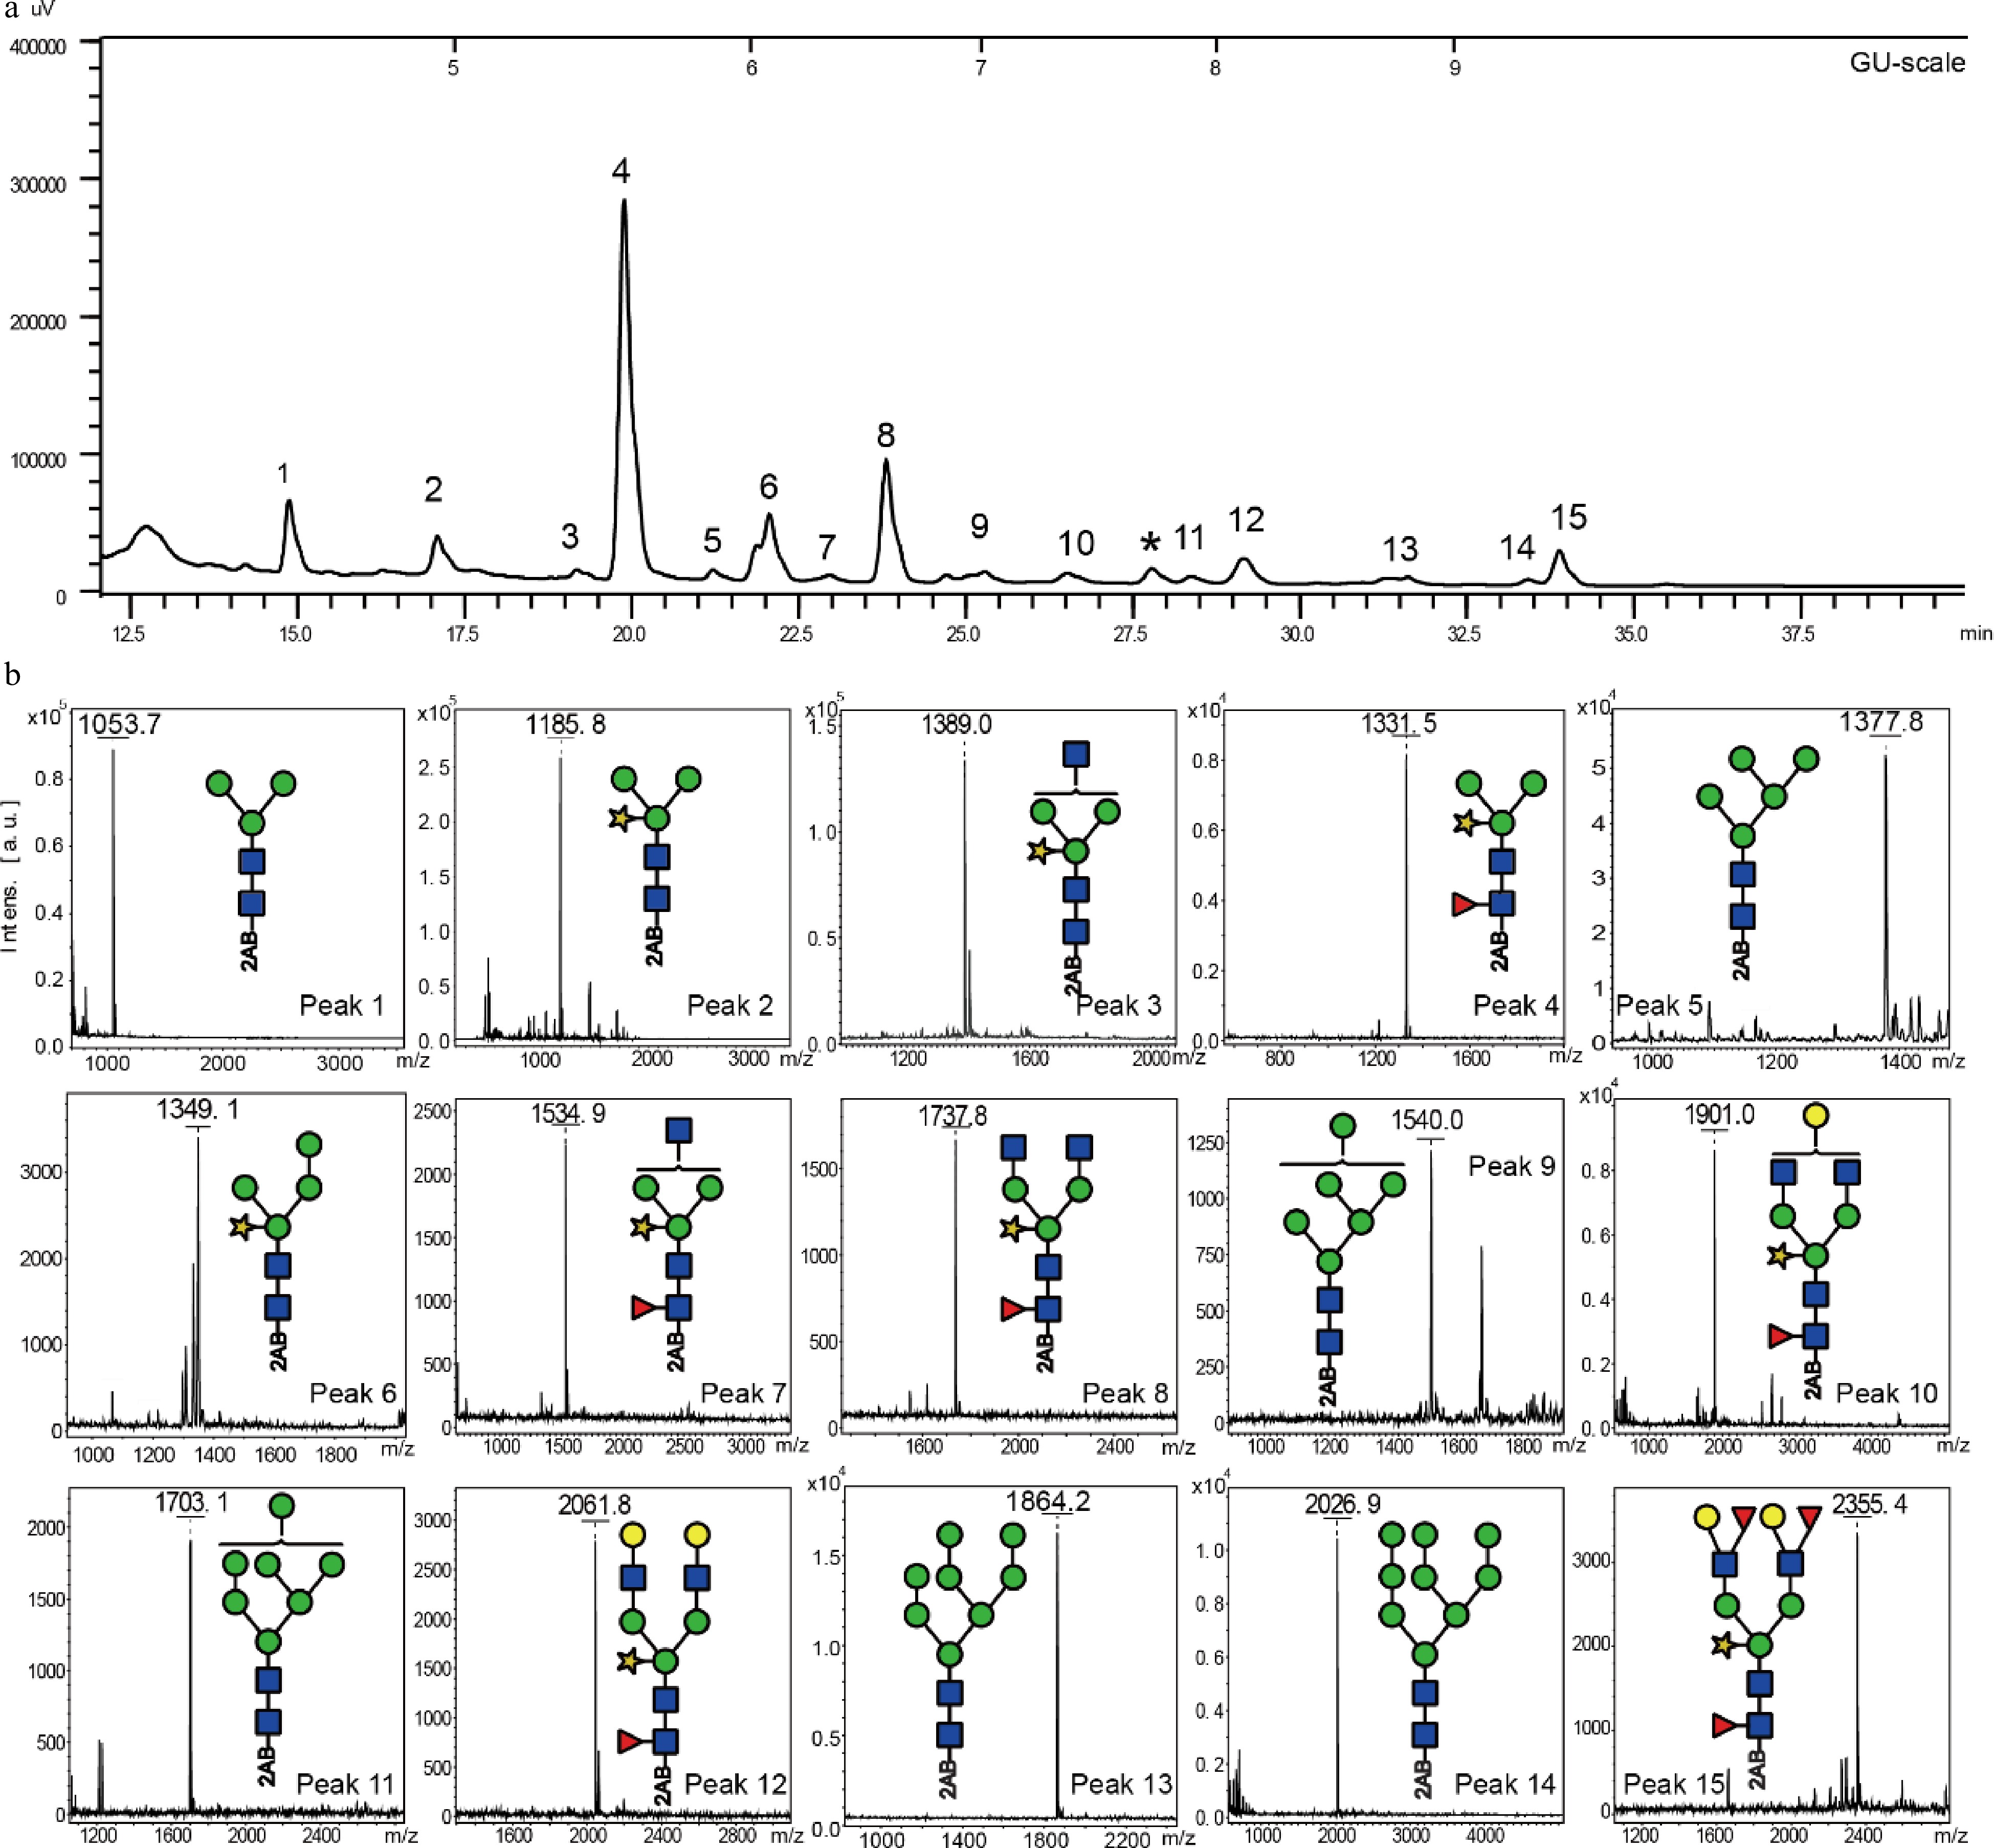
Figure 3. Analysis of peach N-glycans at stage S1. (a) Representative UPLC chromatogram of peach fruit N-glycans from stage S1. (b) MALDI-ToF mass spectra of the individual fractions 1−15. The peak fraction, * was determined as a non-N-glycan oligosaccharide corresponding by mass to Hex9 (m/z = 1618.06 [M+Na]+).
-
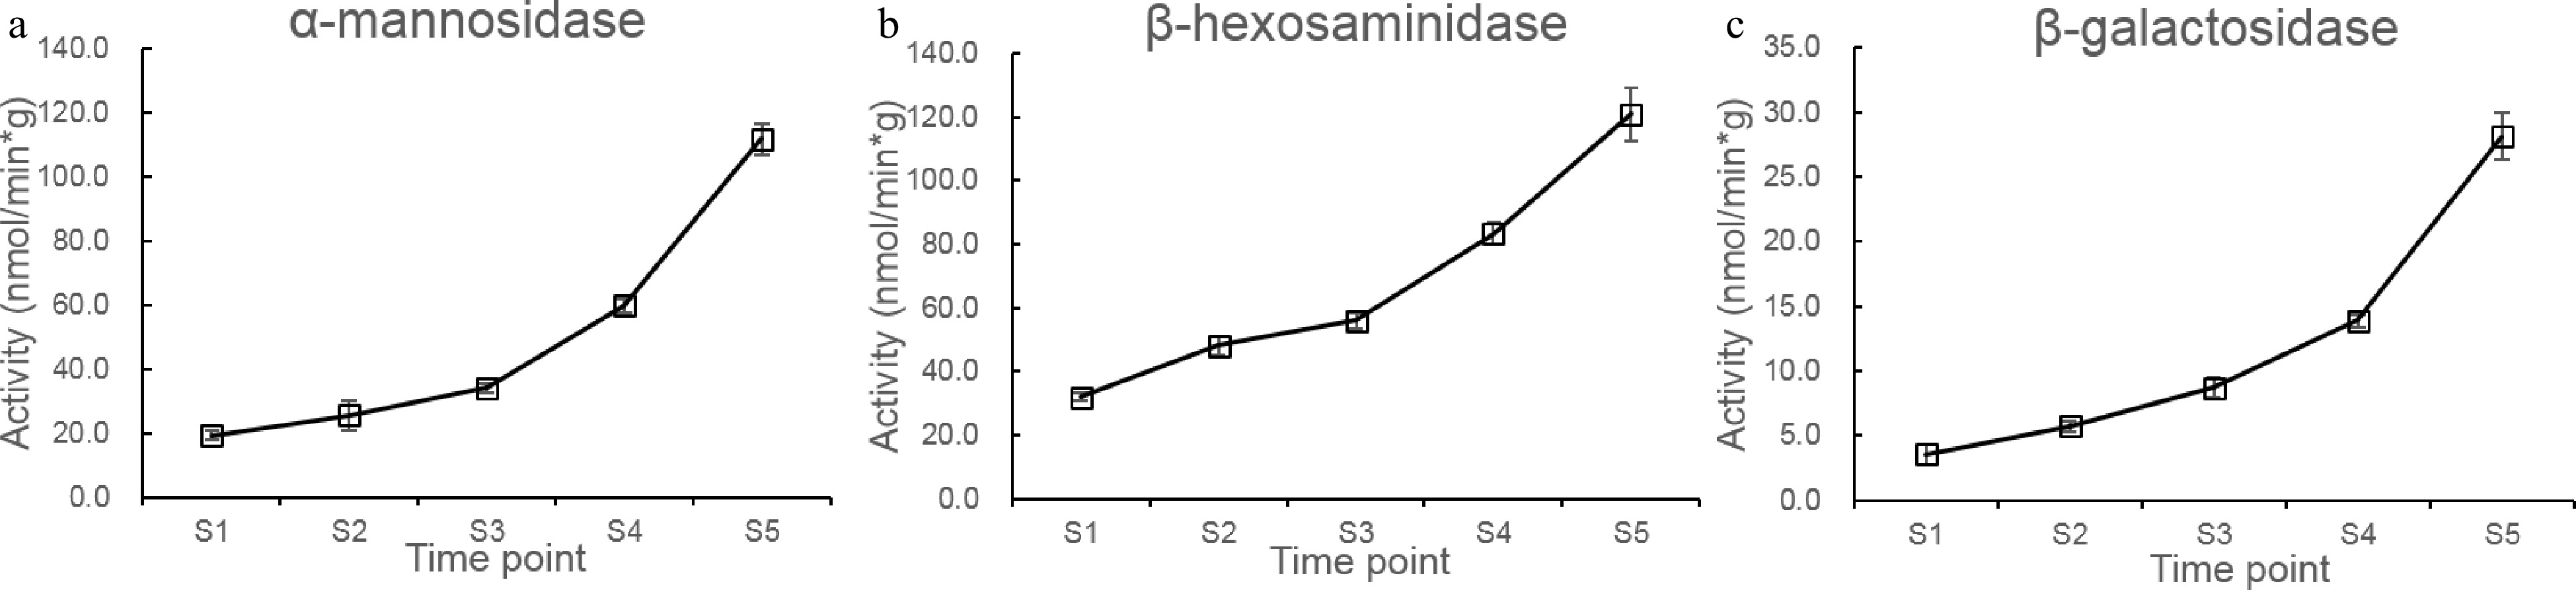
Figure 4. Changes in the exoglycosidase activities at stages S1 to S5. (a−c) changes of β-Hex, α-Man, and β-Gal activities at stages S1 to S5.
-
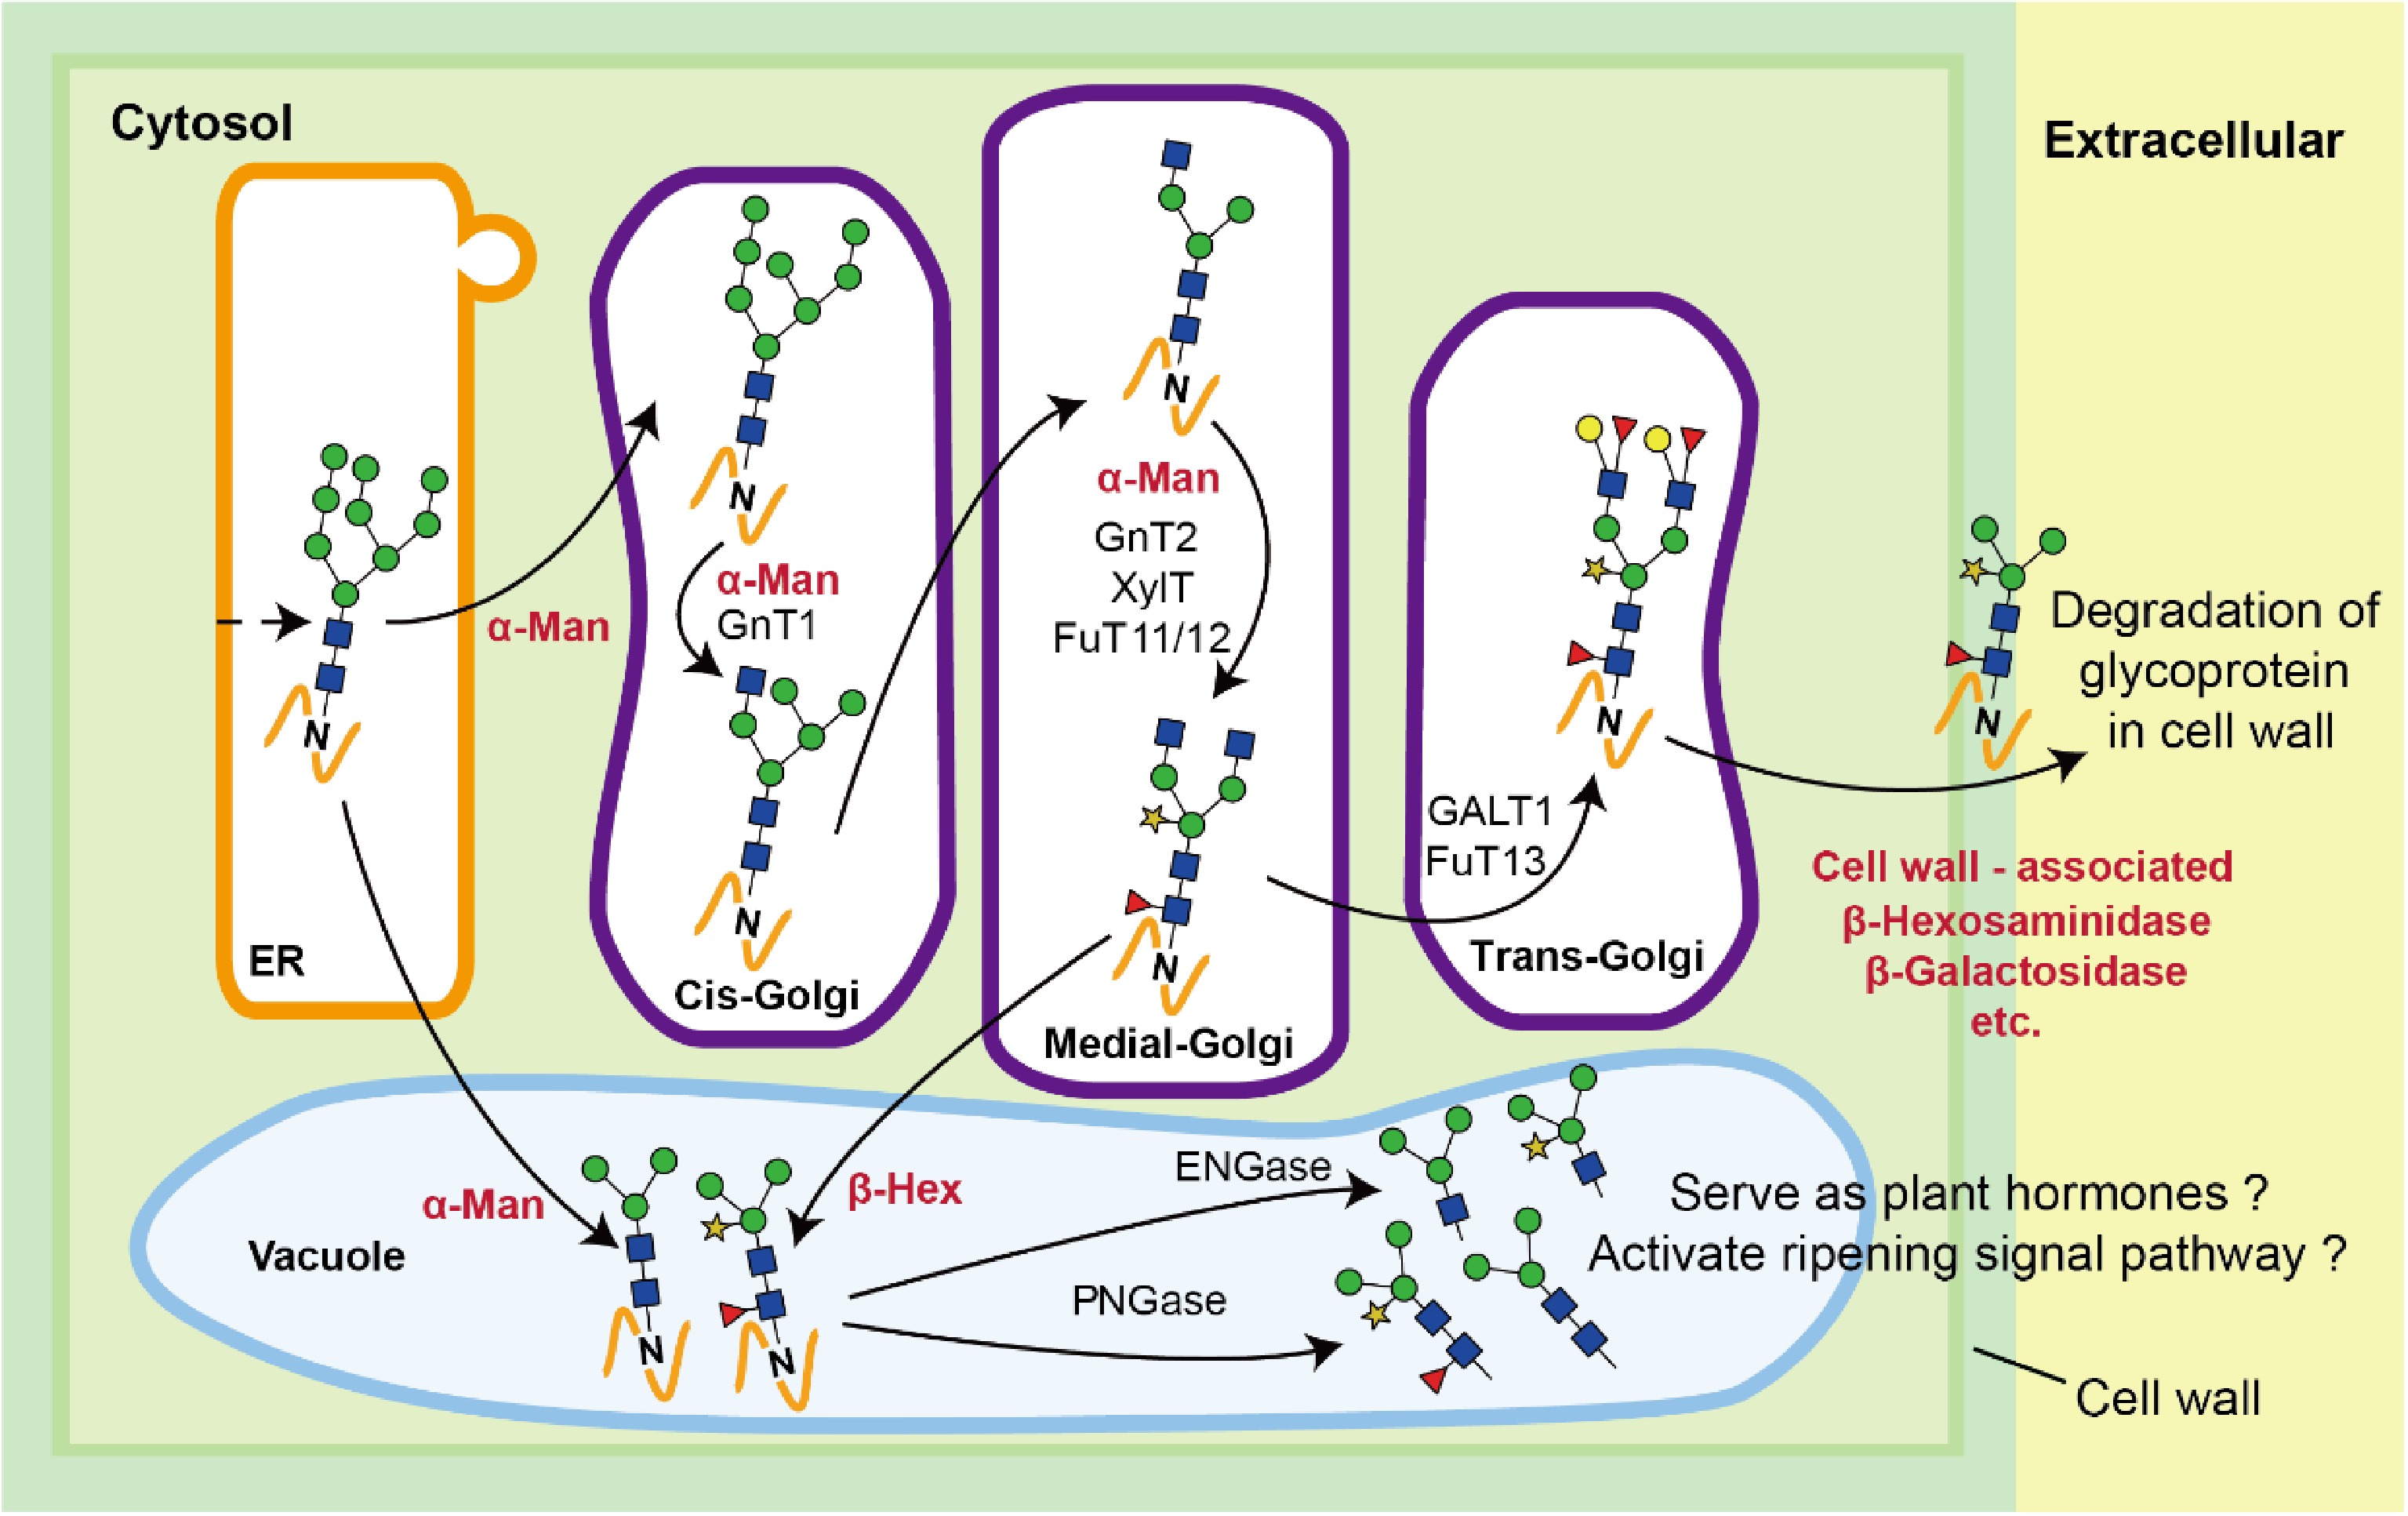
Figure 5. Schematic diagram of the regulatory mechanism of N-glycosylation in fruit ripening. PNGase, peptide N-glycosidase; ENGase, endo-β-N-acetylglucosaminidase; FuT11/12/13, α1,3/4-fucosyltransferase isoforms 11/12/13; XylT, xylosyltransferase; GalT1, galactosyltransferase isoform 1; GnT1/2, β1,2-N-acetylglucosaminyltransferase isoforms 1/2.
-
Peak number Retention time GU value Structure The theoretical electron charge-mass ratio (m/z) Detection value of charge-mass ratio (m/z) Name 1 14.90 4.33 1053.4 1053.7 M3 2 17.15 4.90 1185.4 1185.8 MMX 3 19.25 5.43 1388.5 1389.0 GnMX 4 19.97 5.62 1331.5 1331.5 MMXF 5 21.35 5.94 1377.5 1377.8 M5 6 22.18 6.18 1347.5 1349.1 M4X 7 23.11 6.39 1534.6 1534.9 GnMXF 8 23.98 6.63 1737.6 1737.8 GnGnMXF 9 25.48 7.00 1539.5 1540.0 M6 10 26.78 7.38 1899.7 1901.0 GGnGnXF 11 28.66 7.87 1701.9 1703.1 M7 12 29.45 8.15 2061.8 2061.8 GGXF 13 31.69 8.76 1863.7 1864.2 M8 14 33.79 9.47 2025.7 2026.9 M9 15 33.92 9.71 2353.9 2355.4 (GF)(GF)XF Note: Table 1. Overview of N-glycan structures determined in peach fruit sample S1.
-
Peak number N-glycans Relative content (%) S1 S2 S3 S4 S5 1 M3 7.1 ± 1.0b 10.3 ± 1.8a 6.1 ± 0.8b 5.9 ± 0.7b 4.8 ± 2.2b 2 MMX 6.8 ± 2.1a 7.1 ± 1.1a 6.0 ± 1.0a 7.7 ± 0.6a 6.4 ± 1.8a 3 GnMX 1.3 ± 0.1ab 1.5 ± 0.3a 1.0 ± 0.2bc 1.0 ± 0.1bc 0.7 ± 0.2c 4 MMXF 46.3 ± 4.4b 45.2 ± 1.4b 43.6 ± 1.0b 48.4 ± 1.6b 55.6 ± 5.1a 5 M5 1.1 ± 0.1a 1.3 ± 0.4a 1.5 ± 0.9a 1.5 ± 0.3a 0.9 ± 0.3a 6 M4X 10.1 ± 2.0a 8.5 ± 1.0ab 7.8 ± 0.1b 9.6 ± 0.3ab 9.9 ± 0.6a 7 GnMXF 0.9 ± 0.2a 1.5 ± 0.9a 1.2 ± 0.2a 0.6 ± 0.1a 0.8 ± 0.2a 8 GnGnMXF 14.2 ± 1.5a 14.7 ± 0.4a 14.6 ± 0.6a 10.9 ± 1.7b 9.1 ± 0.6b 9 M6 1.7 ± 0.2b 3.0 ± 0.4a 2.2 ± 0.4ab 3.2 ± 1.1a 2.8 ± 0.3a 10 GGnGnXF 2.1 ± 0.3a 1.7 ± 0.5a 1.7 ± 0.1a 1.6 ± 0.1a 1.6 ± 0.2a 11 GGXF 3.6 ± 1.4a 0.7 ± 0.2b 1.3 ± 0.2b 1.5 ± 0.8b 1.6 ± 0.3b 12 M7 1.0 ± 0.5c 2.5 ± 0.5b 4.9 ± 0.5a 3.3 ± 0.6b 2.6 ± 0.2b 13 M8 0.6 ± 0.3b 0.3 ± 0.1b 1.1 ± 0.1a 1.0 ± 0.2a 0.5 ± 0.1b 14 M9 0.7 ± 0.4ab 0.4 ± 0.1b 1.1 ± 0.3a 0.8 ± 0.5ab 1.0 ± 0.2ab 15 GFGFXF 2.6 ± 1.5b 1.5 ± 0.3b 6.0 ± 1.4a 2.9 ± 0.5b 2.3 ± 0.2b The relative content of each N-glycan is expressed as mean ± SD (n = 3). Different letters indicate significant differences (p < 0.05) in the relative content of N-glycans among different stages. Table 2. The relative contents of different N-glycans from peach fruit at stages S1−S5.
-
Peak number N-glycans R value β-Hex α-Man β-Gal 1 M3 NC −0.68ns NC 2 MMX −0.03ns −0.09ns NC 3 GnMX −0.86ns NC NC 4 MMXF 0.89* NC NC 5 M5 NC −0.42ns NC 6 M4X NC 0.41ns NC 7 GnMXF −0.57ns NC NC 8 GnGnMXF −0.94* NC NC 9 M6 NC 0.48ns NC 10 GGnGnXF NC NC −0.64ns 11 GGXF NC NC −0.26ns 12 M7 NC 0.11ns NC 13 M8 NC −0.06ns NC 14 M9 NC 0.52ns NC 15 GFGFXF NC NC −0.13ns NC: not calculated; ns: no significant difference. Table 3. The Pearson's correlation analysis of N-glycan relative contents and exoglycosidase activities.
Figures
(5)
Tables
(3)