-
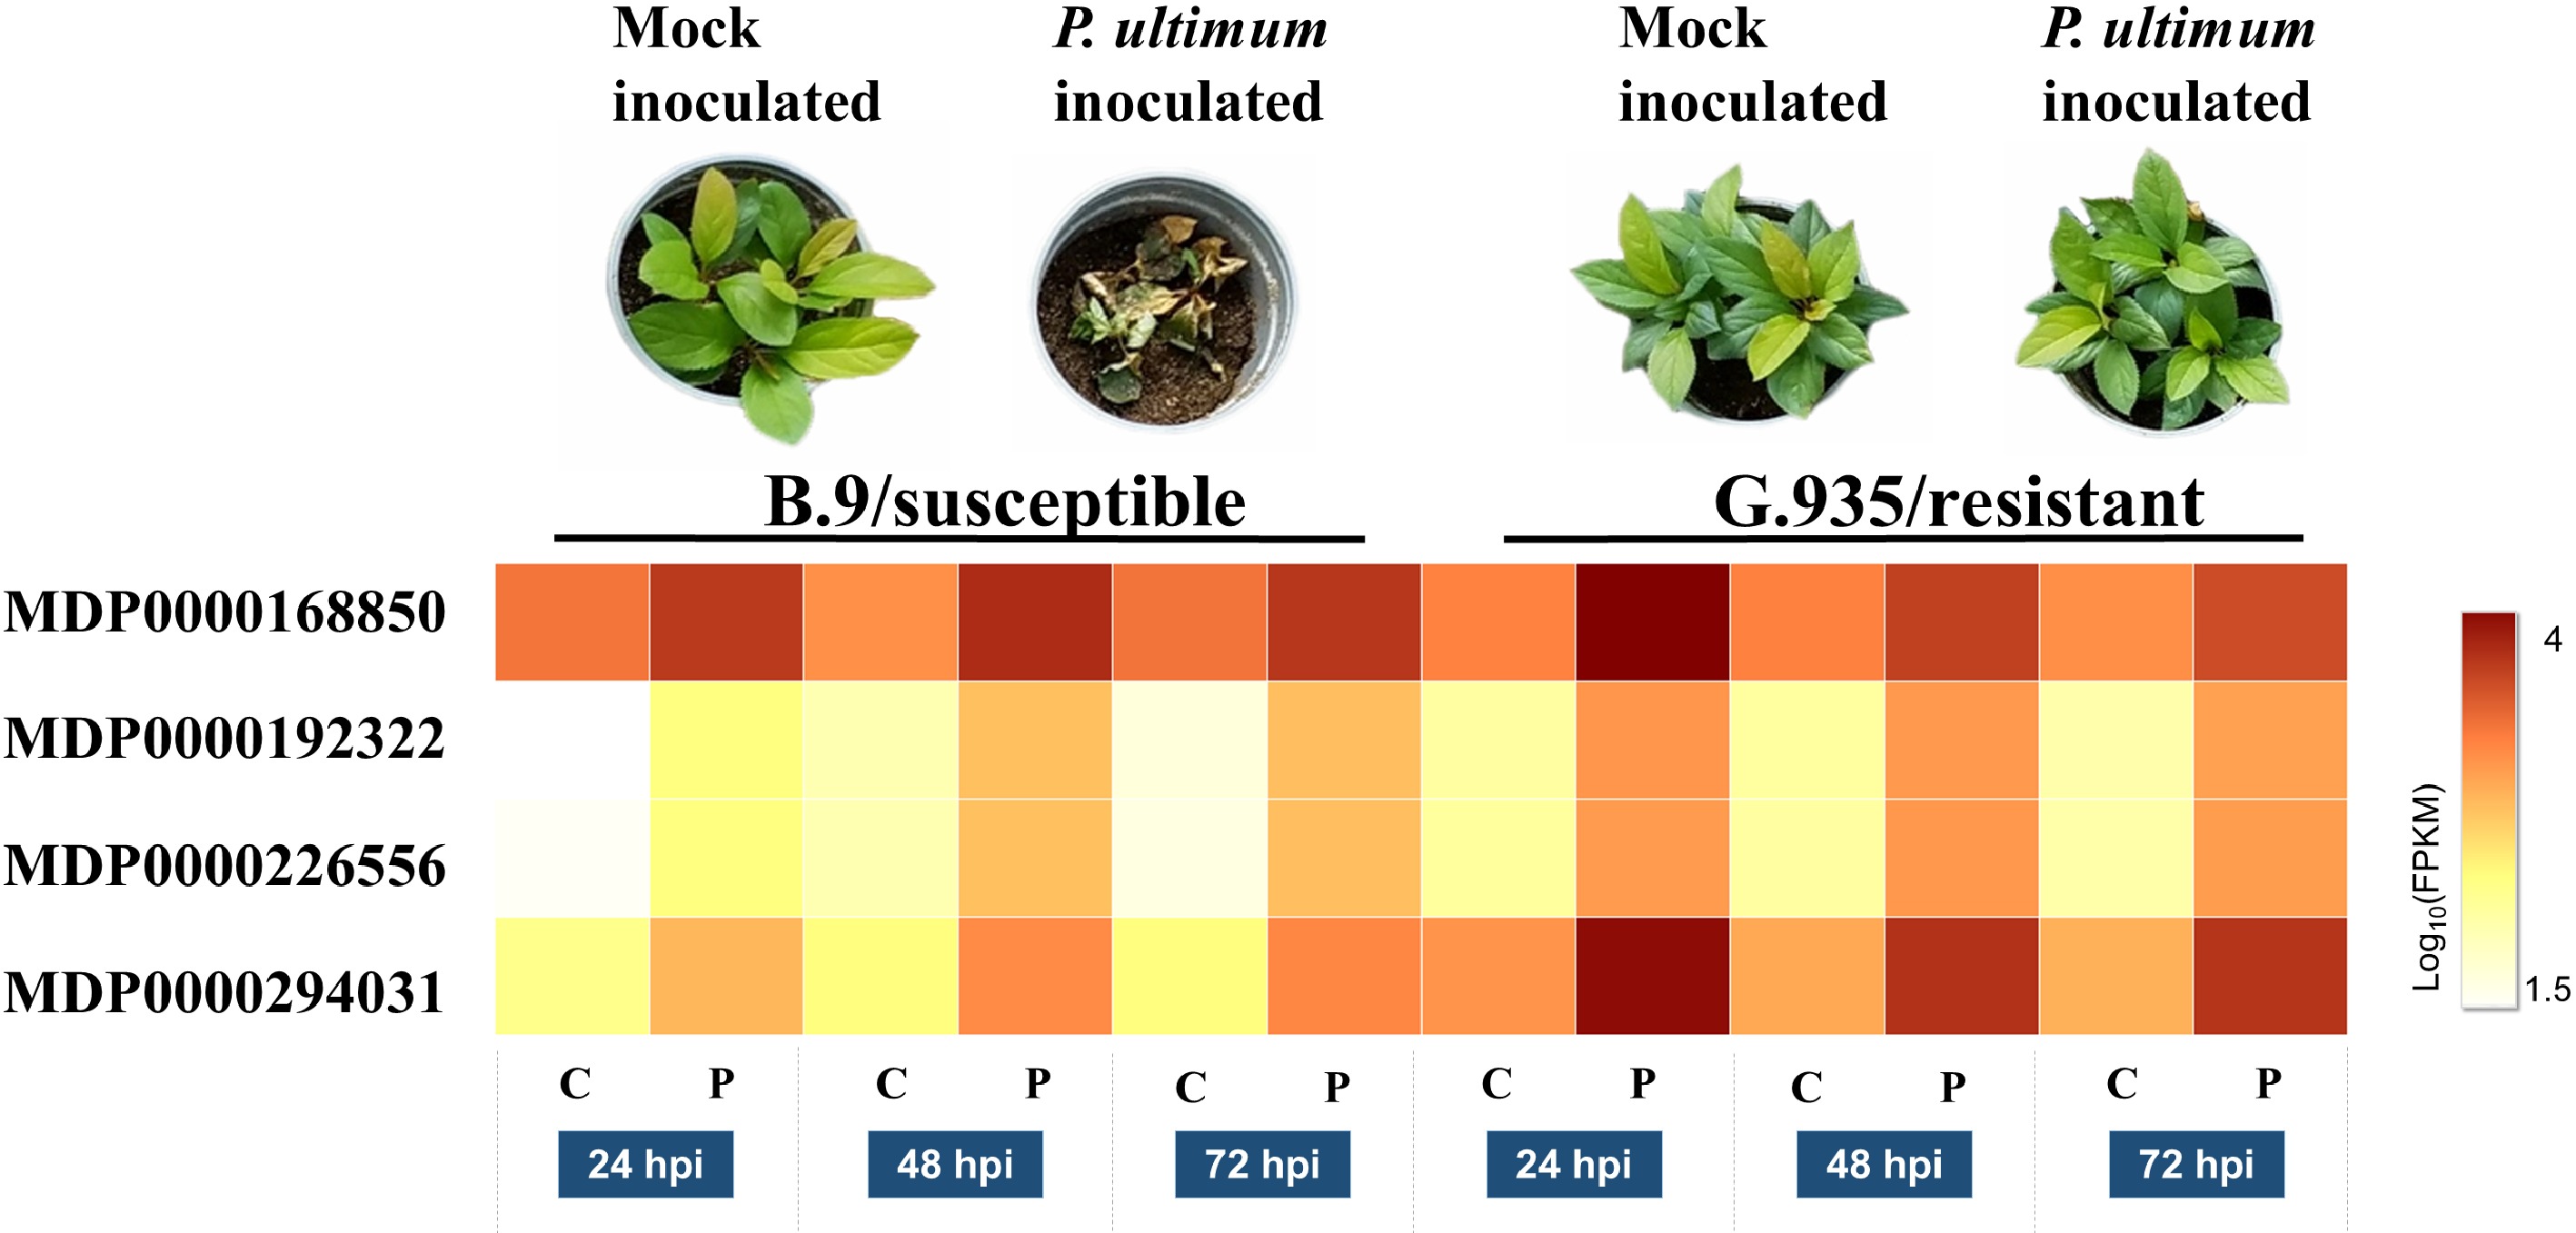
Figure 1. Expression levels of four gene models which encode MdLAC7s in apple root. Images in the top panel shows the resistance phenotypes at 7 dpi for both susceptible B.9 and resistant G.935 apple rootstock genotypes. The heatmap demonstrates the normalized transcript levels between mock inoculated roots (C for control) and P. ultimum inoculated (denoted as P) at three time points of 24, 48 and 72 h post inoculation (hpi) for all four gene models. The levels of expression per genotype/treatment are indicated as the coloration according to legend. The functional annotations of these four genes are according to predicted coding genes of the Malus × domestica Whole Genome v3.0.a1 (www.rosaceae.org/analysis/162).
-
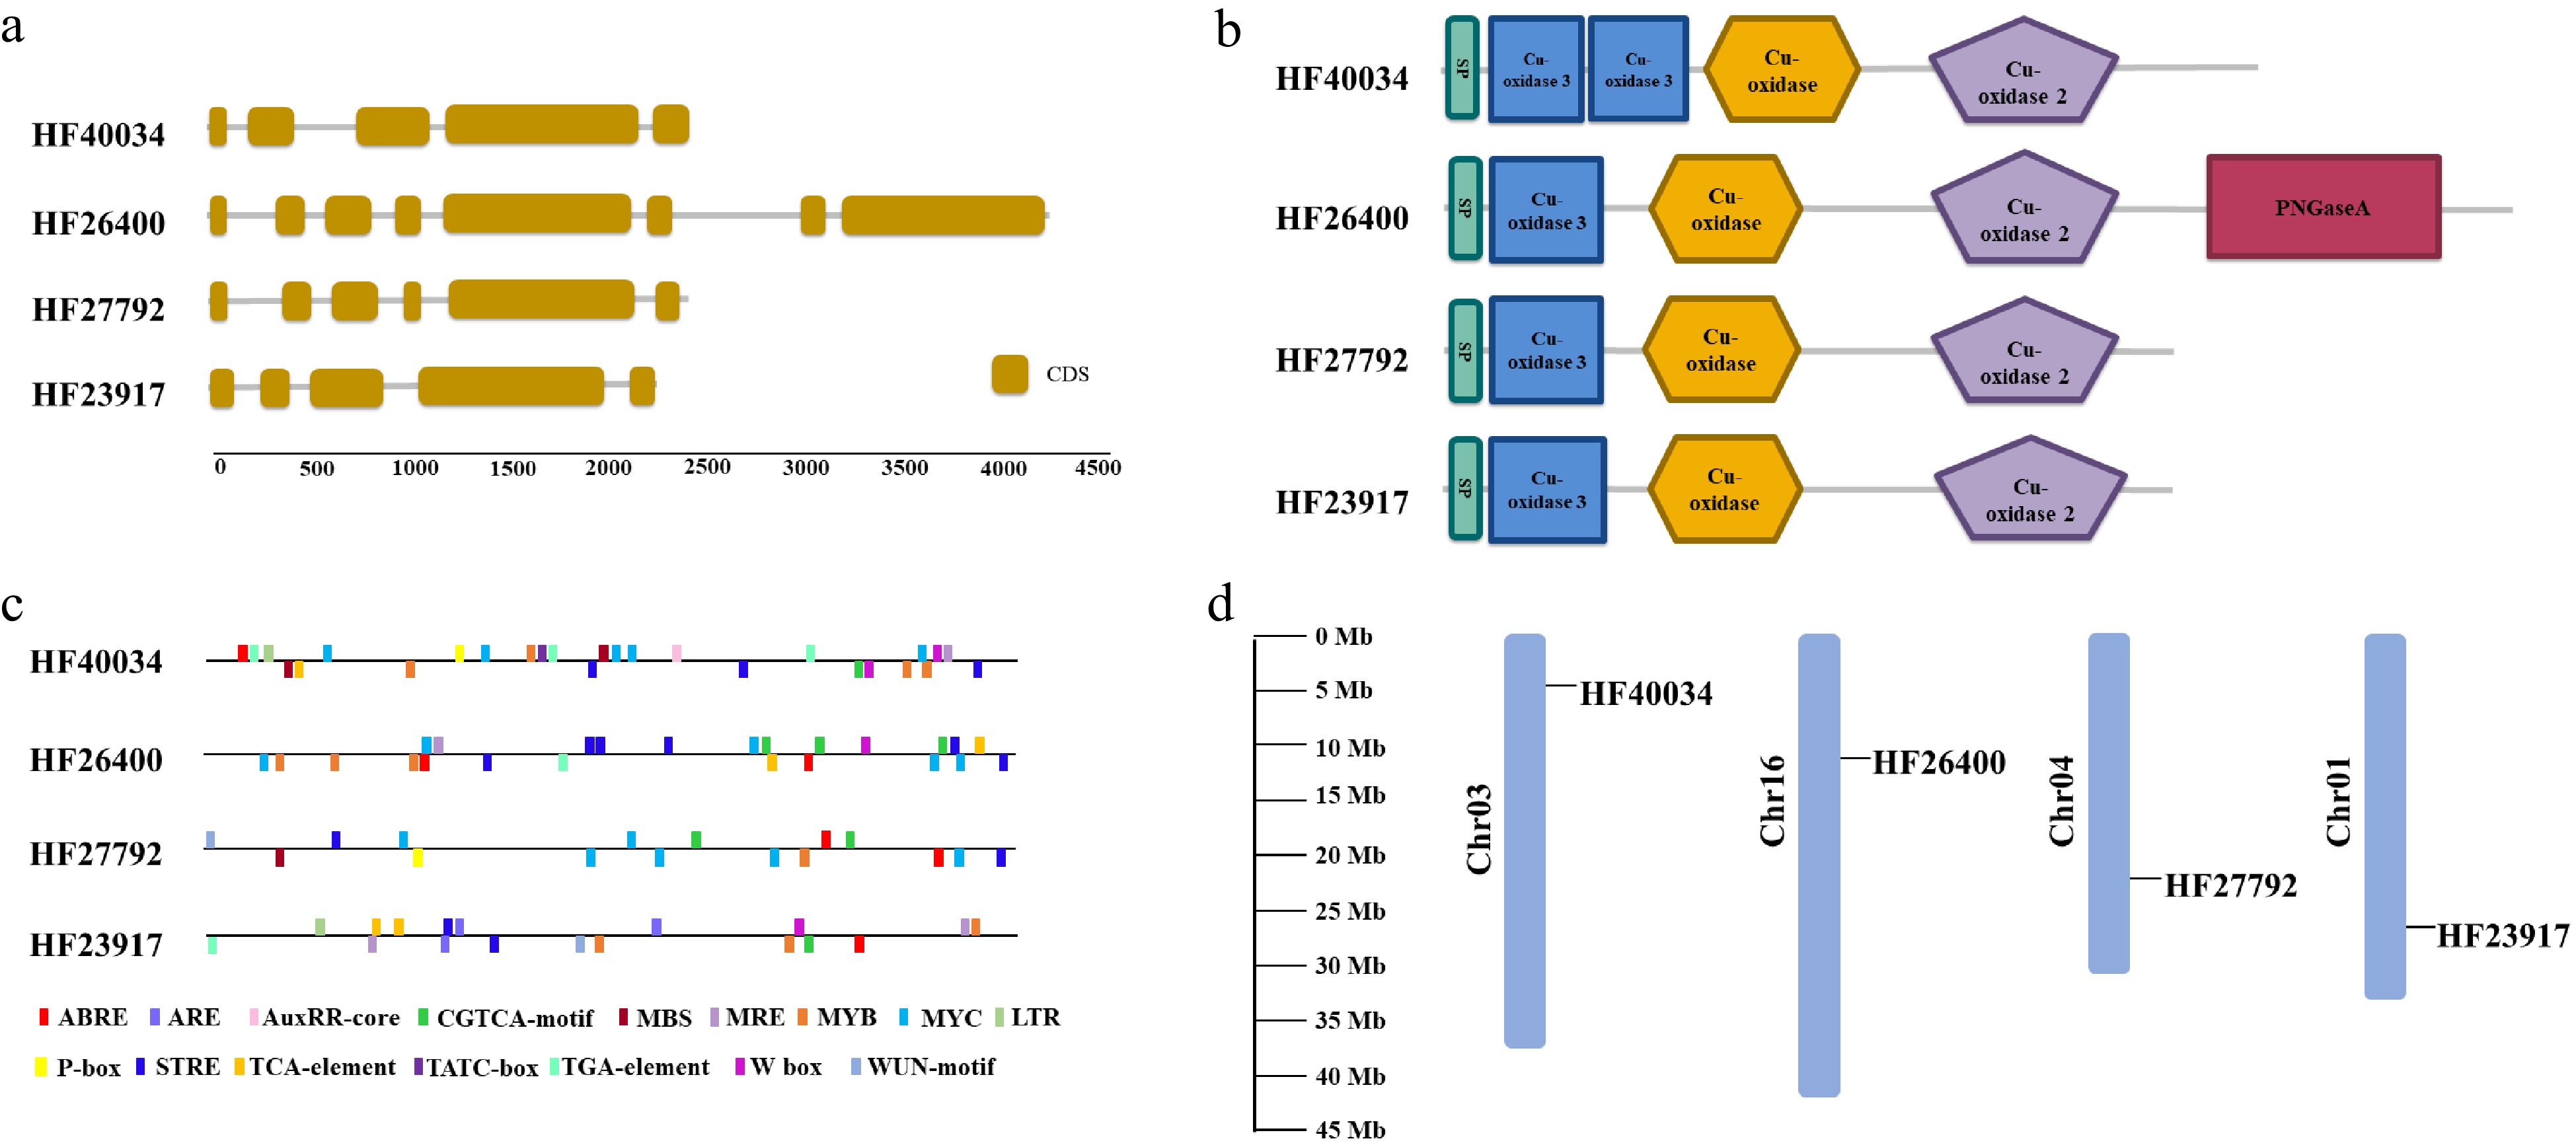
Figure 2. Bioinformatic characteristics of root-expressed apple laccase genes. (a) Numbers and position of introns and exons for each gene. (b) Domain composition contained in their predicted amino acid sequences. (c) Cis elements within 2 Kb of promoter sequences. (d) Location of these laccase encoding genes on apple chromosomes.
-
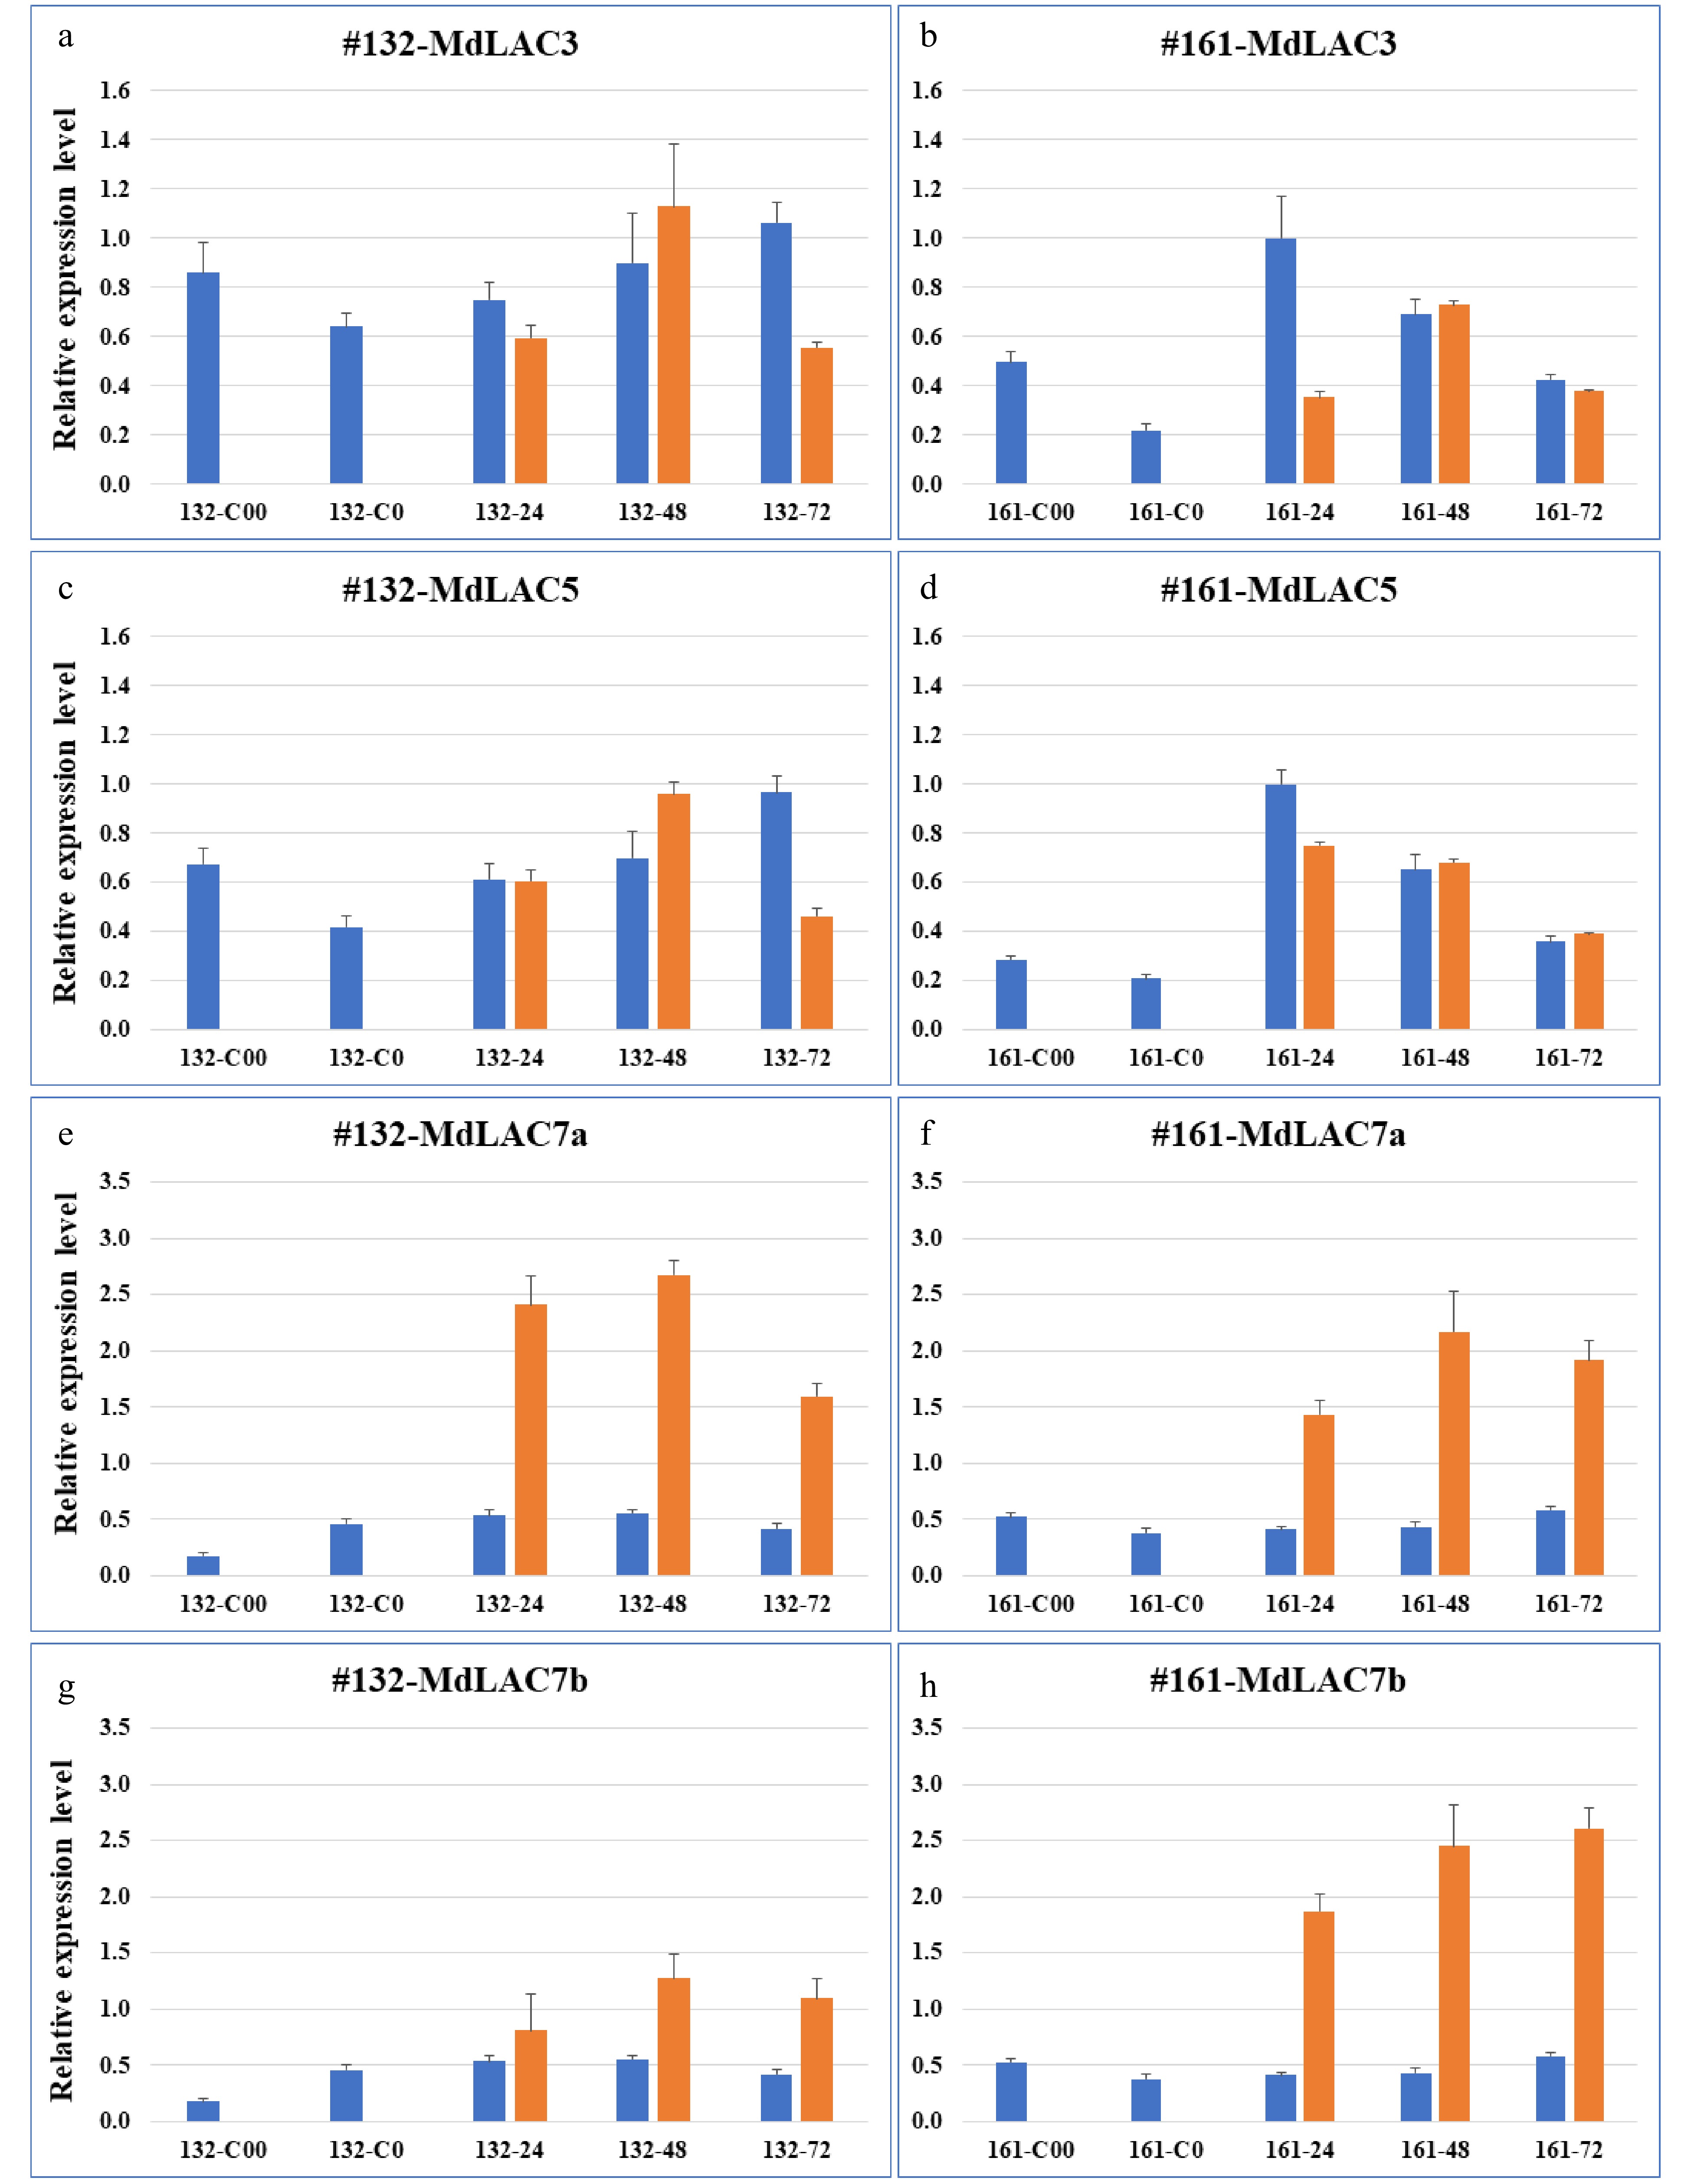
Figure 3. Expression patterns of four apple laccase genes in roots of two apple rootstock genotypes. The left panels, (a, c, e & g) denote the expression of MdLAC3, MdLAC5, MdLAC7a and MdLAC7b, respectively, in root tissue of a susceptible O3R5-#132; The right panels, (b, d, f & h) denote the expression of MdLAC3, MdLAC5, MdLAC7a and MdLAC7b, respectively, in root tissue of a resistant O3R5-#161. Blue bars represent expression level in mock-inoculated control tissues; and orange bars represent expression levels in P. ultimum-infected root tissues. Values on the Y-axis denote the relative expression level, using value of control tissue for MdLAC3 at 161-24 hpi as a calibrator. Labels on the X-axis indicate the tissue collection including five time points for control tissues and three timepoints after P. ultimum inoculation. For each genotype, C00 denotes the root tissues in culture medium (or two weeks before inoculation), and C0 denotes root tissue after one-week in-soil acclimation or one week before mock inoculation. The numbers of 24, 48 and 72 indicate the timepoints of hours post (mock- or P. ultimum) inoculation (hpi). Values represents the averages and sd of three technical repeats of qRT-PCR analyses for each of the two biological replicates.
-
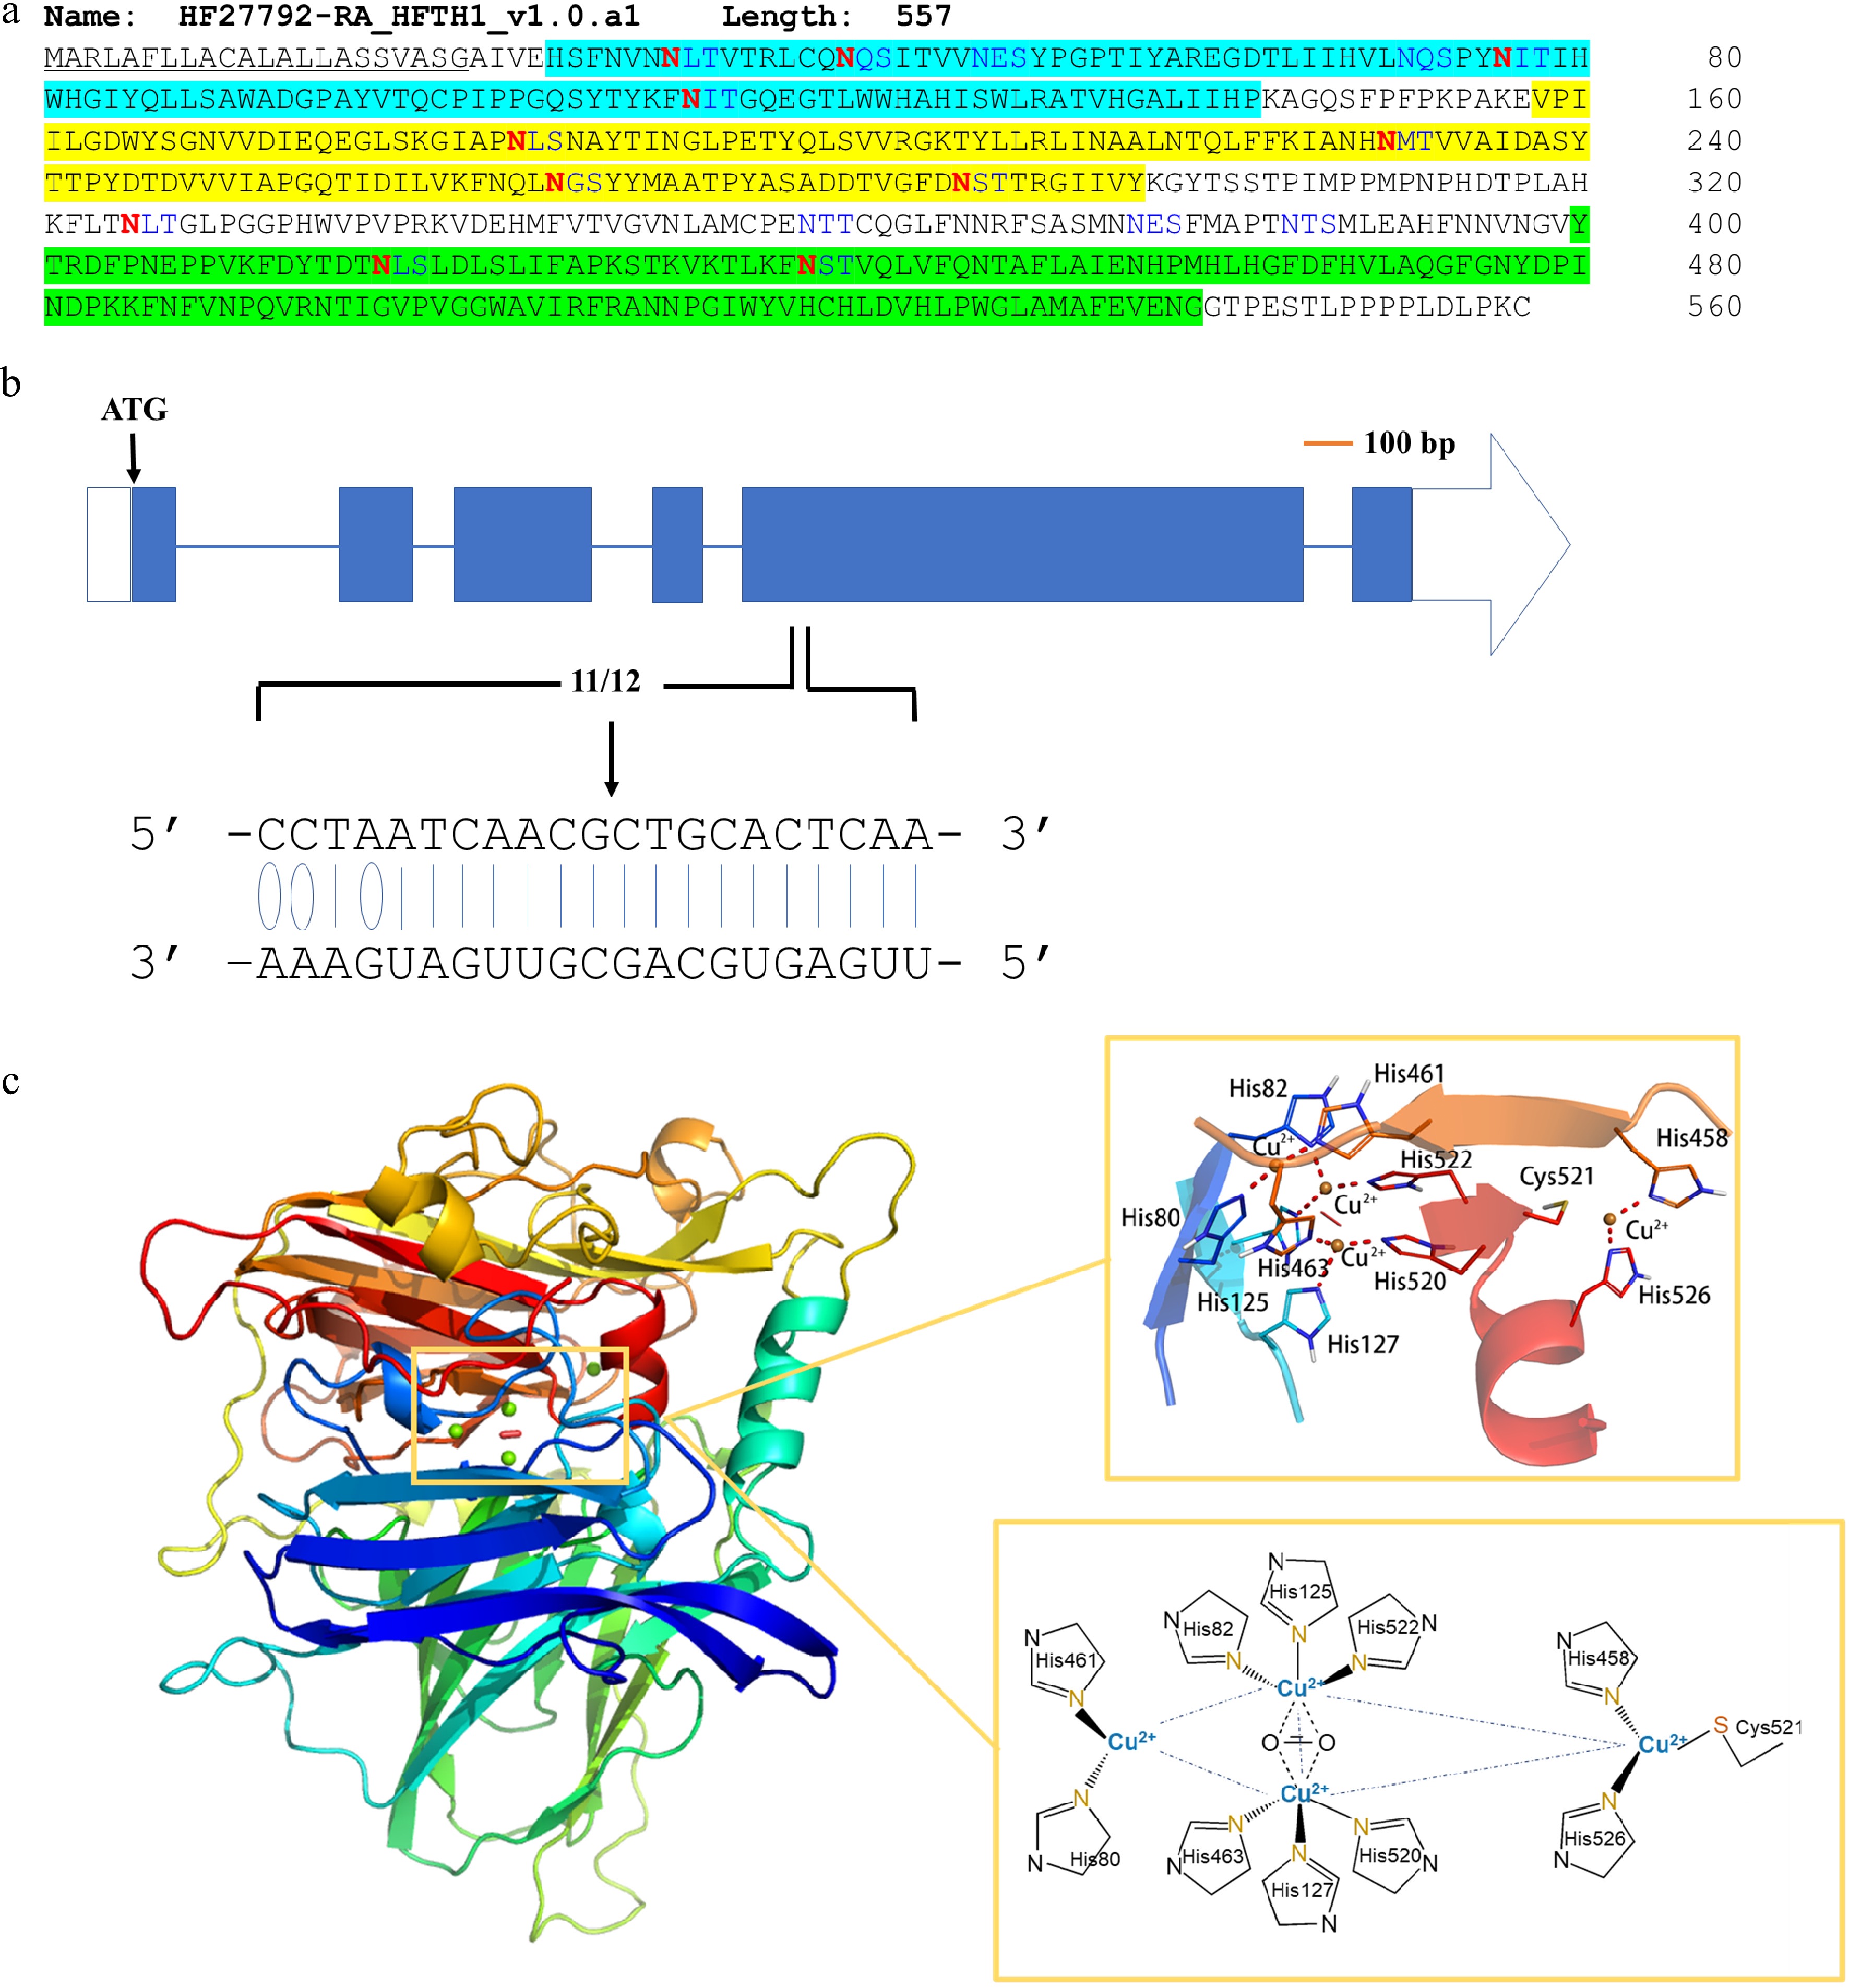
Figure 4. Sequence features and structure modeling of MdLAC7b. (a) The amino acid sequence of MdLAC7b. The protein consists of 557 amino acids. It has a signal peptide (underlined) at the N-terminal predicted by SignalP 4.1 Server, and three conserved Cu-oxidase domains were identified (highlighted in blue, yellow and green, respectively) according to Pfam. Twelve asparagines predicted to be N-glycosylated by NetNGlyc 1.0 Server were indicated in red. (b) The specificity of MiR397b mediated cleavage of MdLAC7b transcript was revealed by degradome sequencing in a previous study[8]. The blue boxes represent exons, and the horizontal lines represent introns. The white box represents 5′-UTR, while the white arrow represents 3′-UTR. Solid lines indicate the Watson–Crick pairing and the oval indicates G:U wobble pairing between MdLAC7b target sequence and the complementary miRNA397b sequence. (c) Left panel, three-dimensional structure of MdLAC7b predicted using Discovery studio 4.1 software. Upper right panel, the view of ligands at the copper center of MdLAC7b. Lower right panel, Cu1 is coordinated with two histidines, one cysteine and one leucine, Cu2 is coordinated by another two histidines and one H2O ligand, while six histidines coordinate the Cu3 pair in a symmetrical manner, with a bridging OH ligand.
-
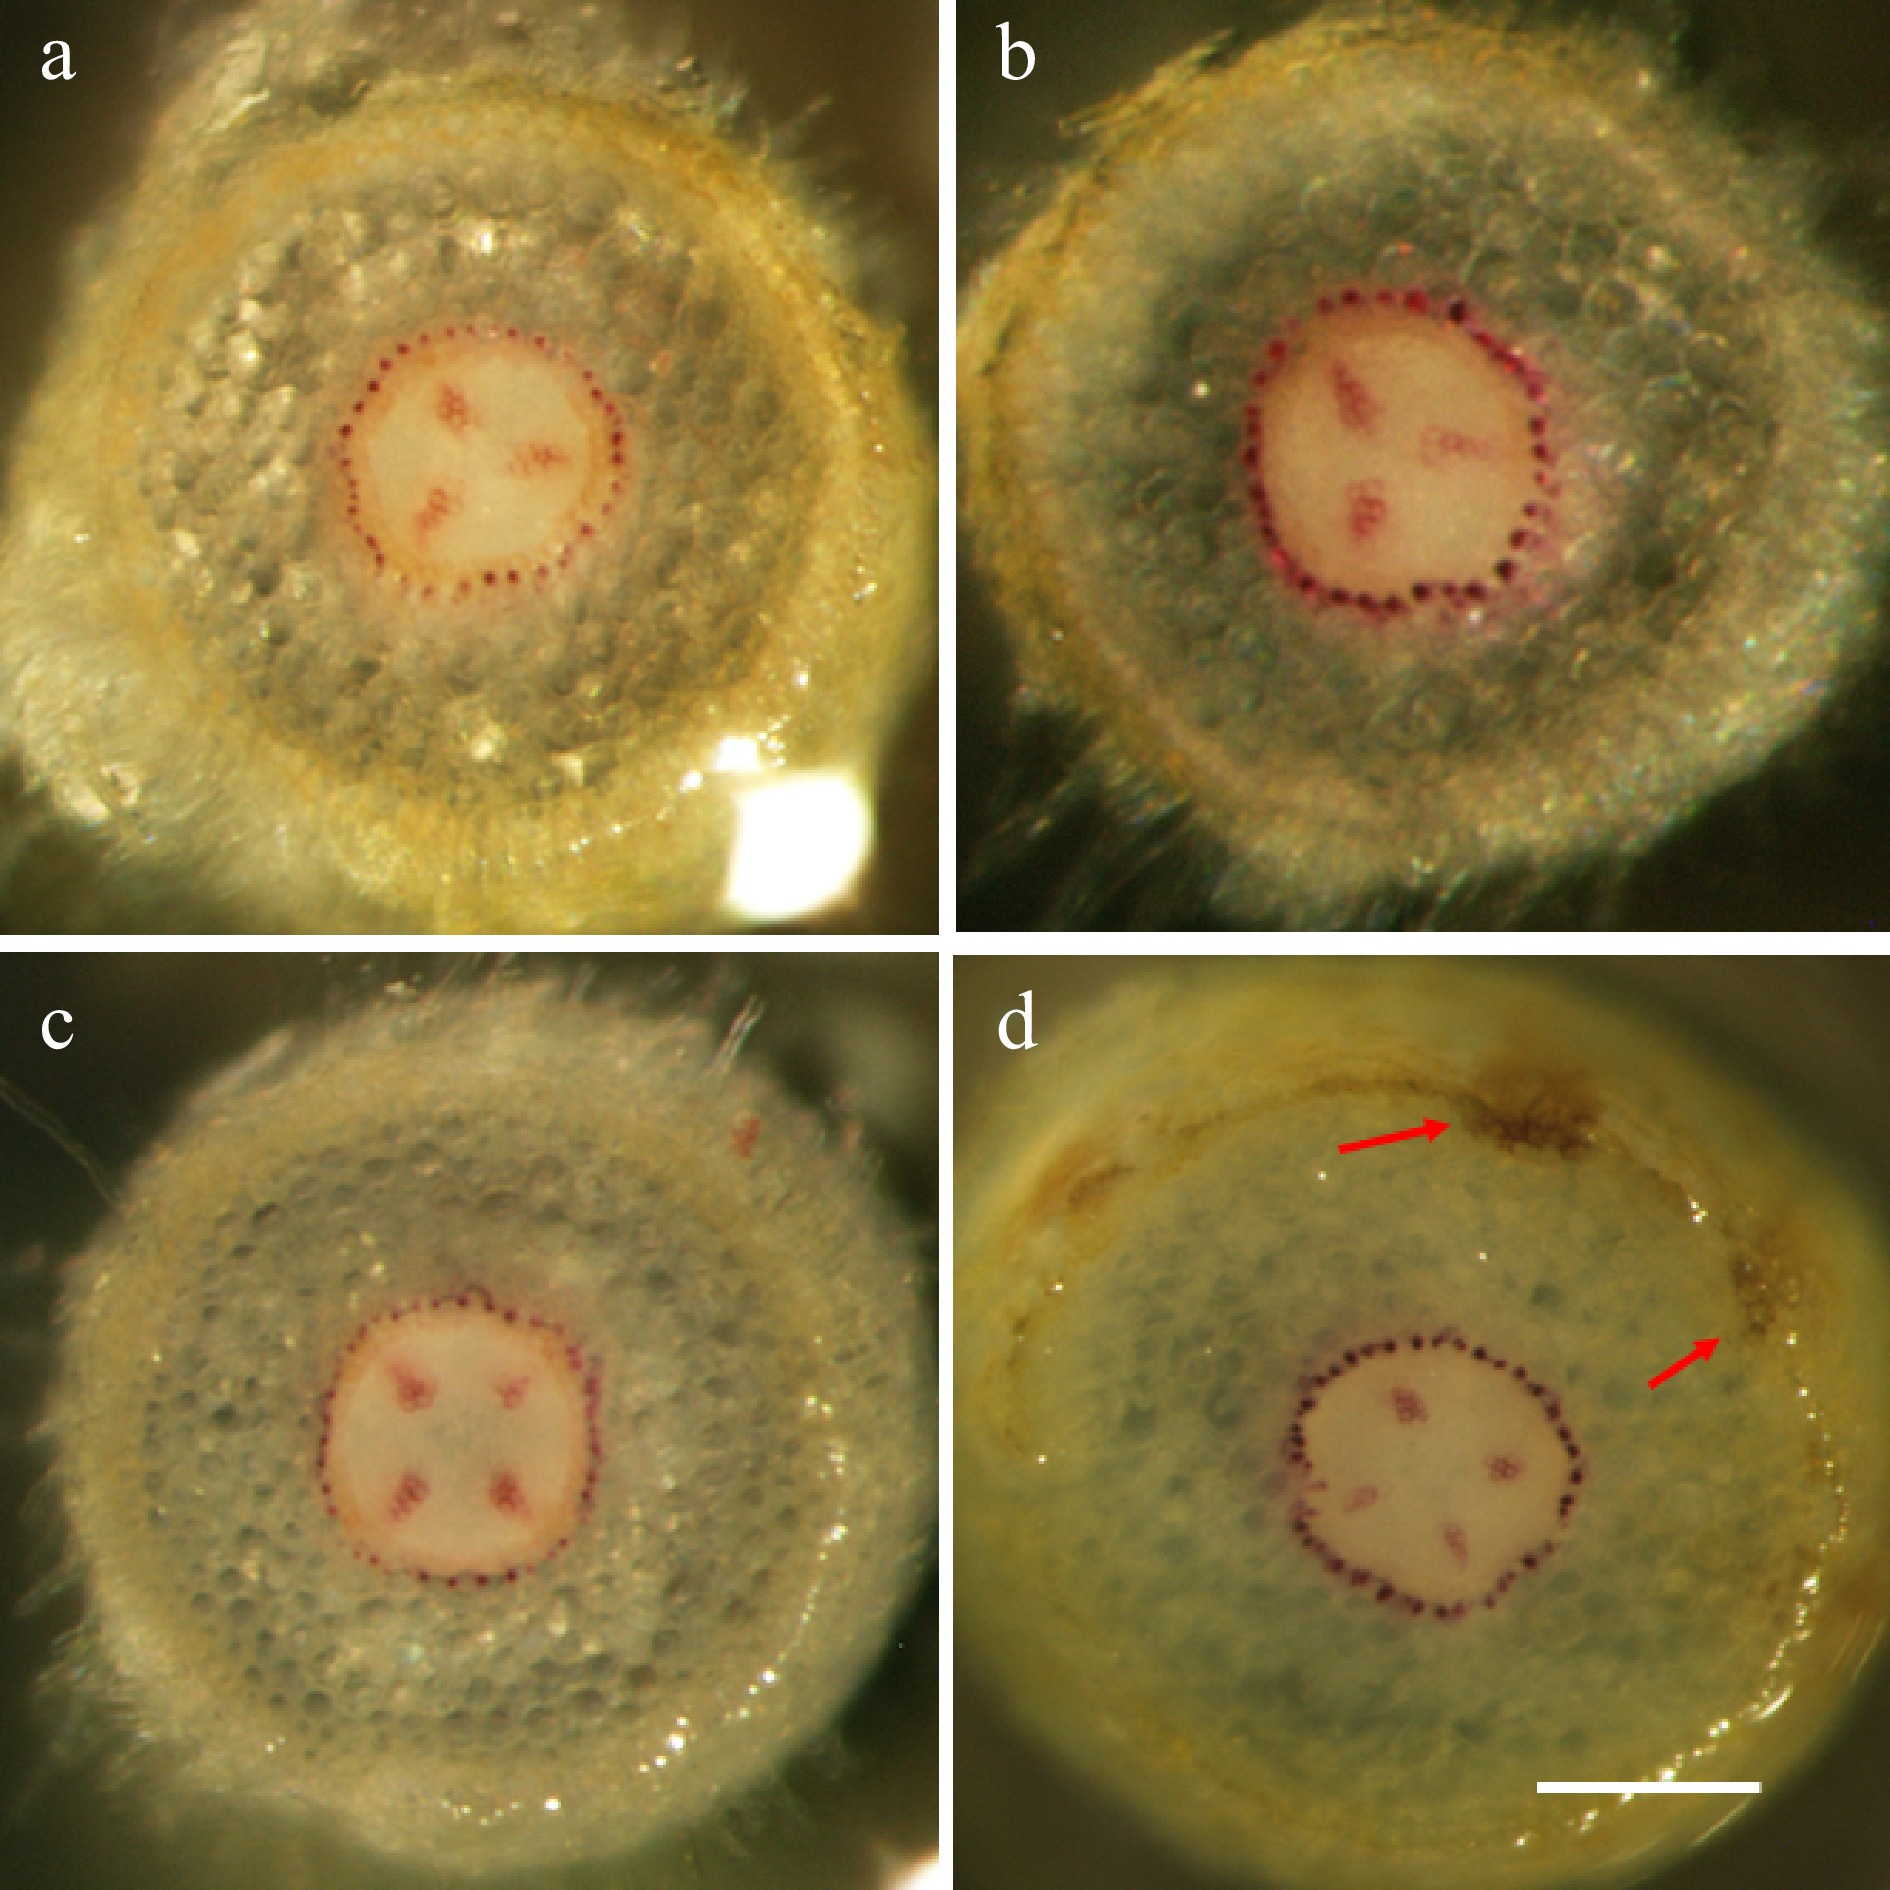
Figure 5. The genotype-specific patterns of lignification in apple root tissues. Wiesner staining of hand-sectioned root tissue was carried out at 72 hpi on selected root branches from both treatments (mock-inoculation and P. ultimum infection) and for both genotypes. (a) The representative image from a susceptible cultivar O3R5-#132 with mock-inoculation; (b) The representative image from a susceptible cultivar O3R5-#132 after P. ultimum inoculation; (c) The representative image from a resistant cultivar O3R5-#161 with mock-inoculation; (d) The representative image from a resistant cultivar O3R5-#161 after P. ultimum inoculation. Root segments at a similar position, or equal distance from the root tip, were selected for sectioning for a better comparison between treatments and genotypes. The bar at the lower part of panel (d) represents a length of 100 µm.
-
Gene ID Annotation Targeted by Relative cleavage intensity L1 L2 L3 HF40034 MdLAC 3 miR397b 15 N/A N/A HF23917 MdLAC 5 miR397b 2 11 N/A HF26400 MdLAC 7a miR397b 30 N/A N/A HF27792 MdLAC 7b miR397b 45 N/A 82 Table 1. Laccase genes targeted by specific microRNA397b during P. ultimum infection by degradome sequencing and microRNA profiling.
-
Gene IDs Gene description Primers F/R [5'-3'] HF40034 Laccase-3 F-5' CAACCCCAGAACAGATCCAG 3'
R-5' AAACCCAGGAAGAGATGTGC 3'HF23917 Laccase-5 F-5' TGGGCAGTCATTCGATTTGT 3'
R-5' AACAAAGAGGCAGATCCACC 3'HF26400 Laccase-7a F-5' TAATCCGCAAGTACGCAACA 3'
R-5' CAGATCAAGTGGTGGTGGAG 3'HF27792 Laccase-7b 5'- TCCTACACGACTCCTTATGAT -3'
5'- GAGATTGGTGAGGAACTTATGG -3'MD02G1221400 Reference gene F-5' ATGGAGAGATGGAATGGCAAAG 3'
R-5' GTGAGCATCGGATCCCATTTAG 3'Table 2. Primer sequences of laccase and reference genes for qRT-PCR analysis.
Figures
(5)
Tables
(2)