-
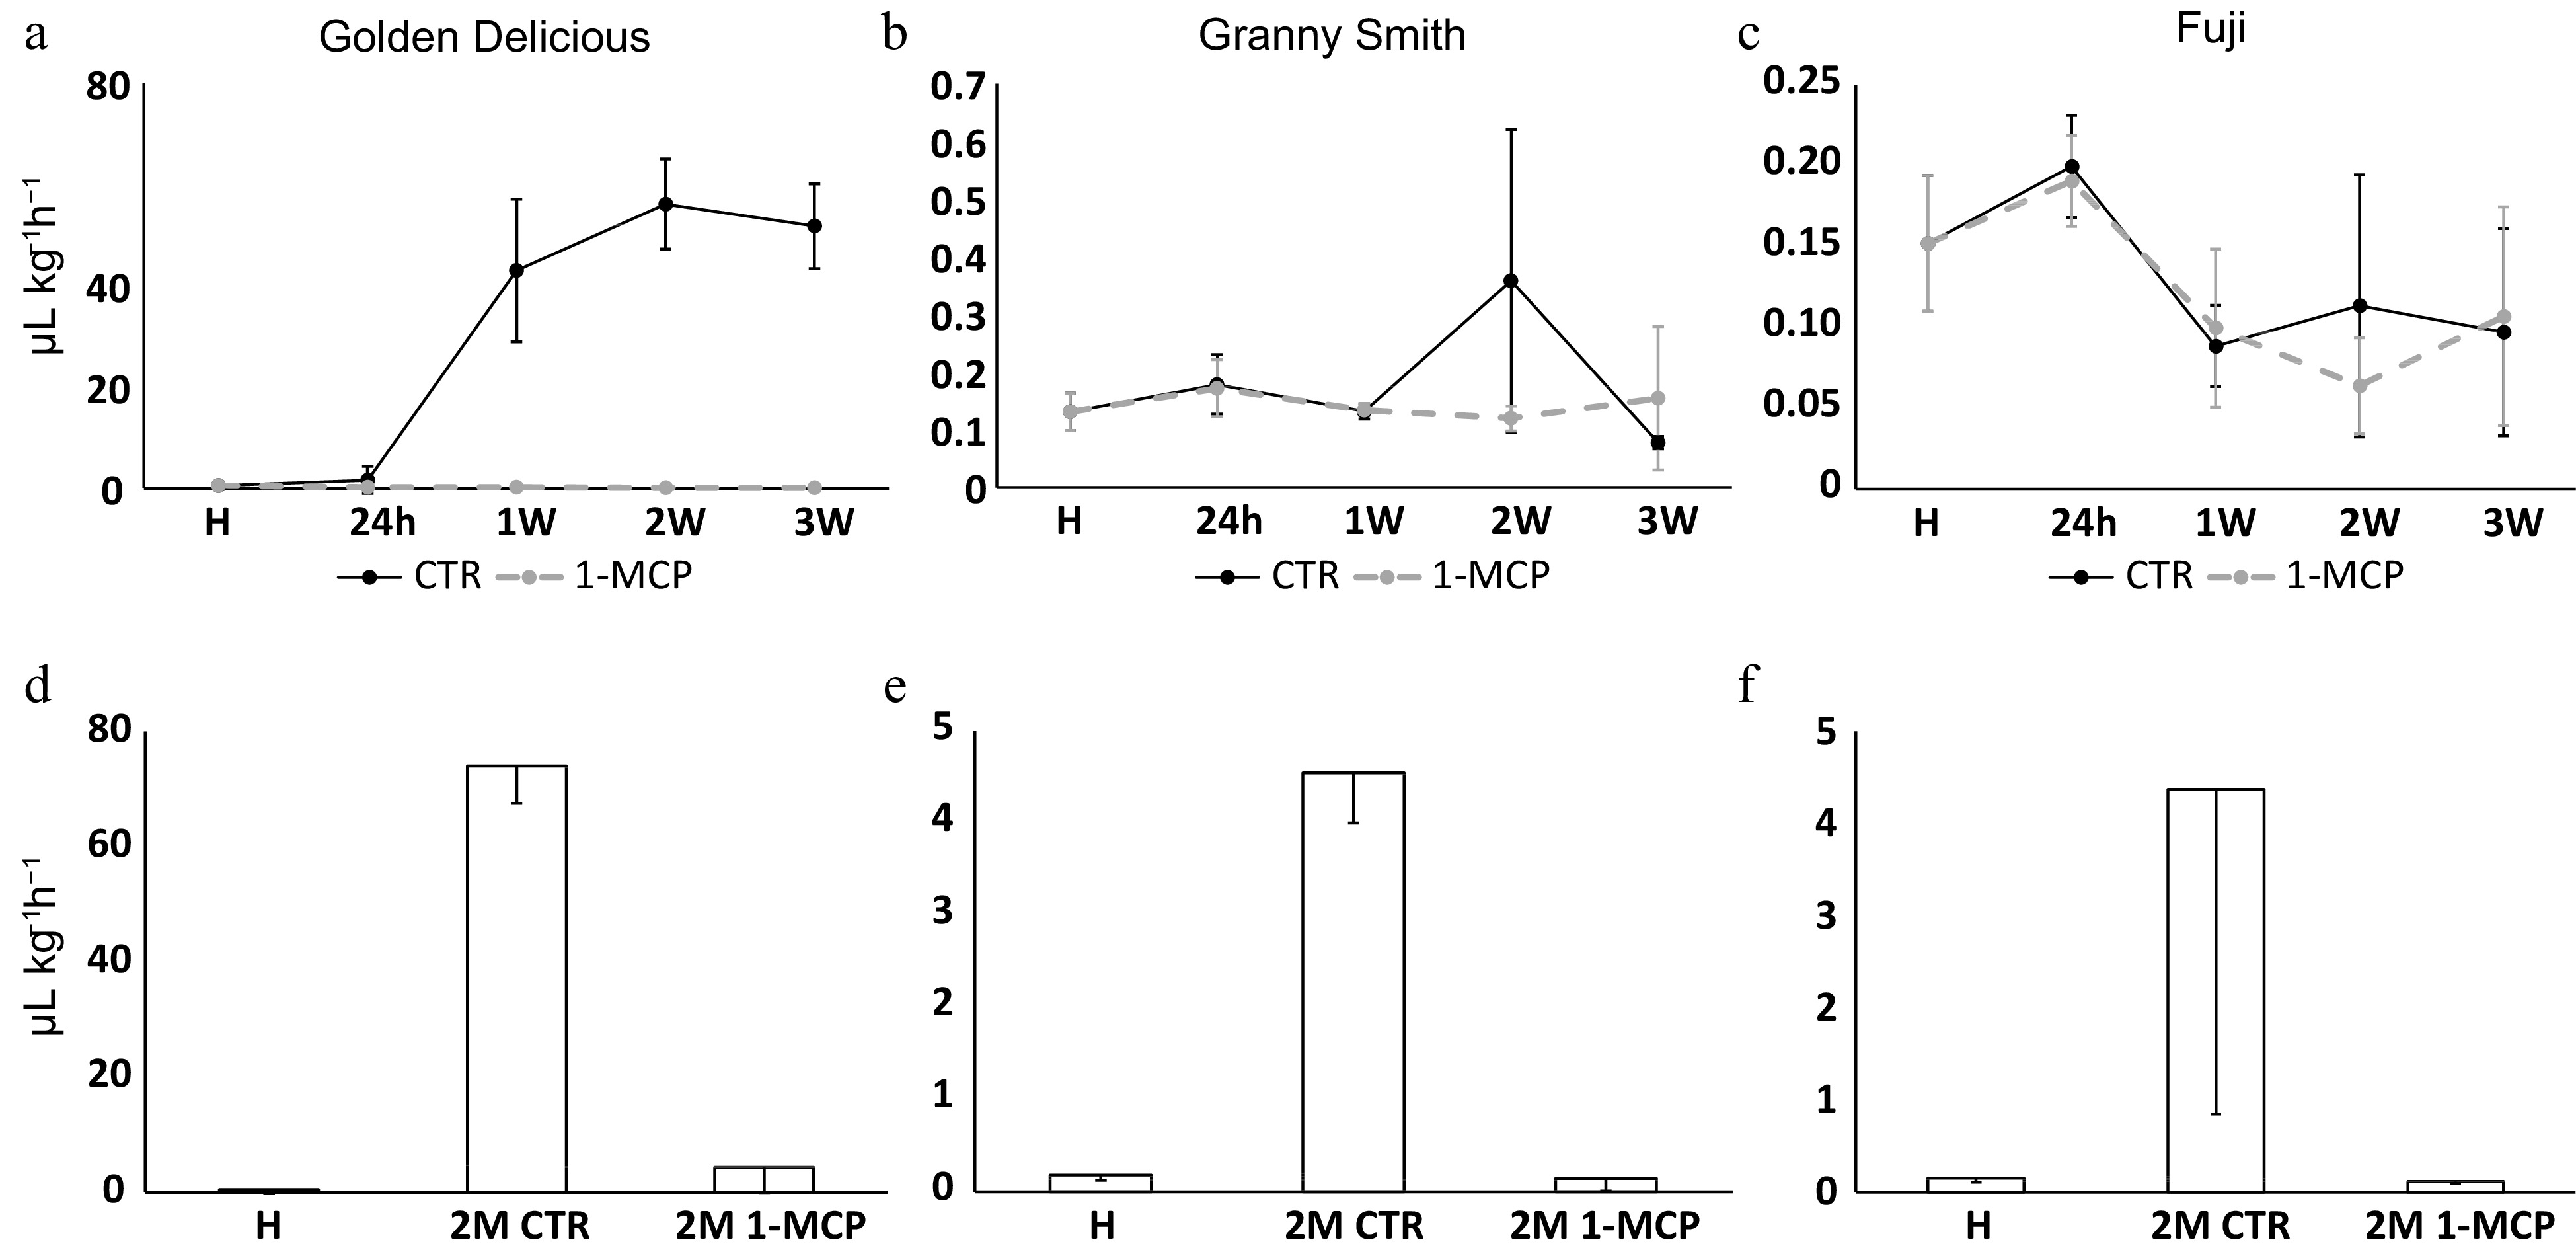
Figure 1. Ethylene production in 'Golden Delicious', 'Granny Smith' and 'Fuji' apple cultivars. Panels (a), (b) and (c) indicate the ethylene level monitored during the shelf-life ripening, while panels (d), (e) and (f) are for the samples assessed after 2 months of cold storage. The time points presented are: H (harvest), 24h (24 hours after harvest in room temperature shelf-life), 1-2-3W (for 7, 14 and 21 d after harvest in shelf life, respectively) and 2M (for 2 months in cold storage). In the upper panels, solid lines indicate the ethylene production in control samples (CTR), while the dashed lines are for samples treated with the ethylene competitor (1-MCP). In the lower panels, CTR and 1-MCP samples assessed after 2 months of cold storage are shown. For each point, bars indicate the standard deviation.
-
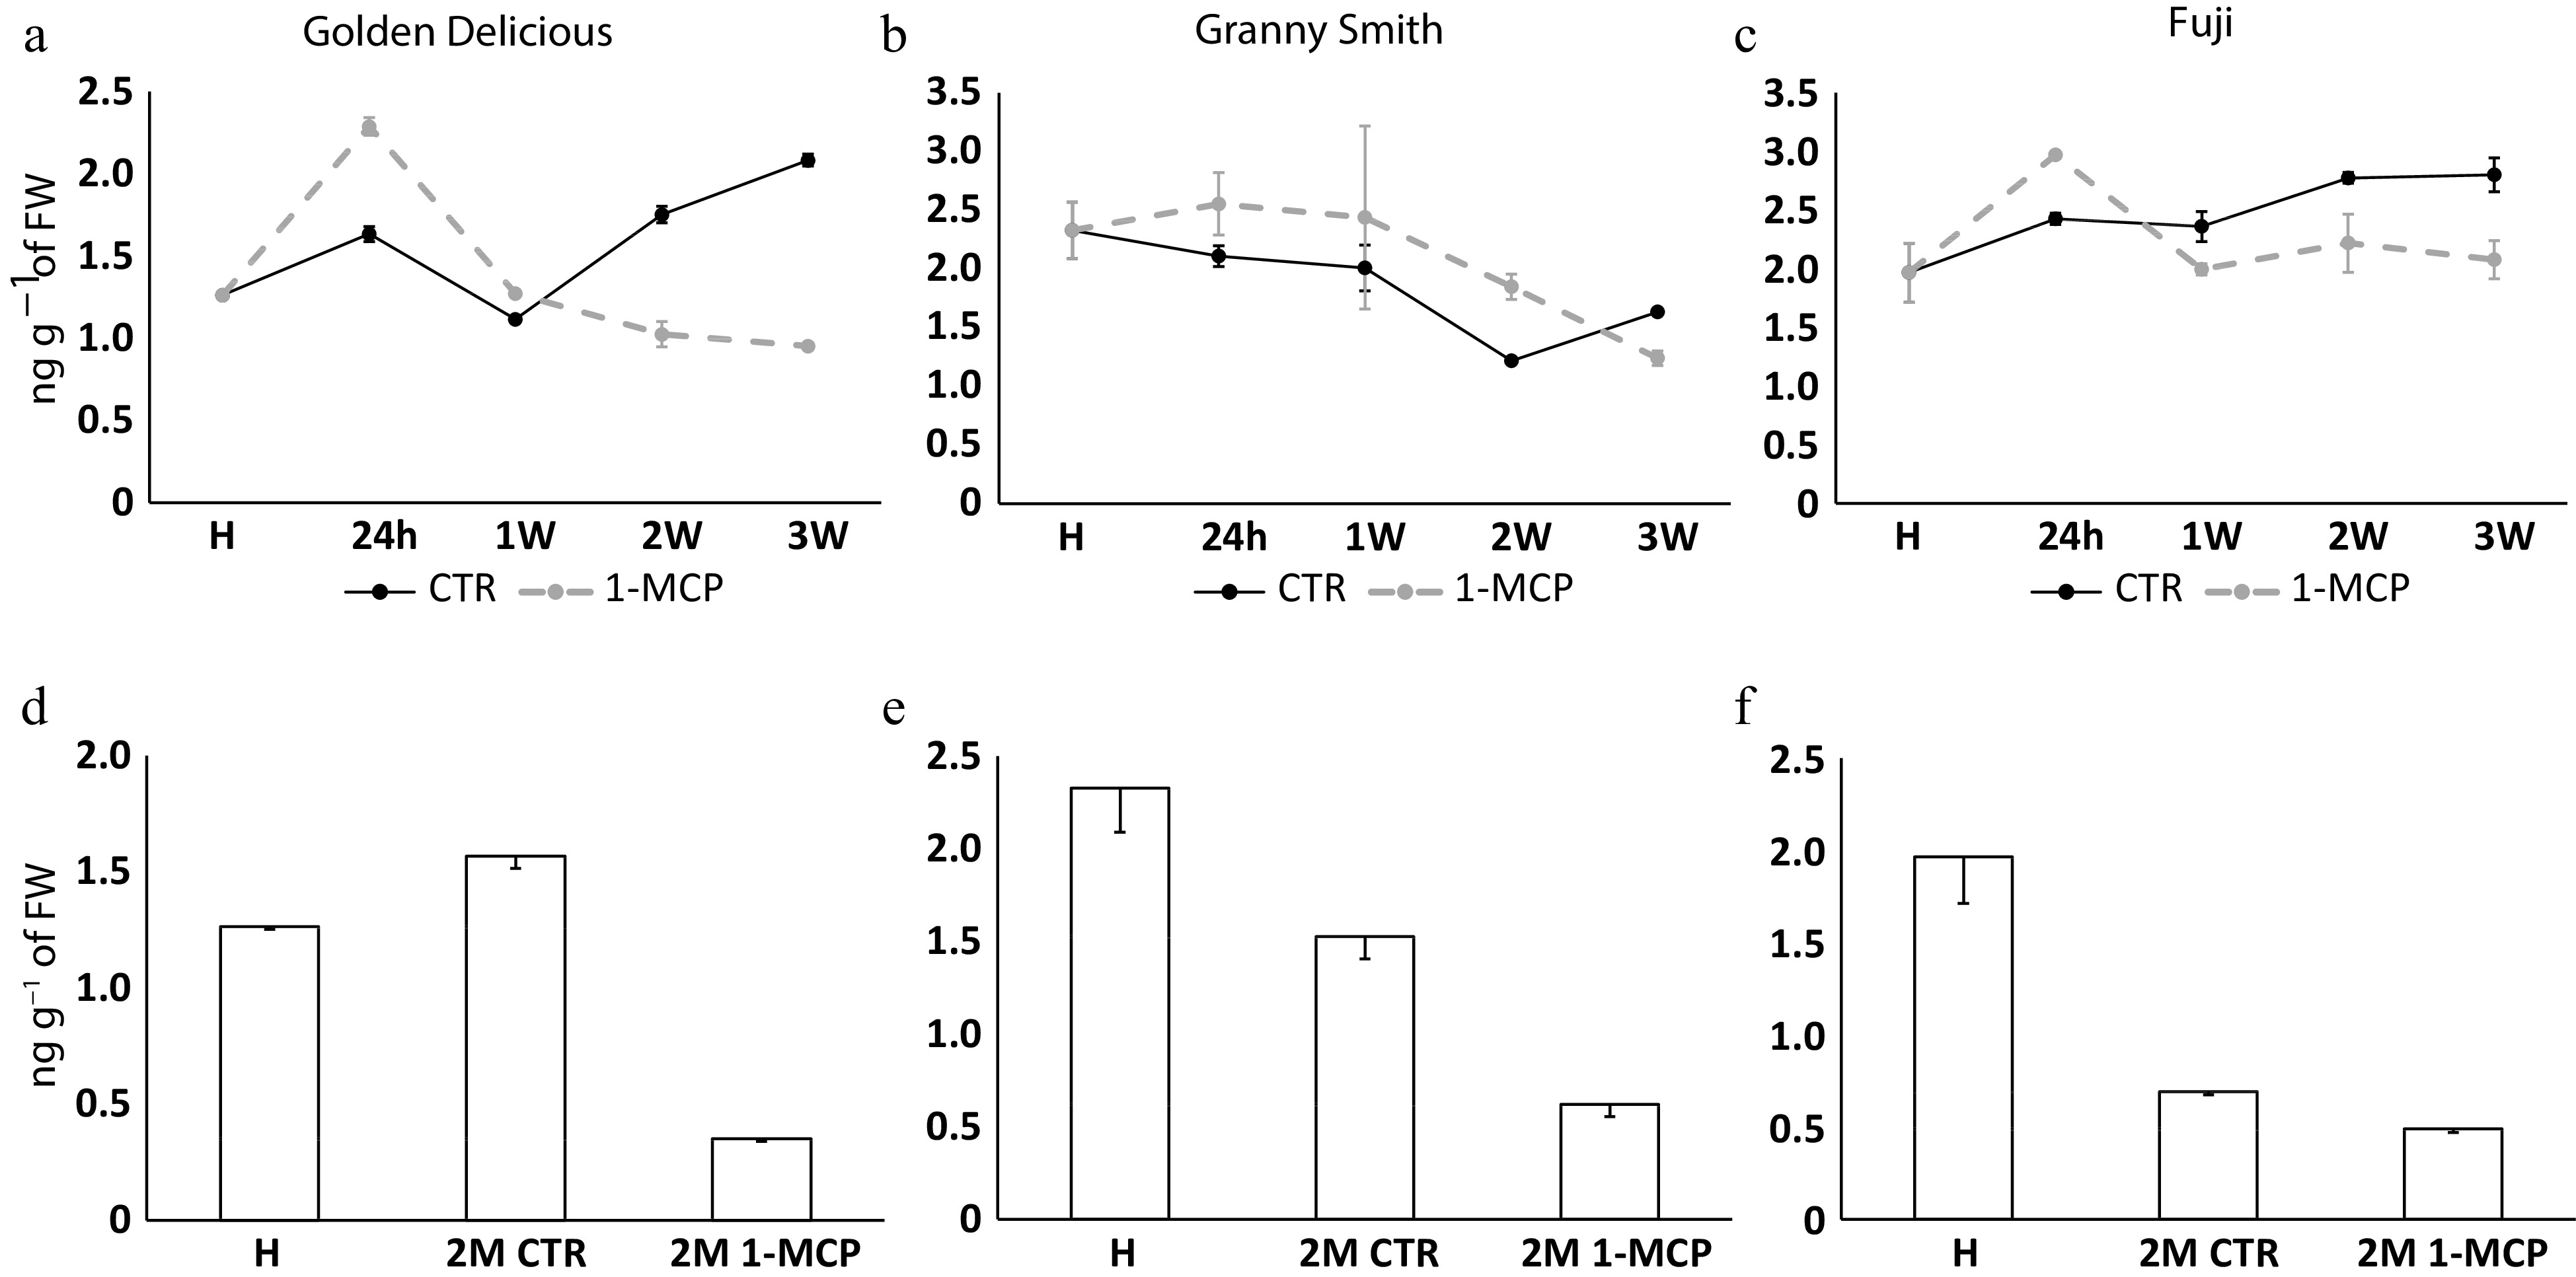
Figure 2. Auxin production in 'Golden Delicious', 'Granny Smith' and 'Fuji' apple cultivars. Auxin level assessed in the same experimental design as illustrated in Fig. 1. Auxin is quantified in ng g−1 of fresh weight. For each point, bars indicate the standard deviation.
-
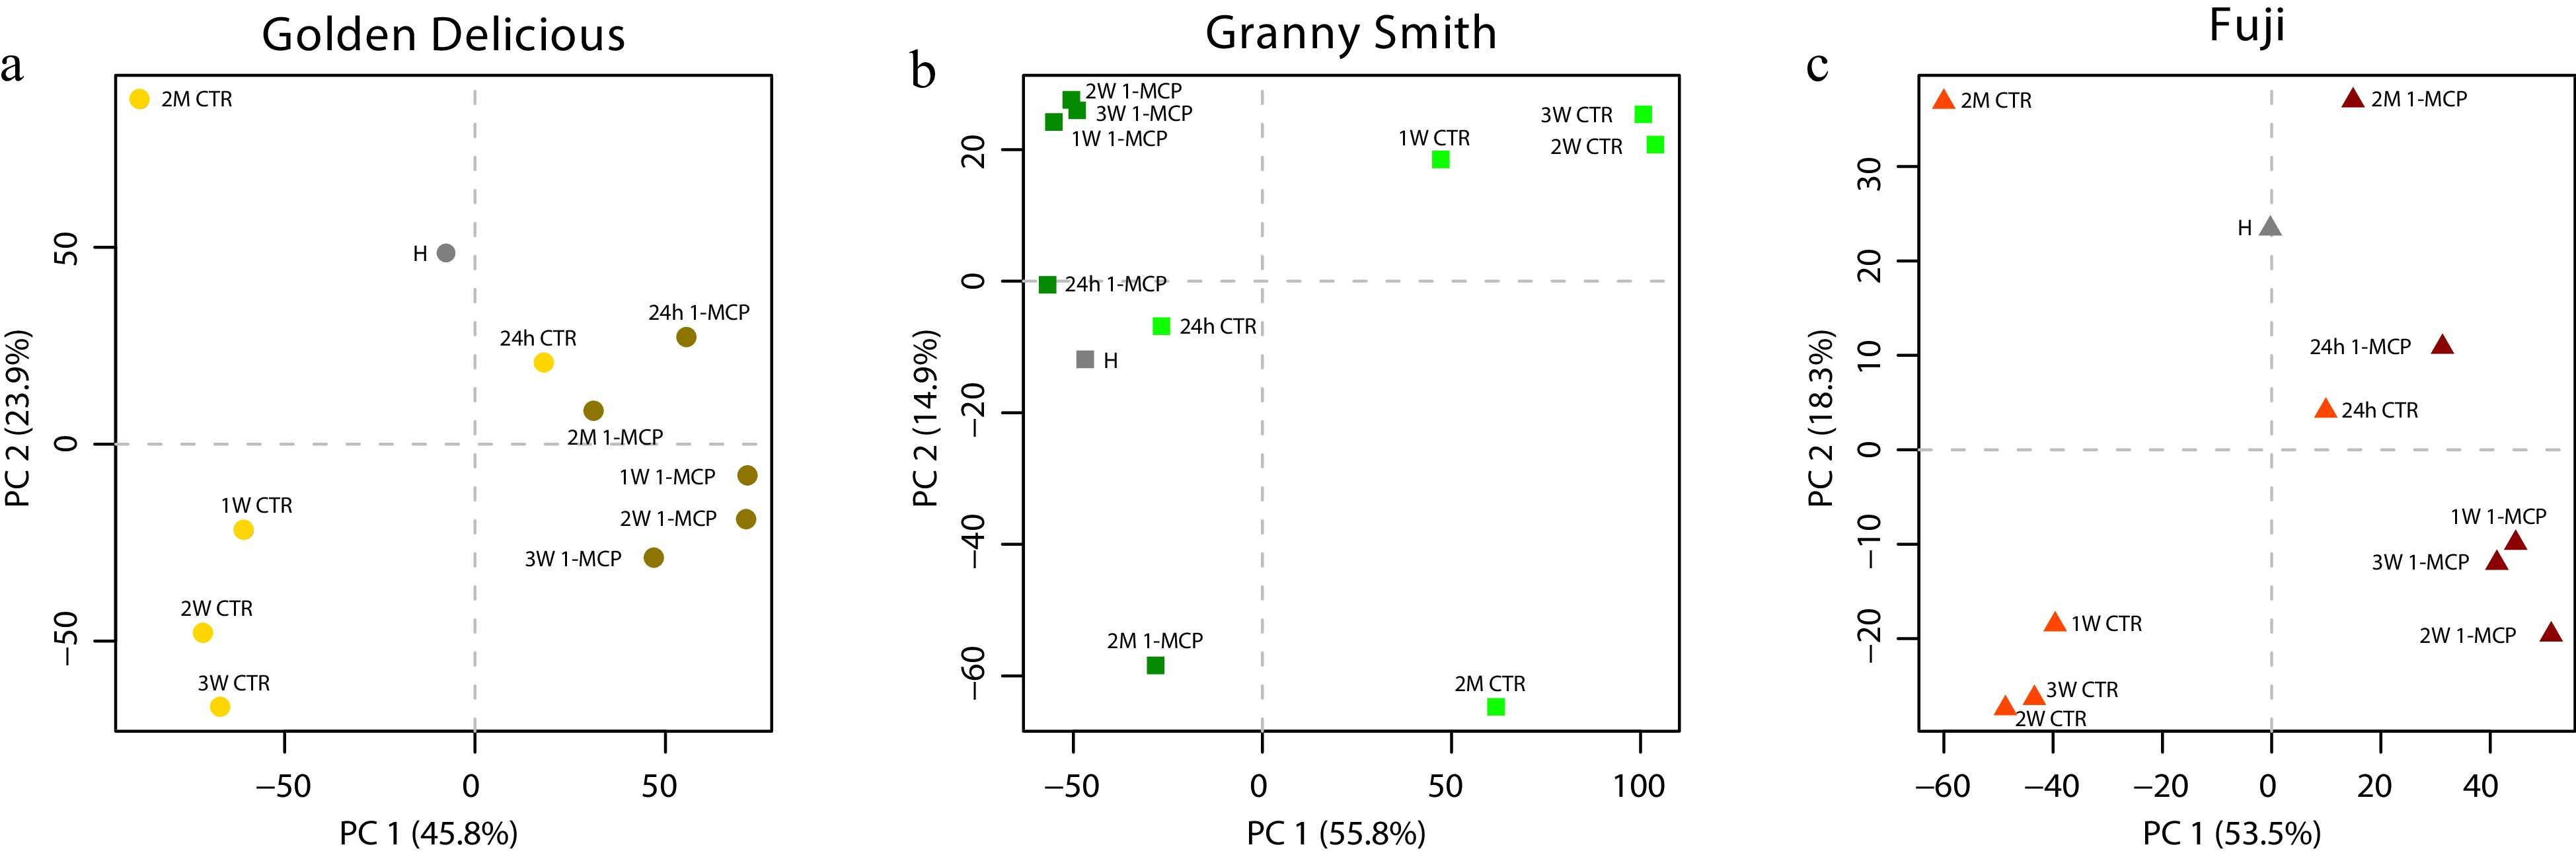
Figure 3. Multivariate PCA analysis of the apple transcriptome. Principal component analysis of the transcription variability captured by the analysis of the expression profile of the genes differentially expressed in 'Golden Delicious' (a), 'Granny Smith' (b) and 'Fuji' (c), respectively. The three cultivars are distinguished by different colors and shapes as follow: 'Golden Delicious' in yellow (●), 'Granny Smith' in green (■) and 'Fuji' in red (▲). CTR and 1-MCP samples are depicted with light and dark colors respectively. The harvest samples (H) are represented with grey color. The PCA plots were defined by the implementation of the first two principal components.
-
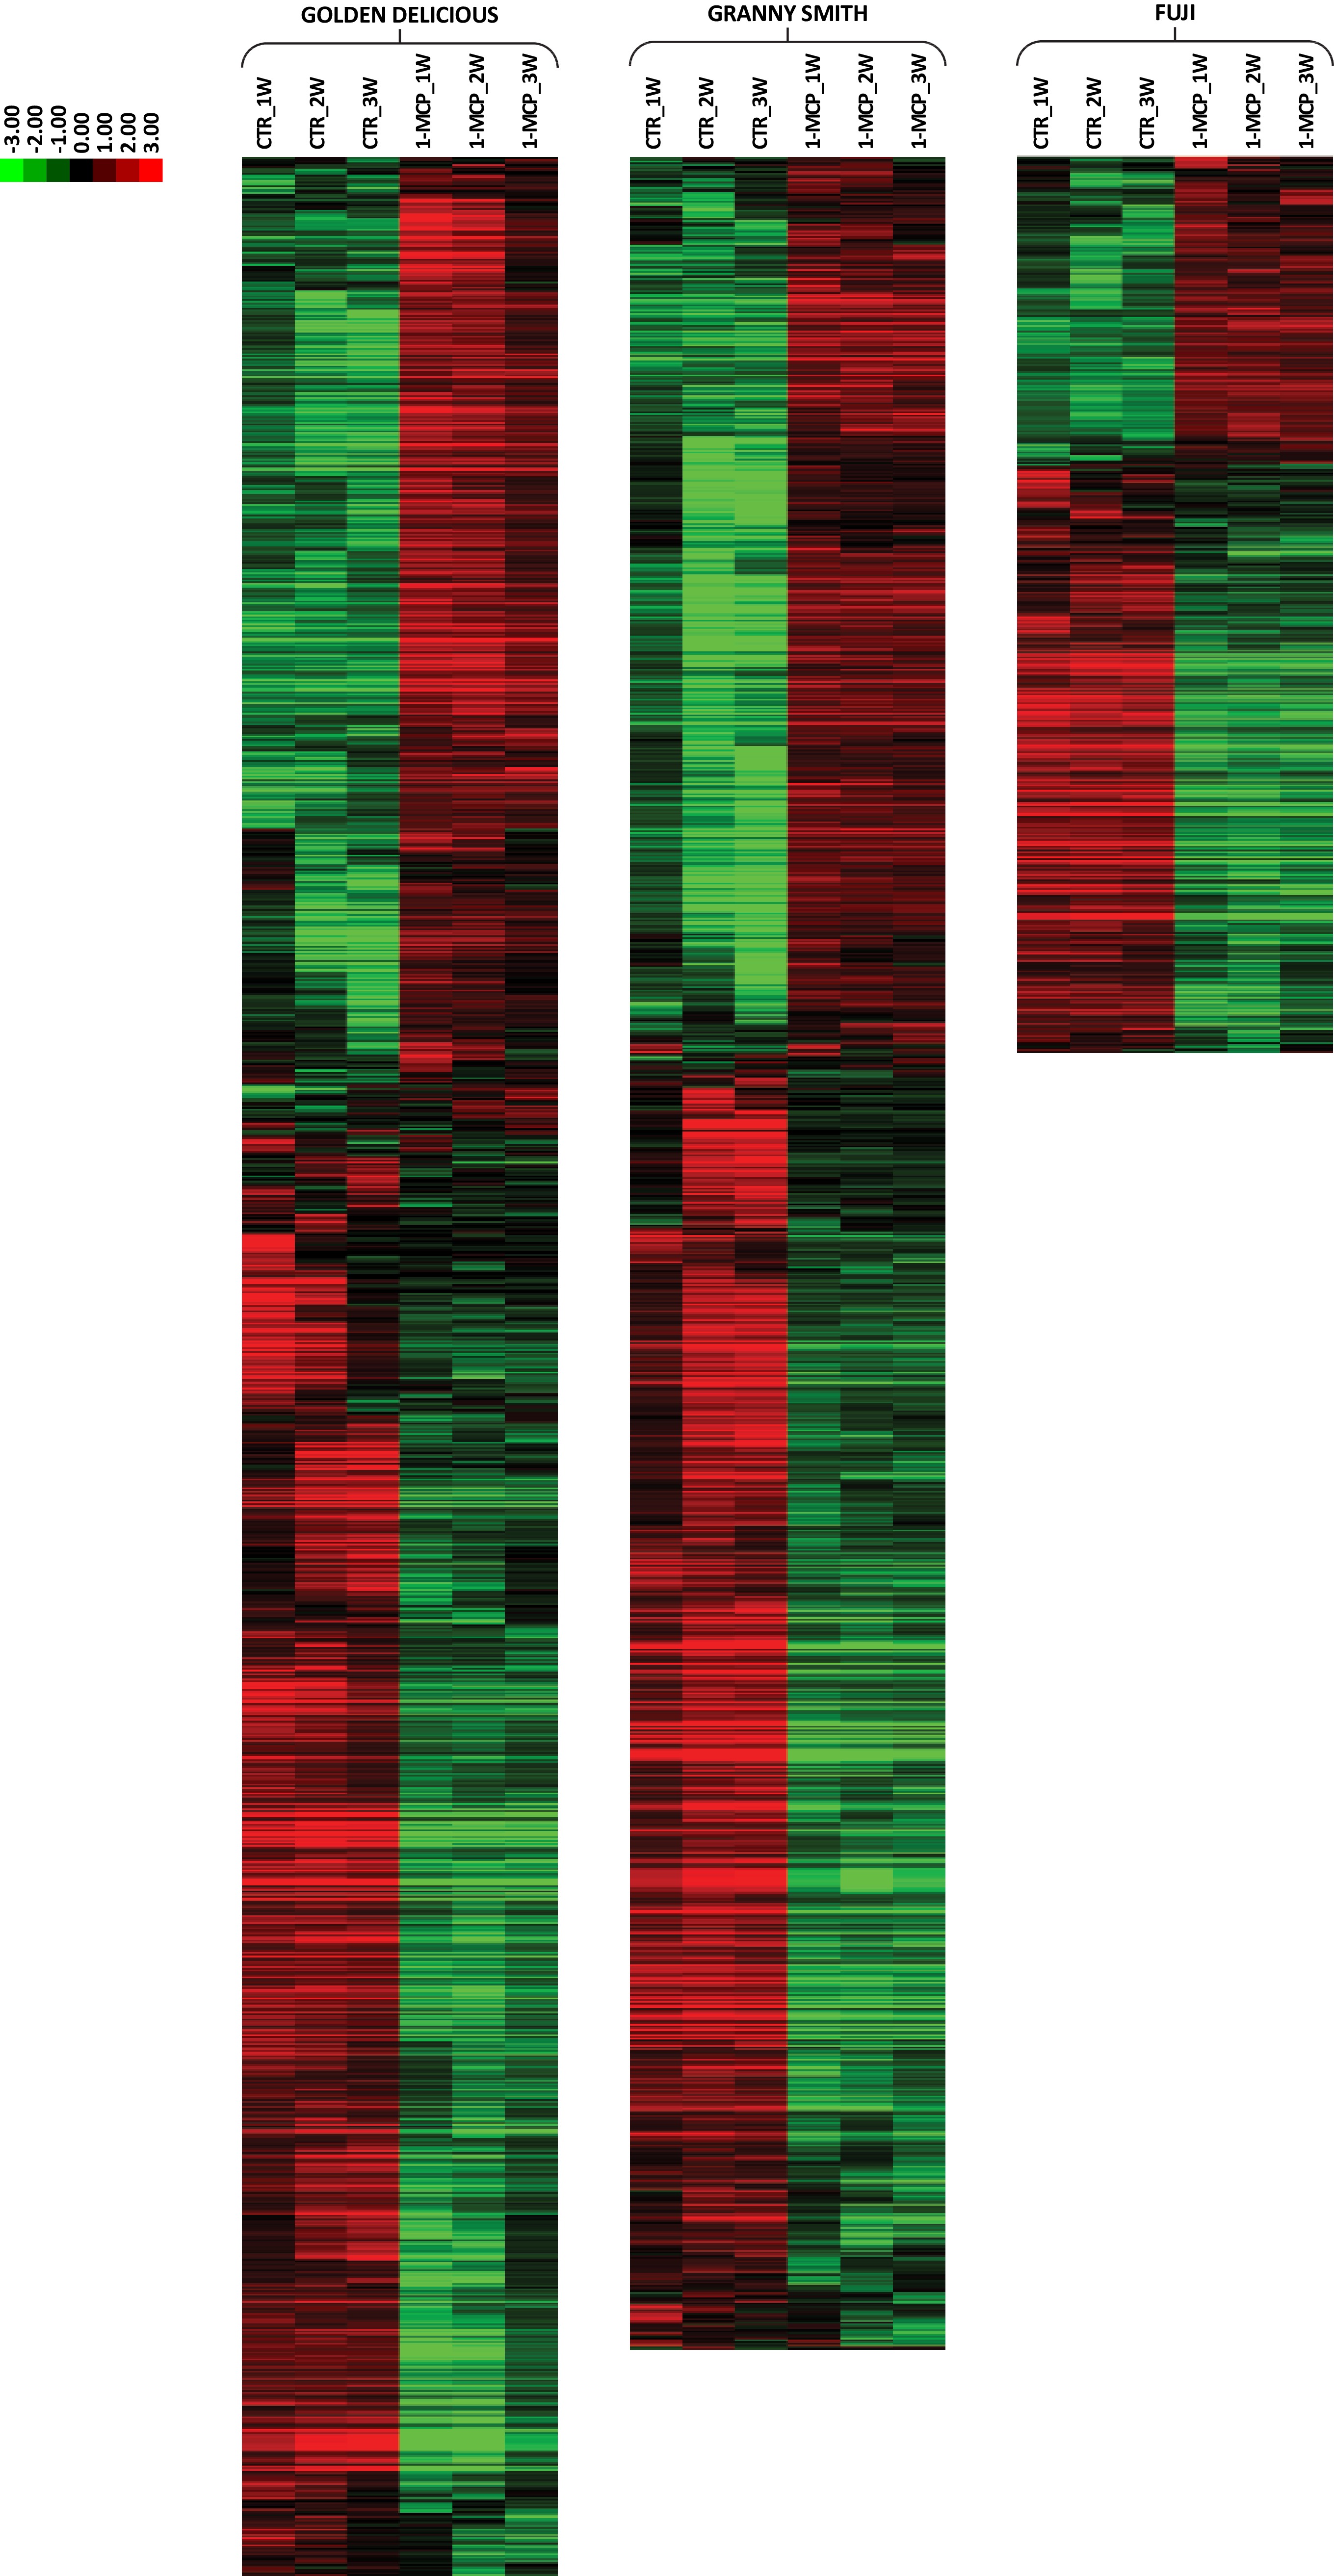
Figure 4. HeatMap of the expression analysis in 'Golden Delicious', 'Granny Smith' and 'Fuji' apple cultivars. The heatmap illustrated the expression of the selected list of DEGs and comparing CTR and 1-MCP samples. The transcriptome variation induced by the exogenous application of 1-MCP was evidenced only in the time points related to the postharvest shelf-life ripening. Expression level is reported according to the colored scale reported in the top left part of the figure.
-
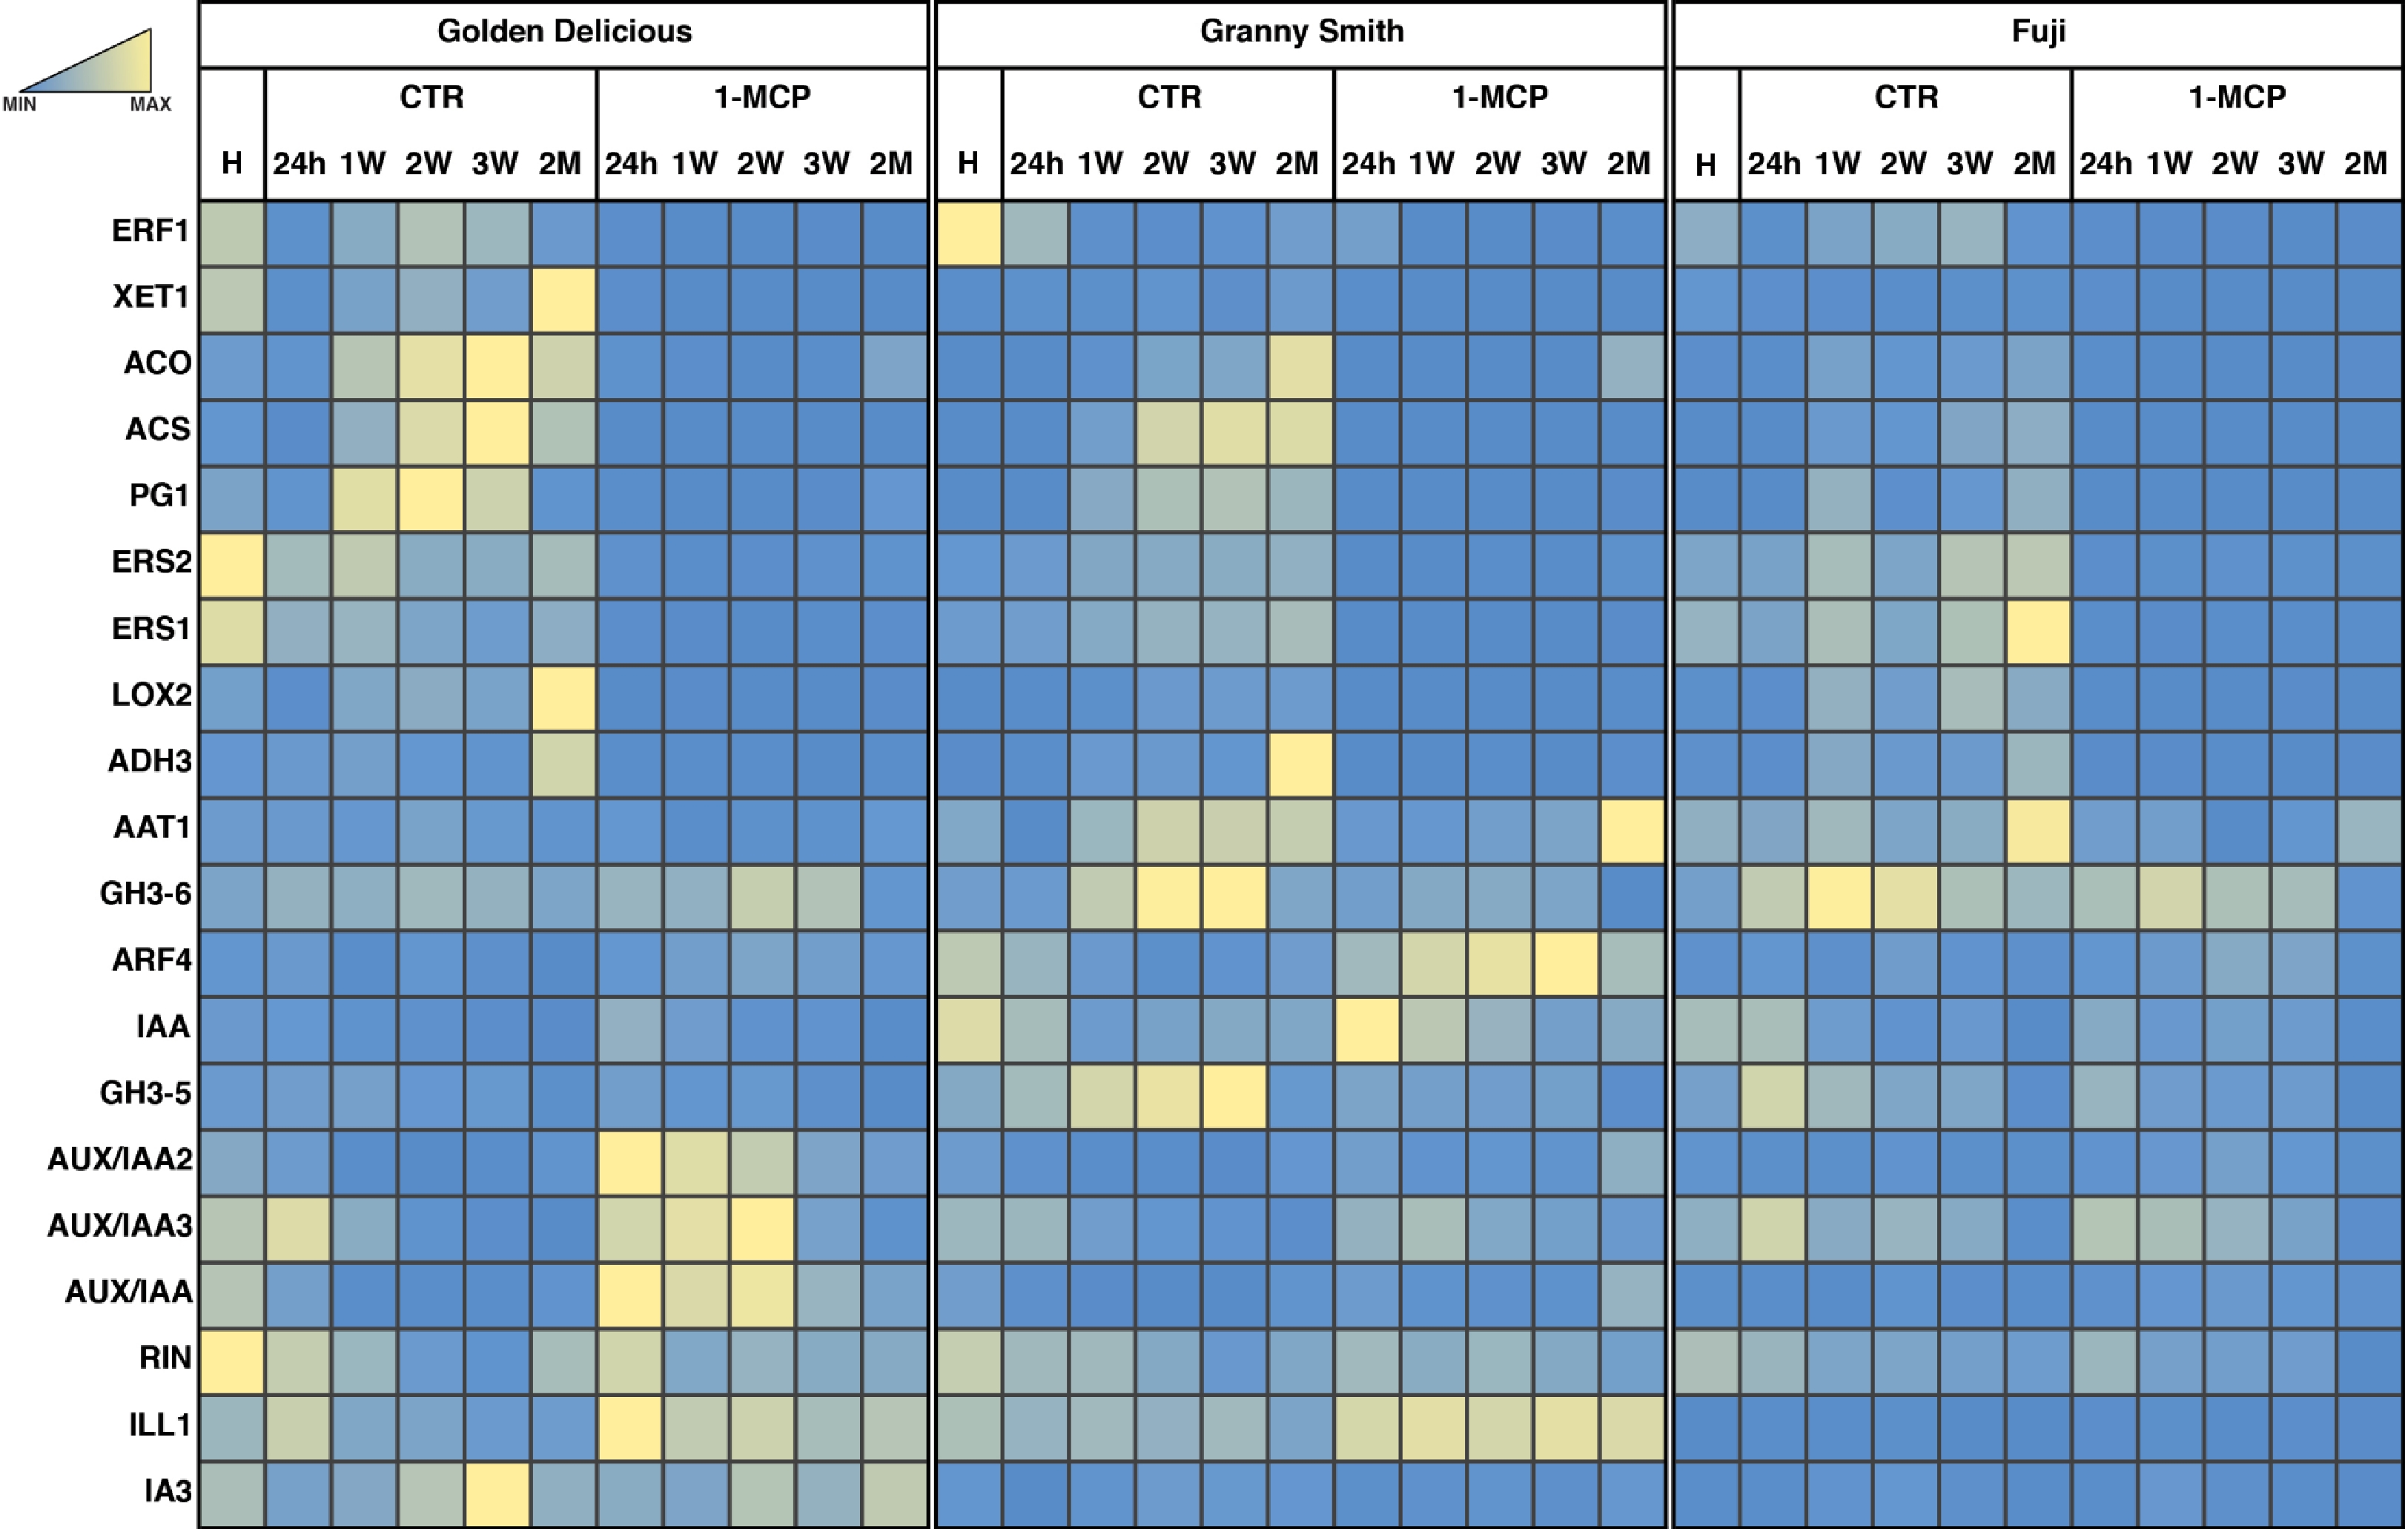
Figure 5. Transcription profile of a set of candidate genes related to ethylene and auxin pathways. The expression detected by a qRT-PCR was illustrated as a relative expression and represented through a heatmap according to the color scale reported. The expression pattern for each gene and cultivar, was reported comparing the two time-course: control and 1-MCP treated, respectively.
-
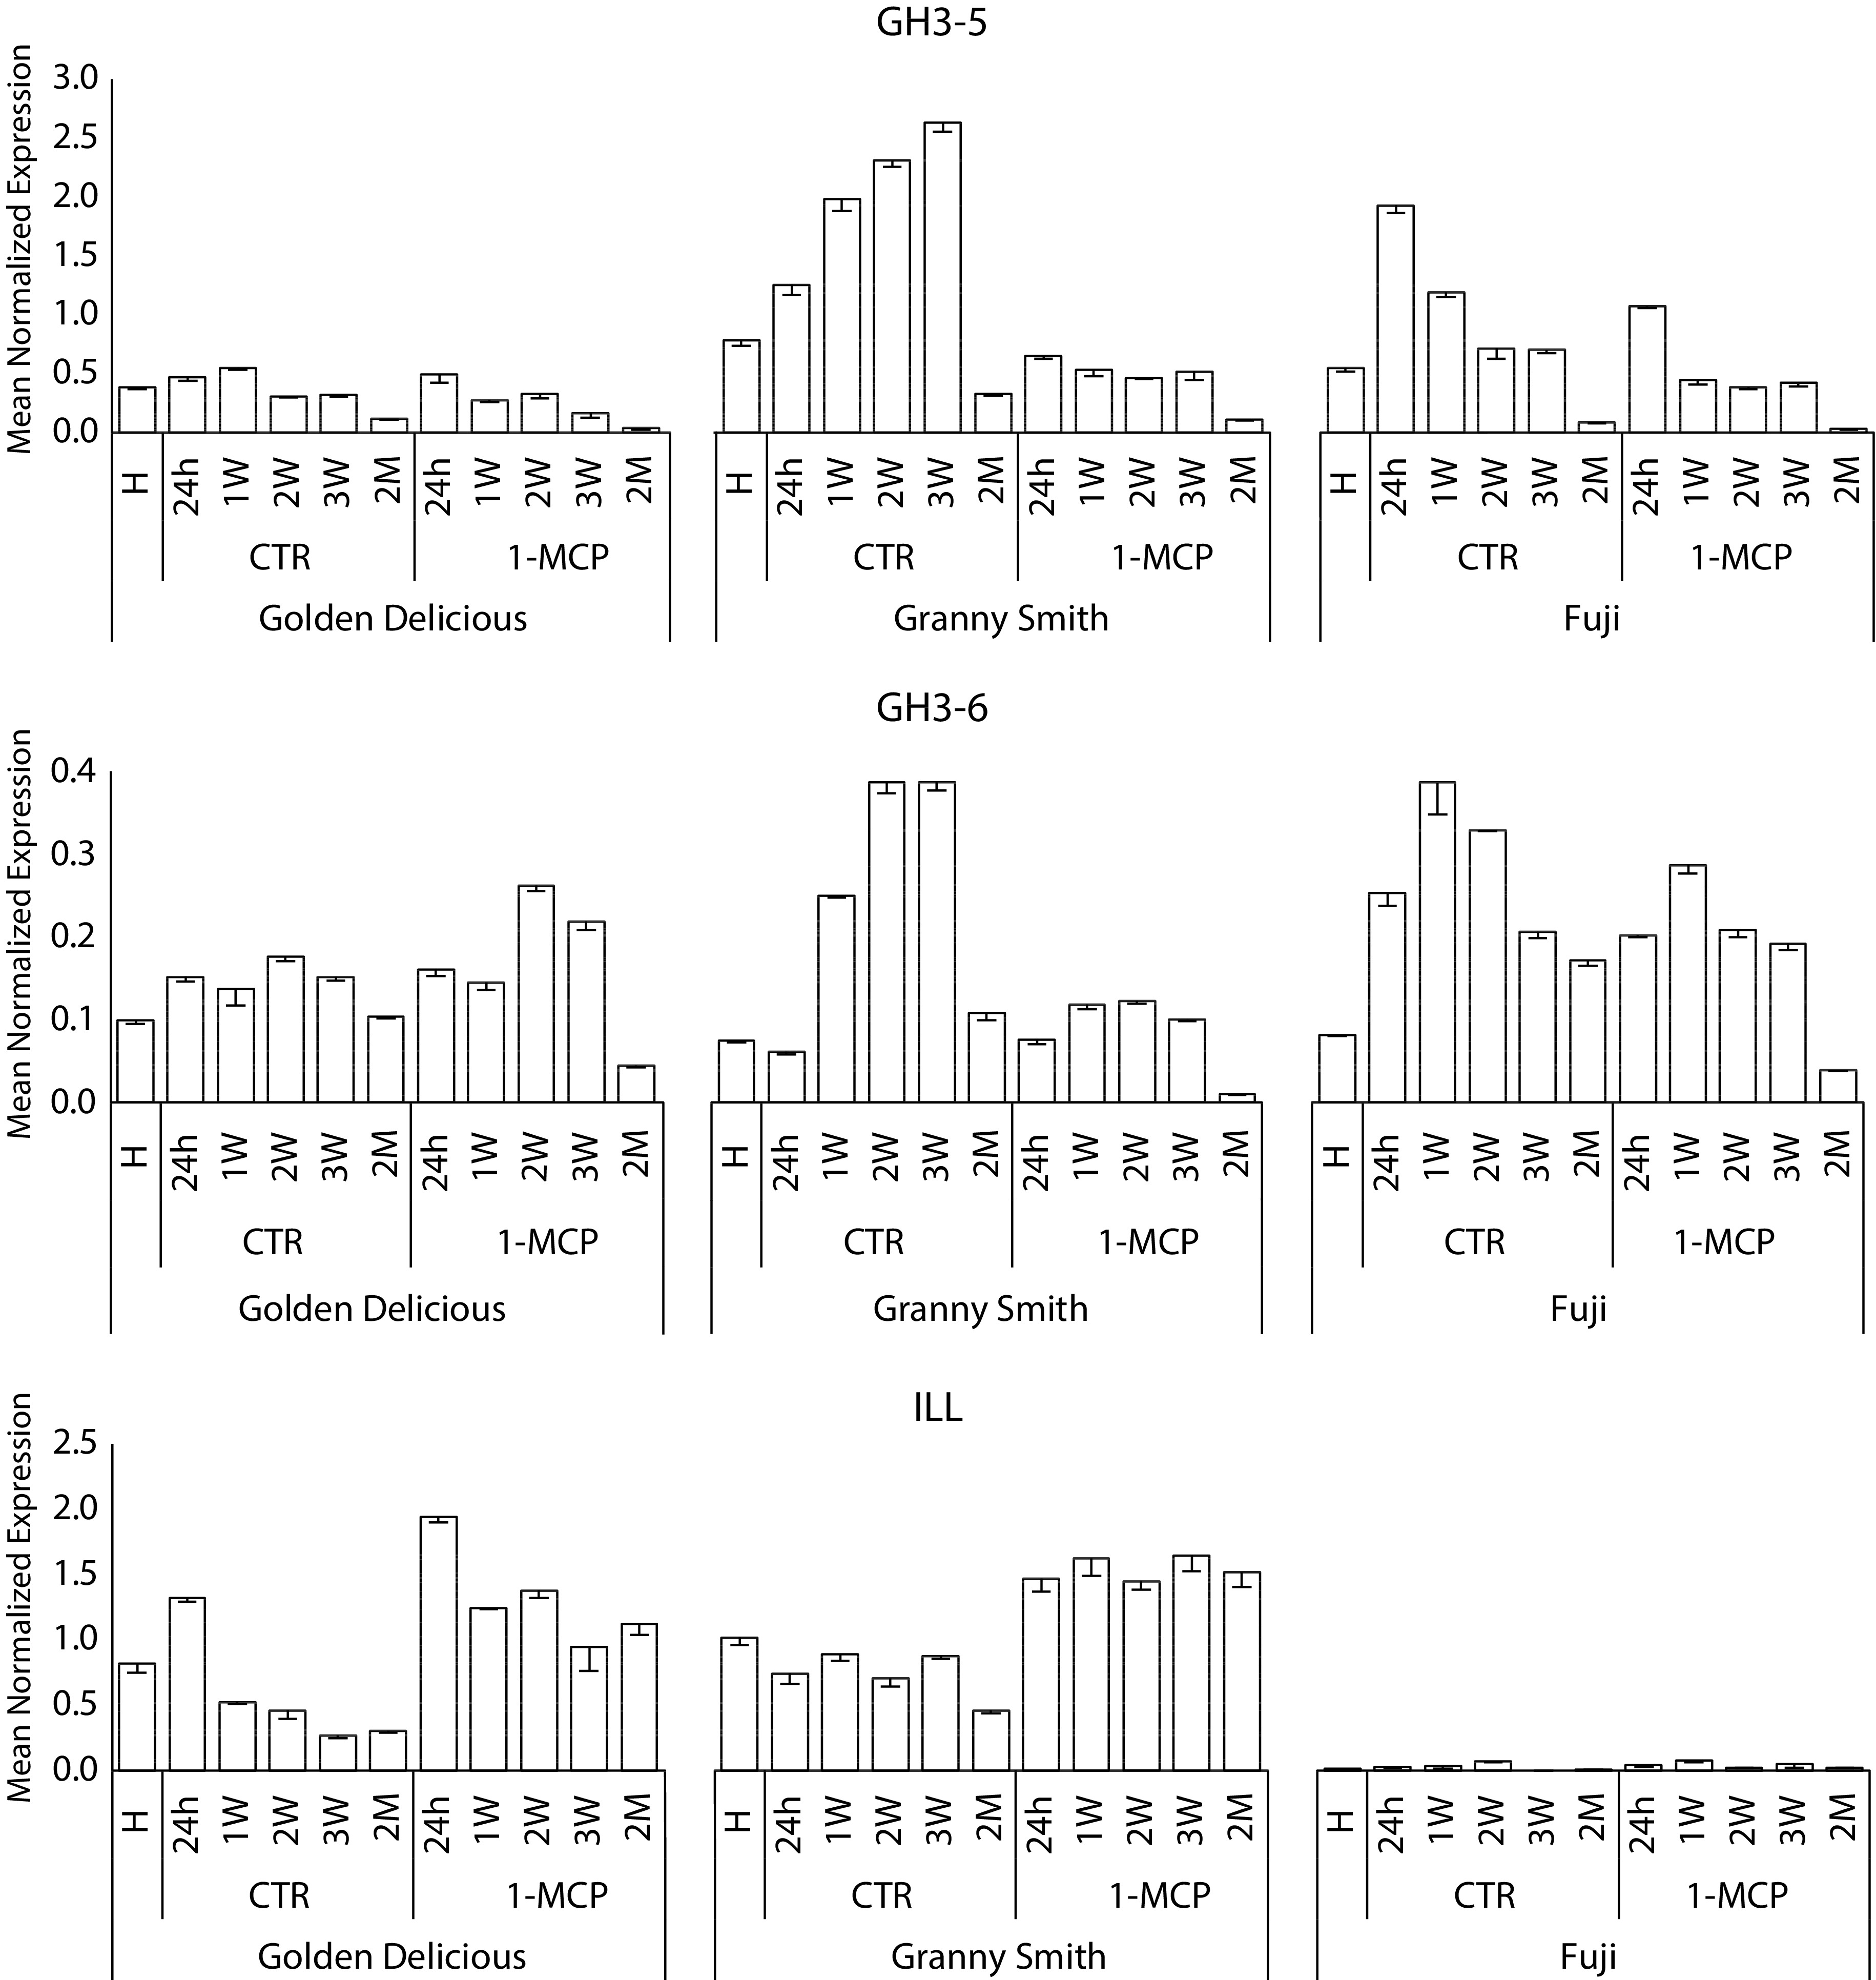
Figure 6. Relative expression analysis of three genes, namely GH3-5, GH3-6 and ILL, involved in the auxin homeostasis mechanism. The expression profile was illustrated for both time-course (control and 1-MCP treated) and for each of the three cultivars, 'Golden Delicious', 'Granny Smith' and 'Fuji', respectively. Bars indicate standard deviation.
Figures
(6)
Tables
(0)