-
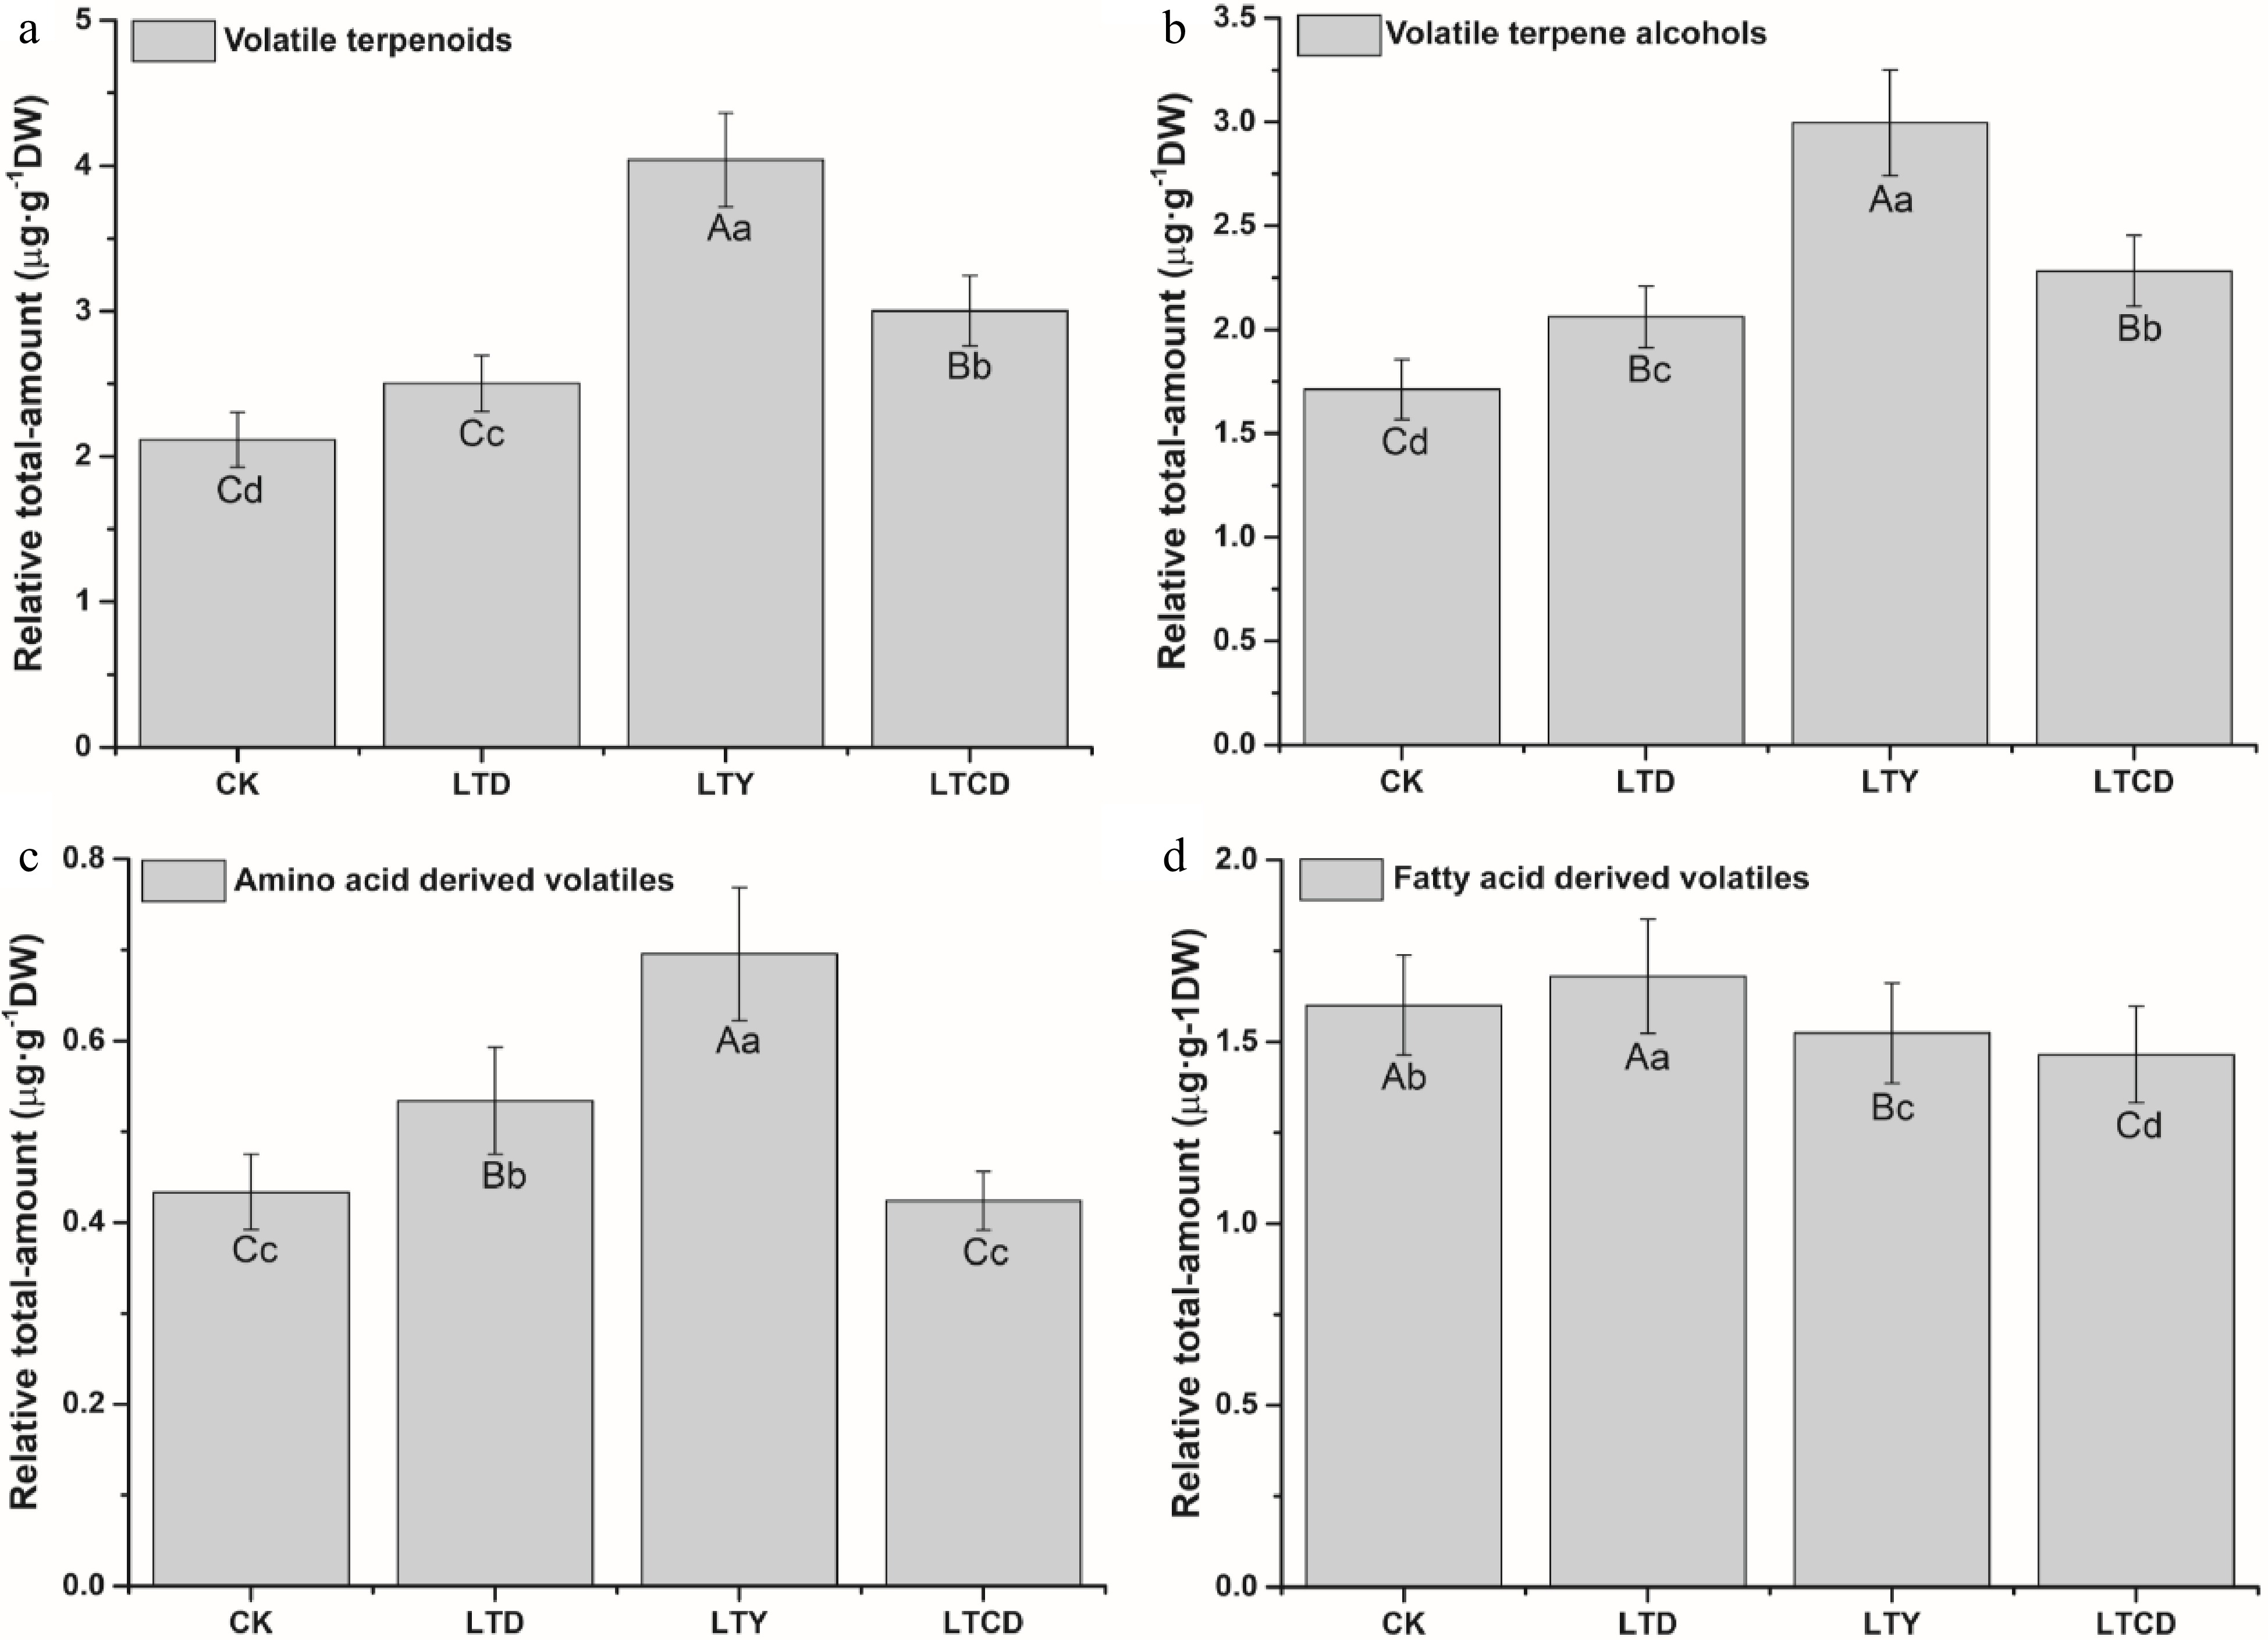
Figure 1. The relative total-content of volatile compounds in green tea products. (a) Volatile terpenoids; (b) volatile terpene alcohols; (c) amino acid-derived volatiles; (d) fatty acid-derived volatiles. Different upper/lowercase letters represent the significant difference at P < 0.01/0.05 level (ANOVA, Duncan test).
-
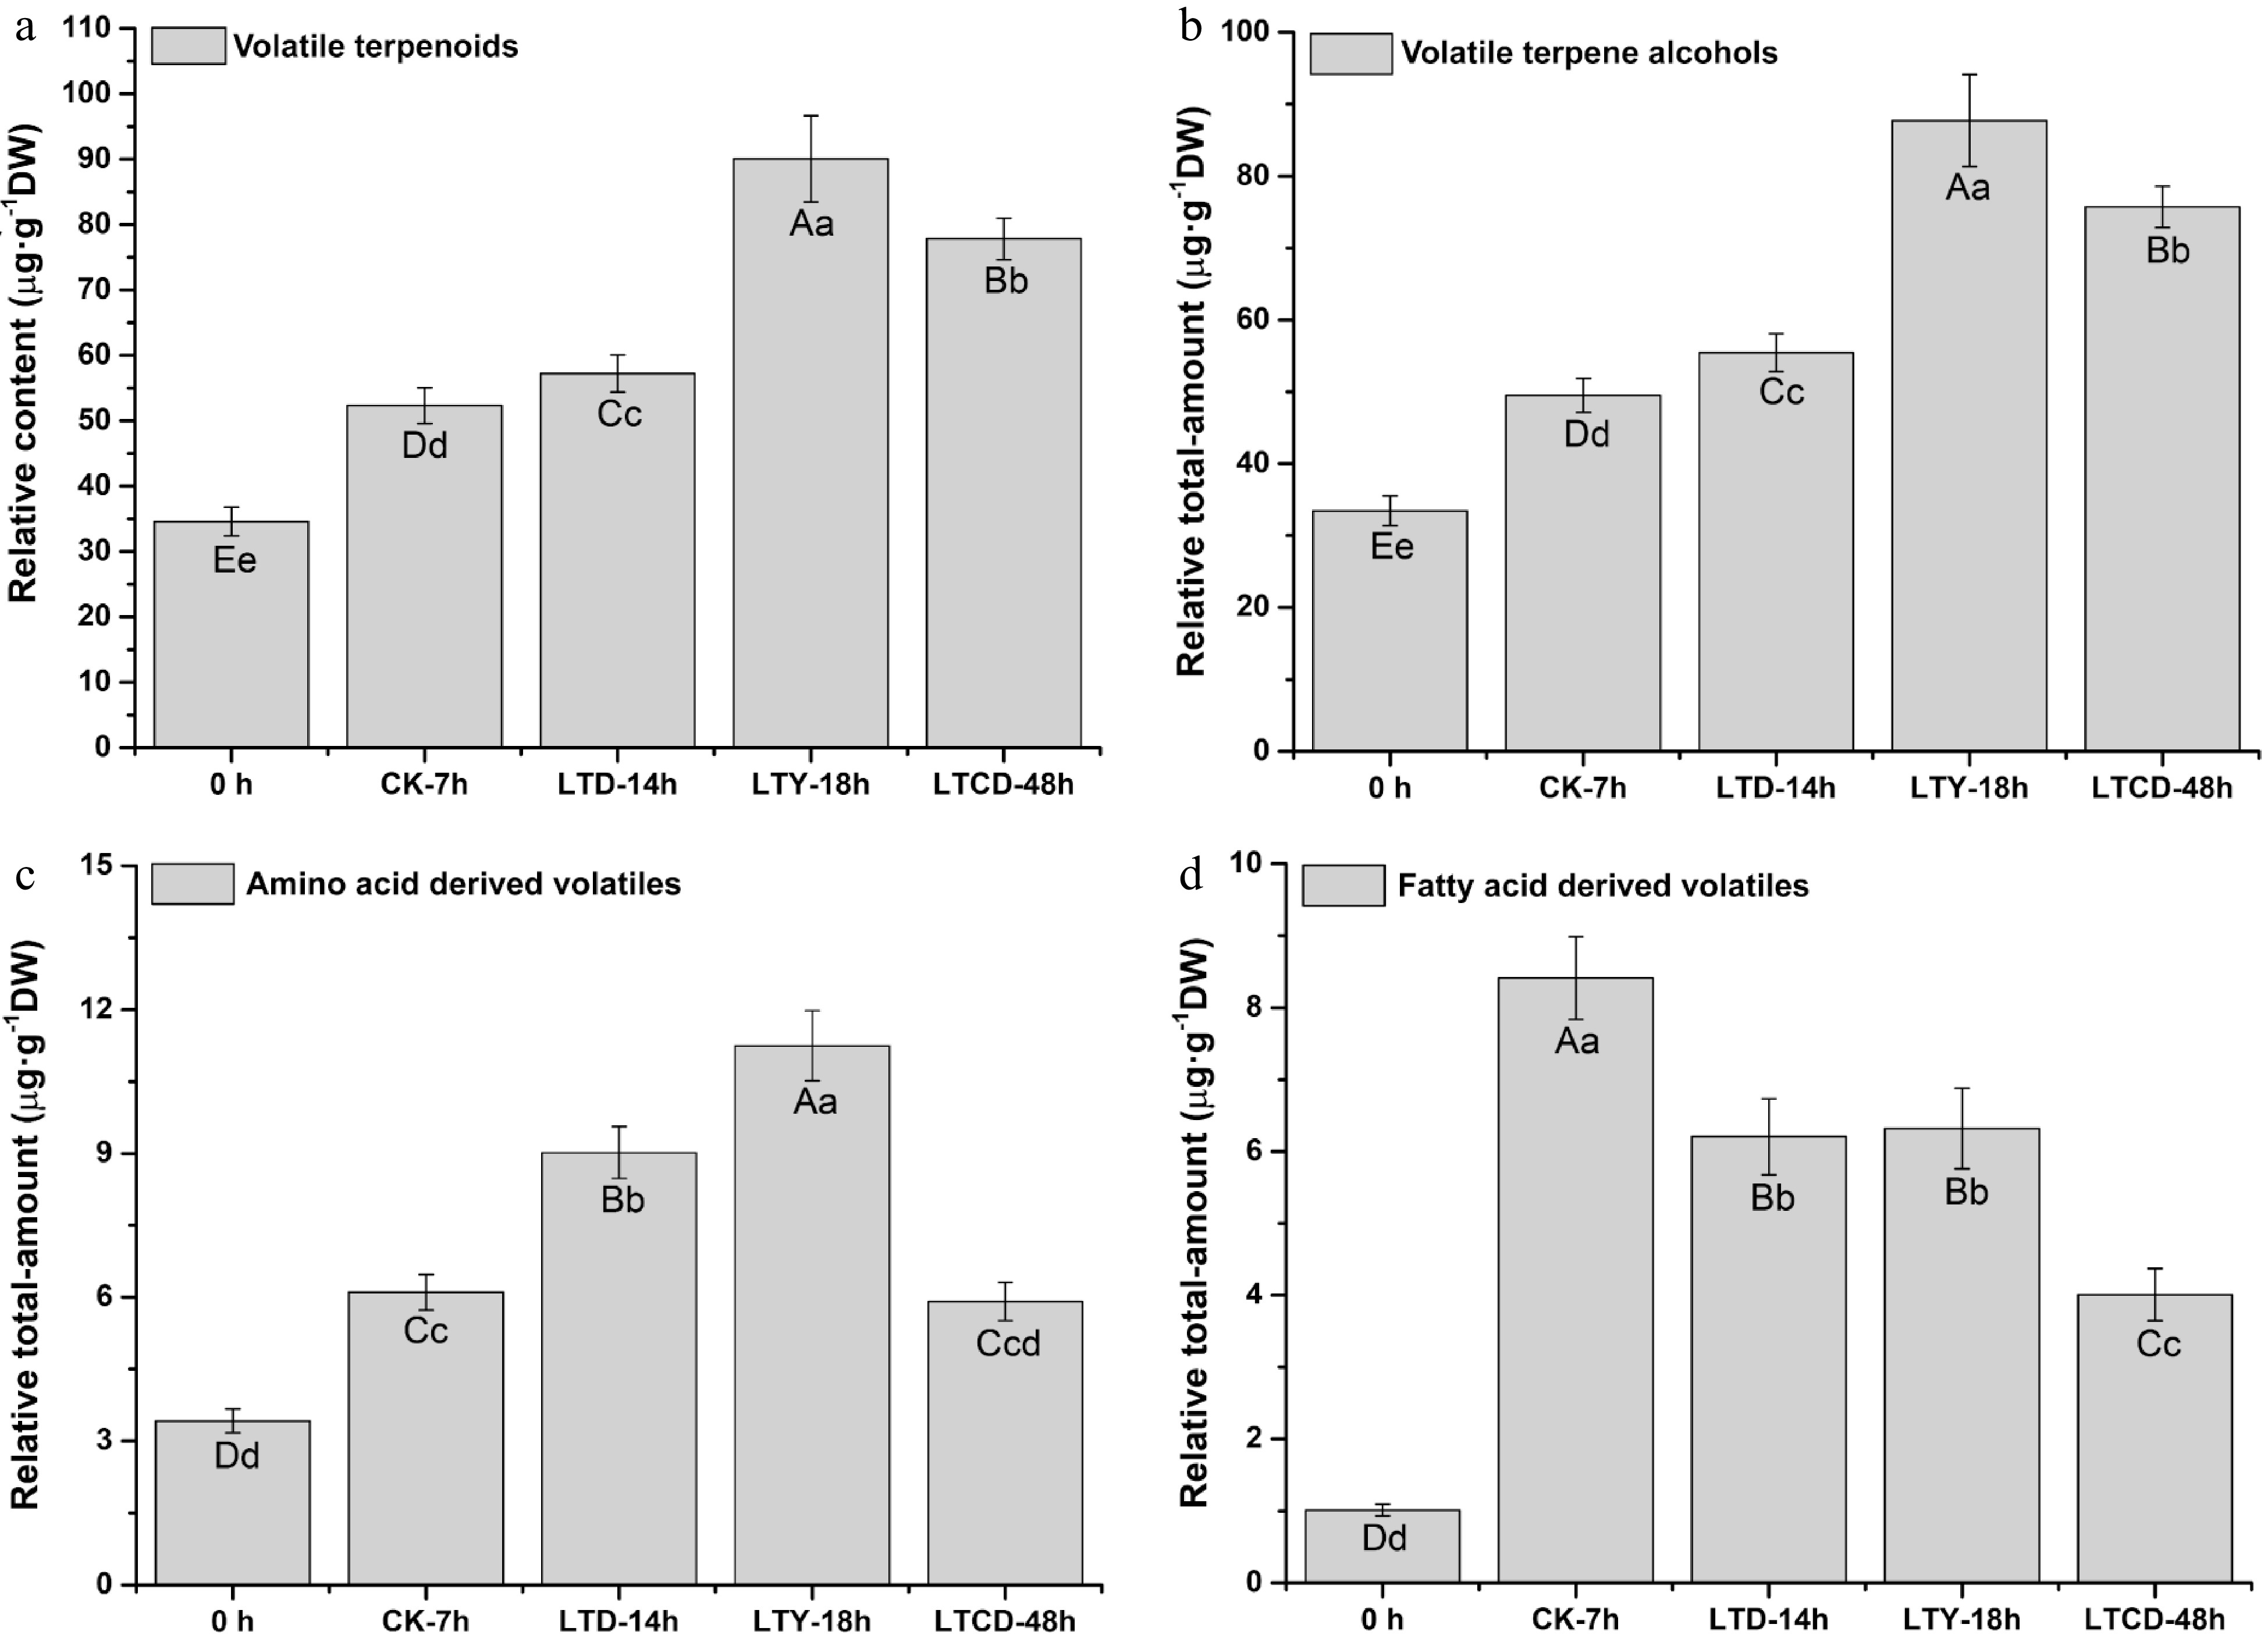
Figure 2. The relative total-content of volatile compounds in different spreading samples. (a) Volatile terpenoids; (b) volatile terpene alcohols; (c) amino acid-derived volatiles; (d) fatty acid-derived volatiles. Different upper/lowercase letters represent the significant difference at P < 0.01/0.05 level (ANOVA, Duncan test).
-
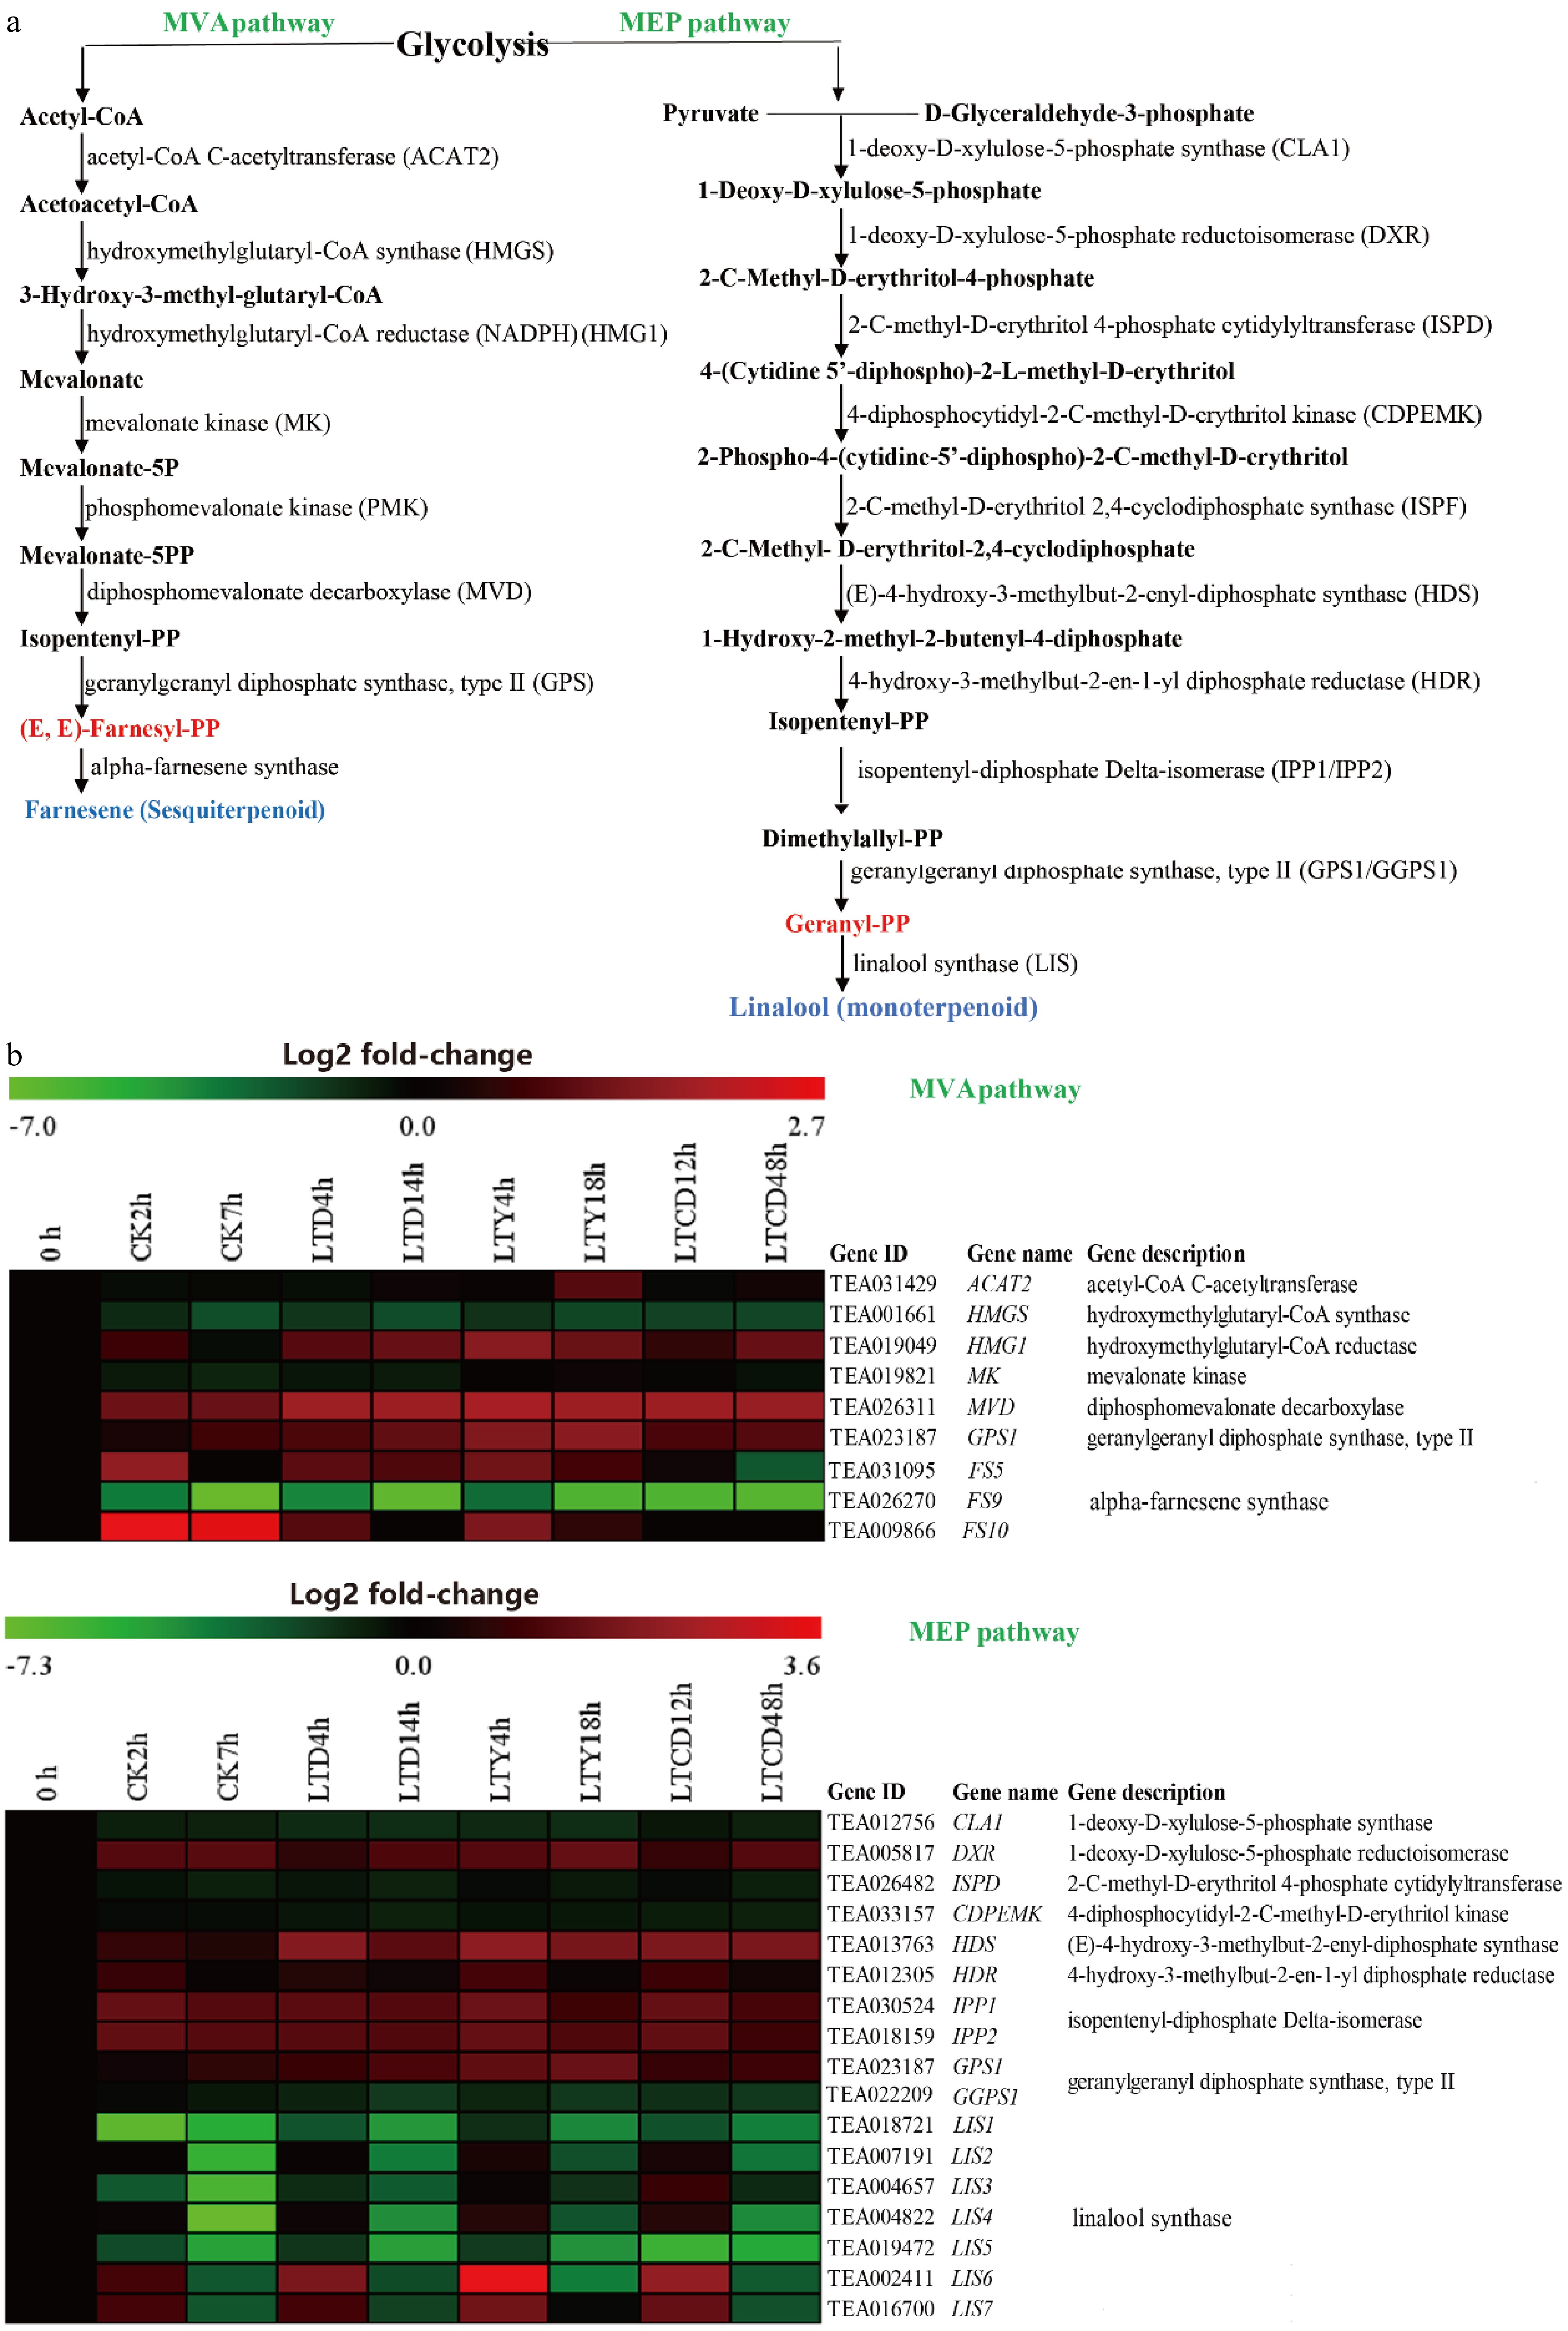
Figure 3. The expression of DEGs involved in terpenoid synthesis under different spreading treatments. (a) KEGG pathways, (b) heat maps of DEGs expression.
-
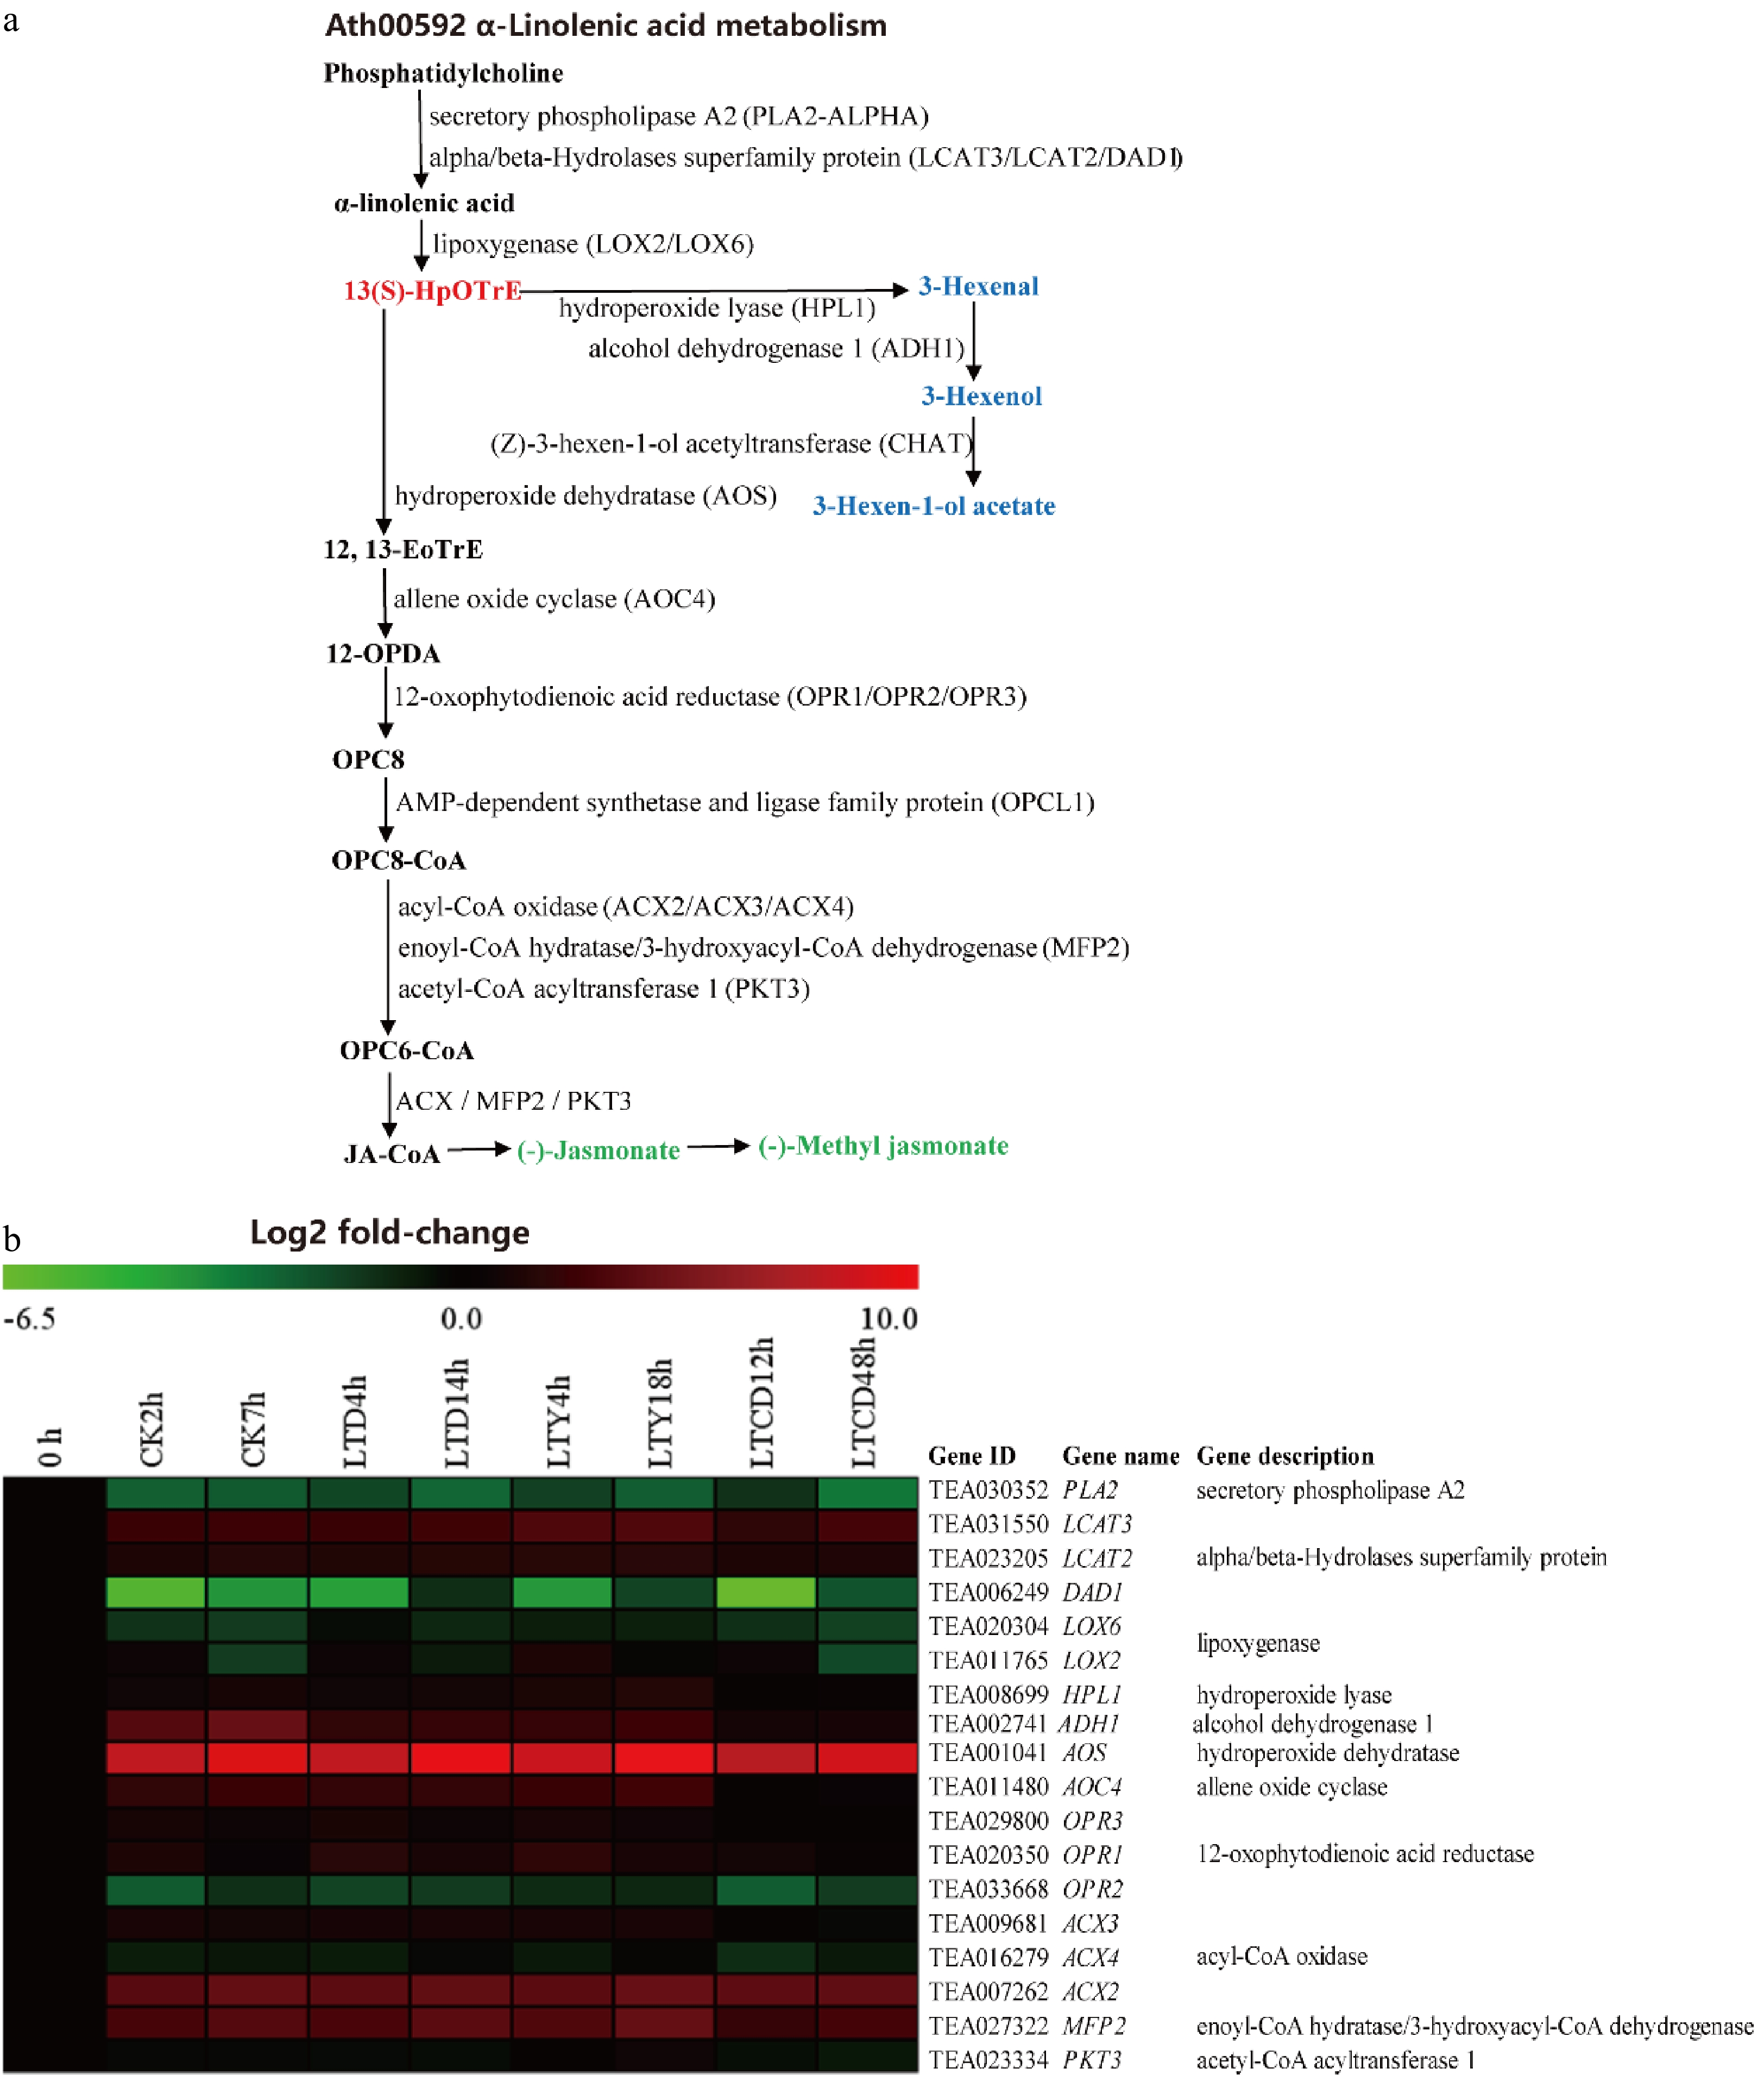
Figure 4. The expression of DEGs involved in α-linolenic metabolism under different spreading treatments. (a) KEGG pathways; (b) heat map of DEGs expression profiling from the RNA-Seq data.
-
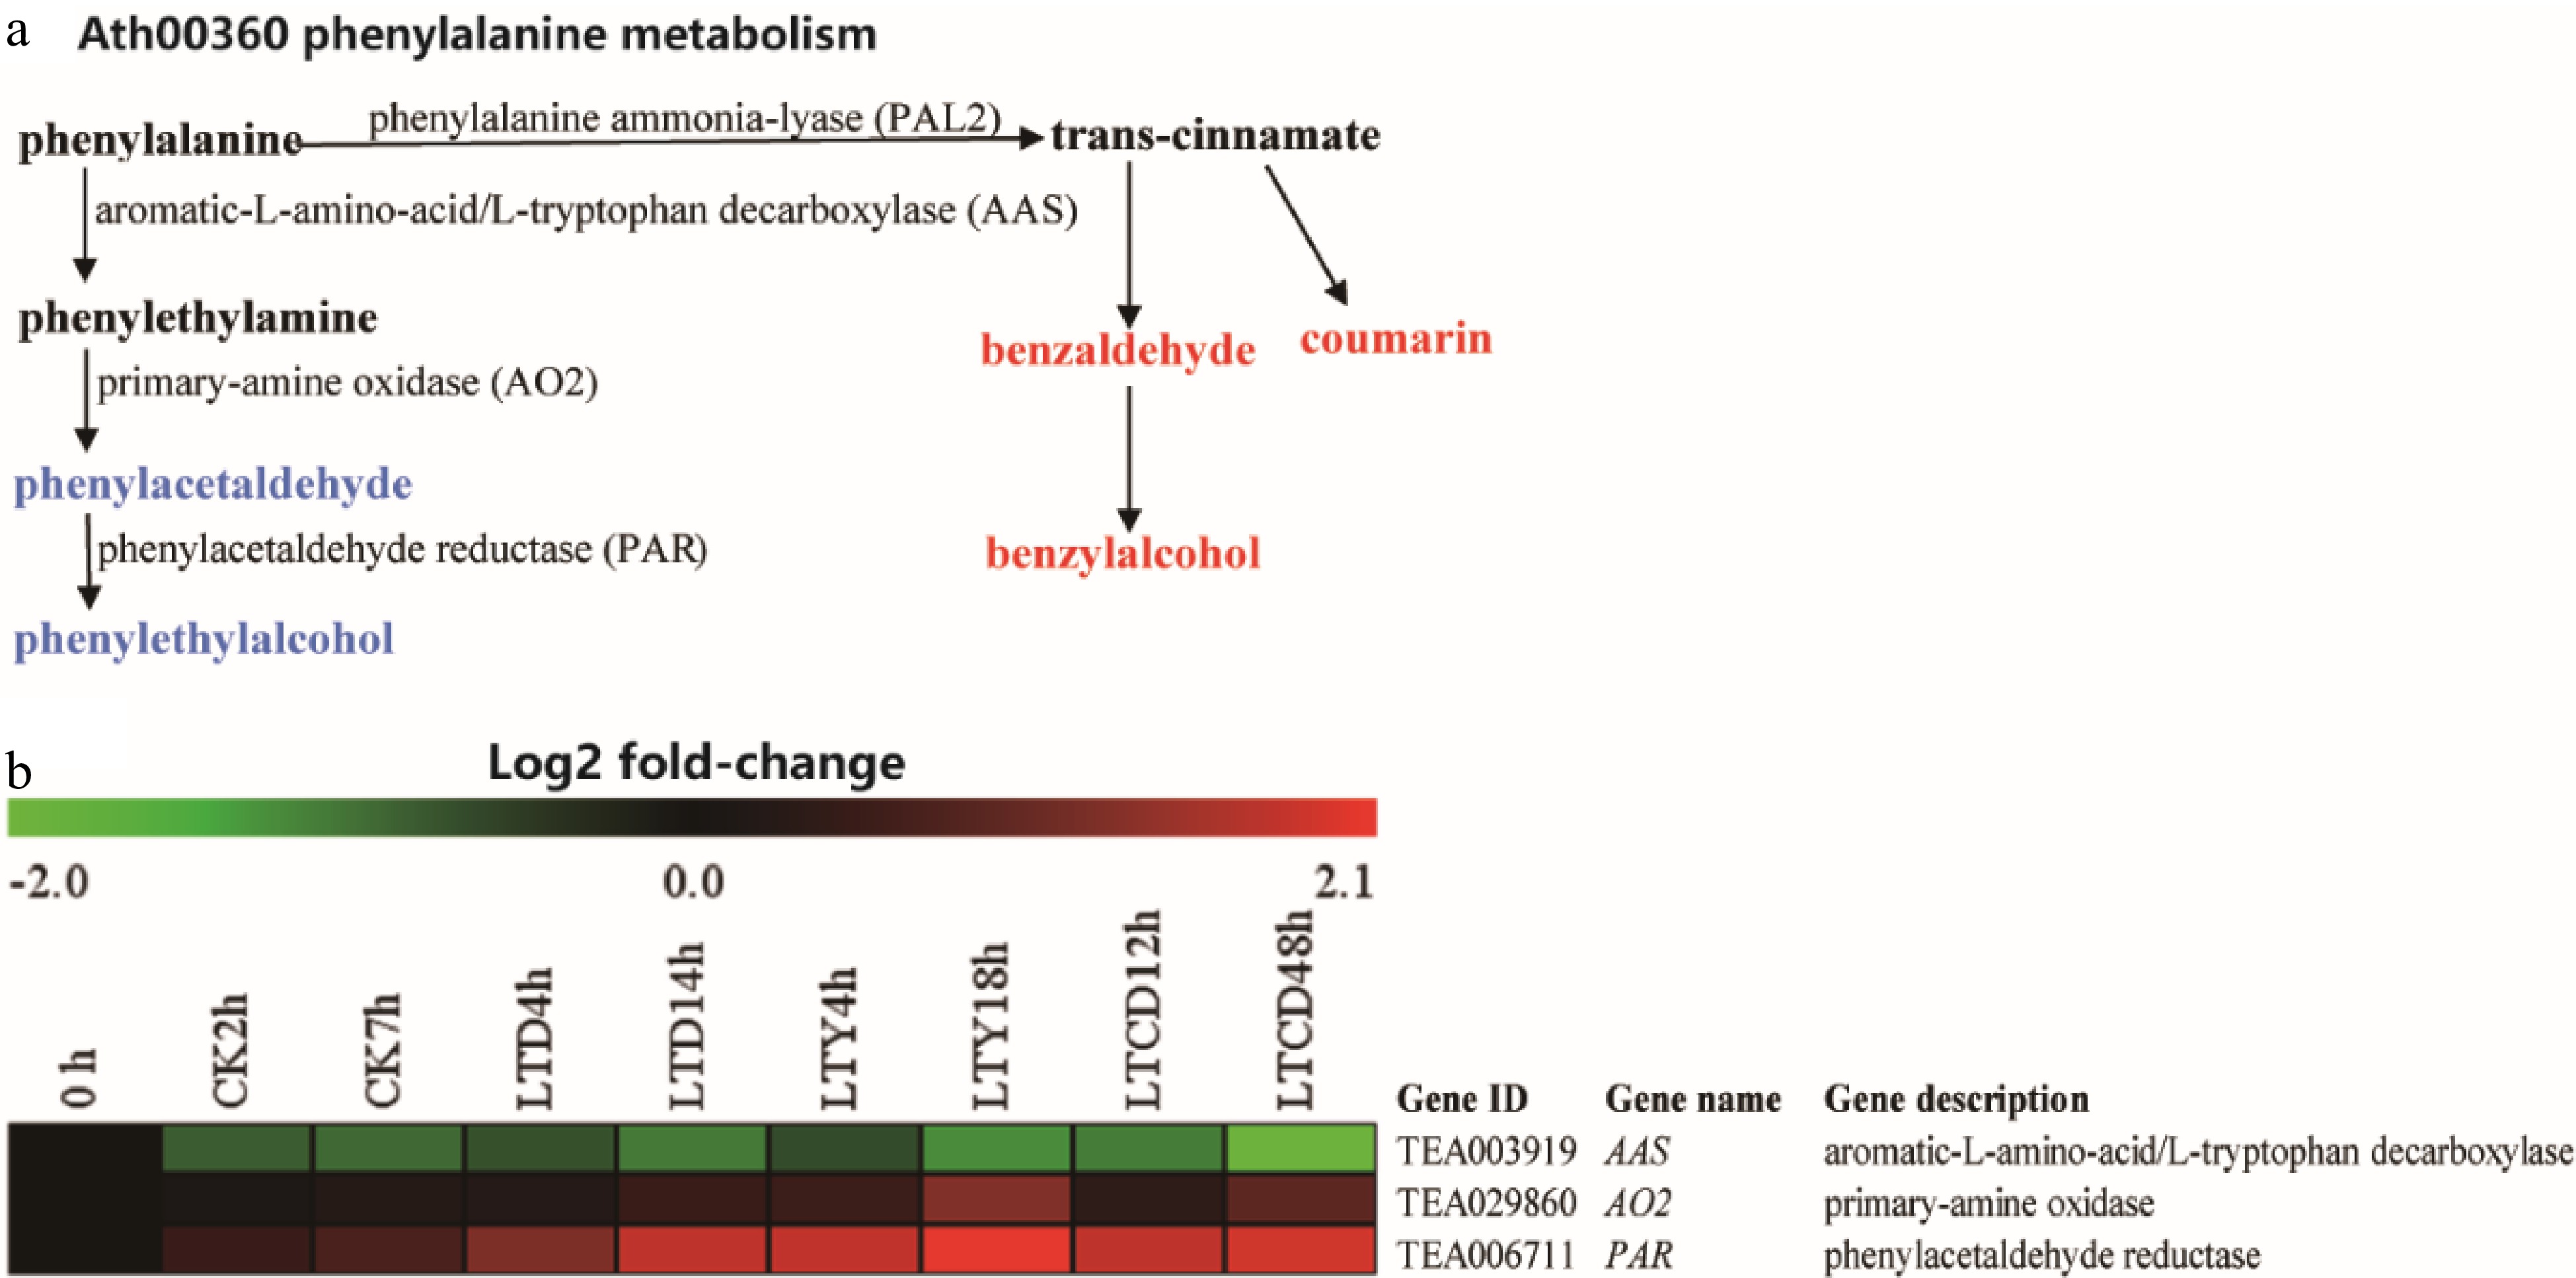
Figure 5. The expression of DEGS involved in phenylethylalcohol biosynthesis under different spreading treatments. (a) KEGG pathways; (b) heat map of DEGs expression profiling from the RNA-Seq data.
Figures
(5)
Tables
(0)