-
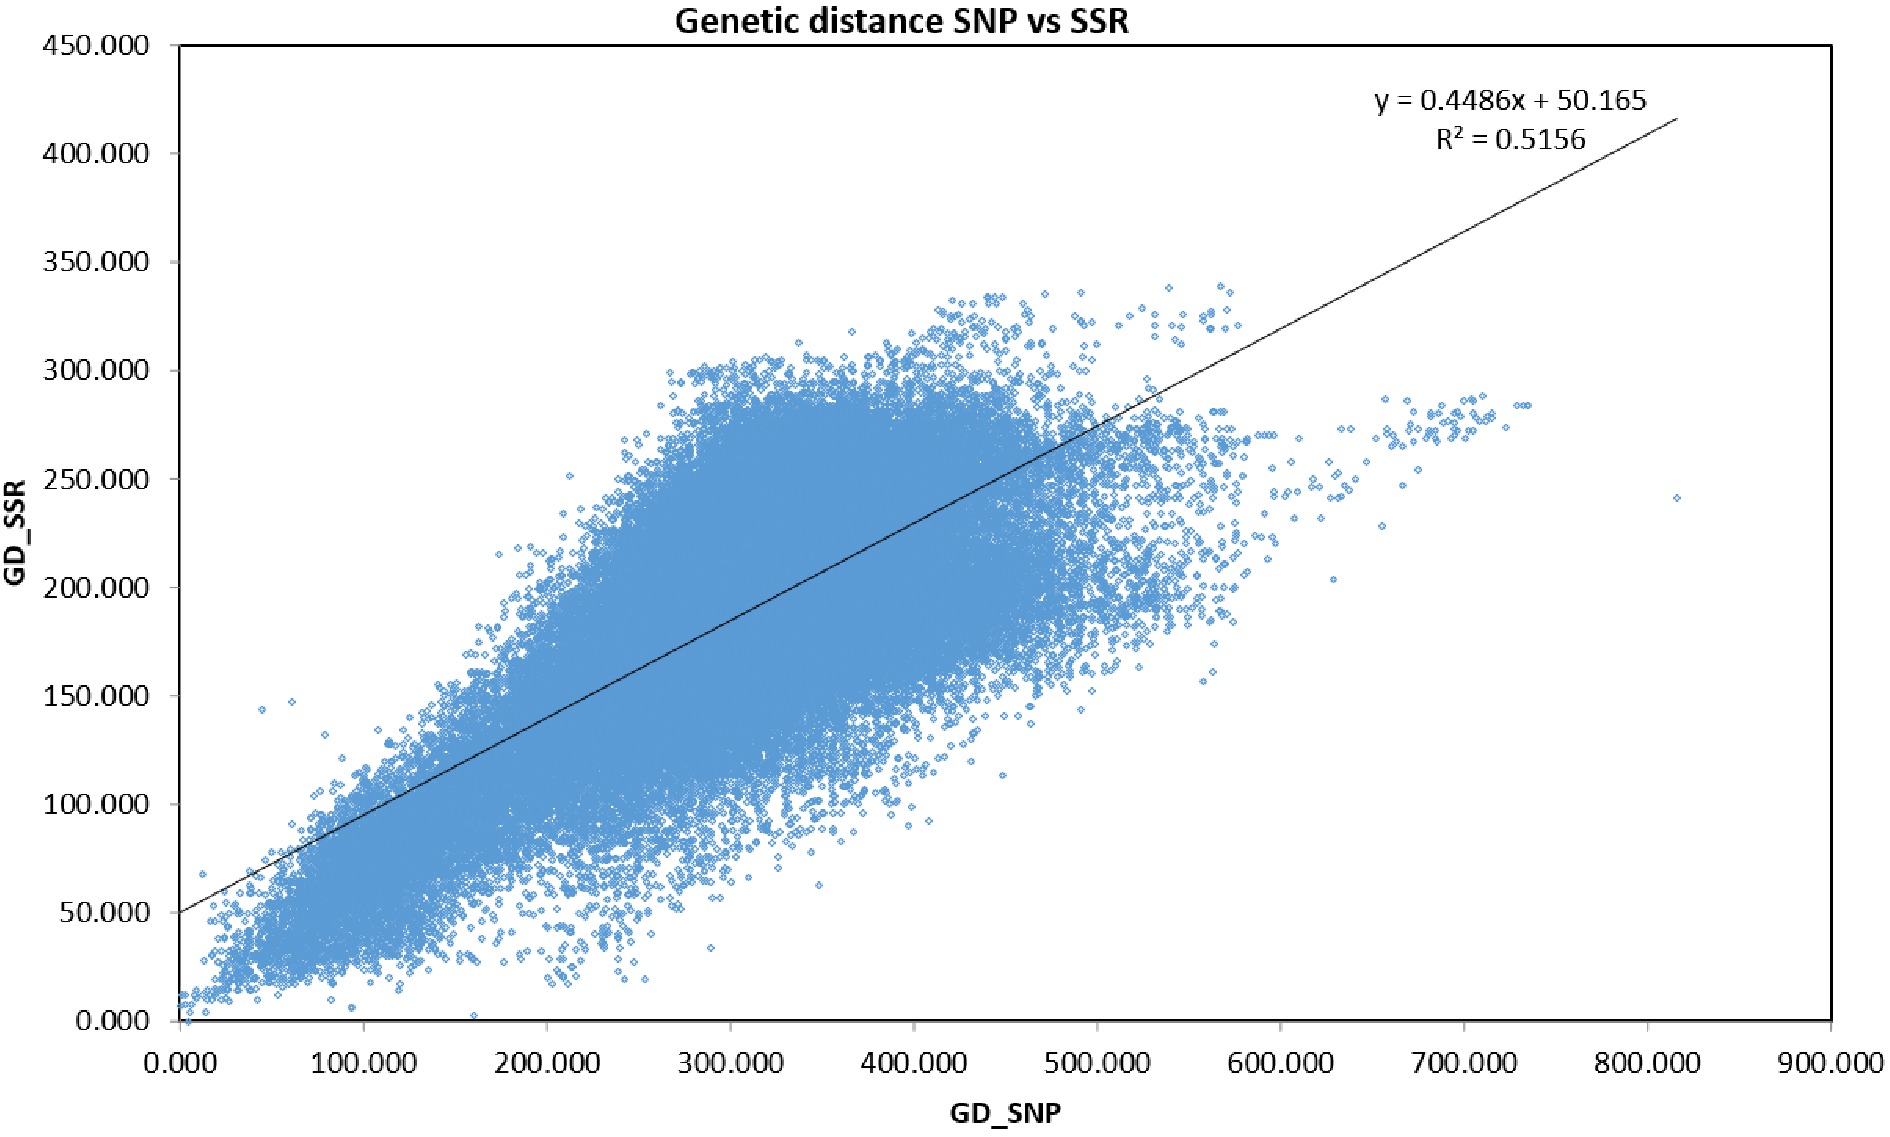
Figure 1.
Mantel test results indicating significant correlation (r = 0.718; P < 0.001) between SNPs and SSR markers.
-
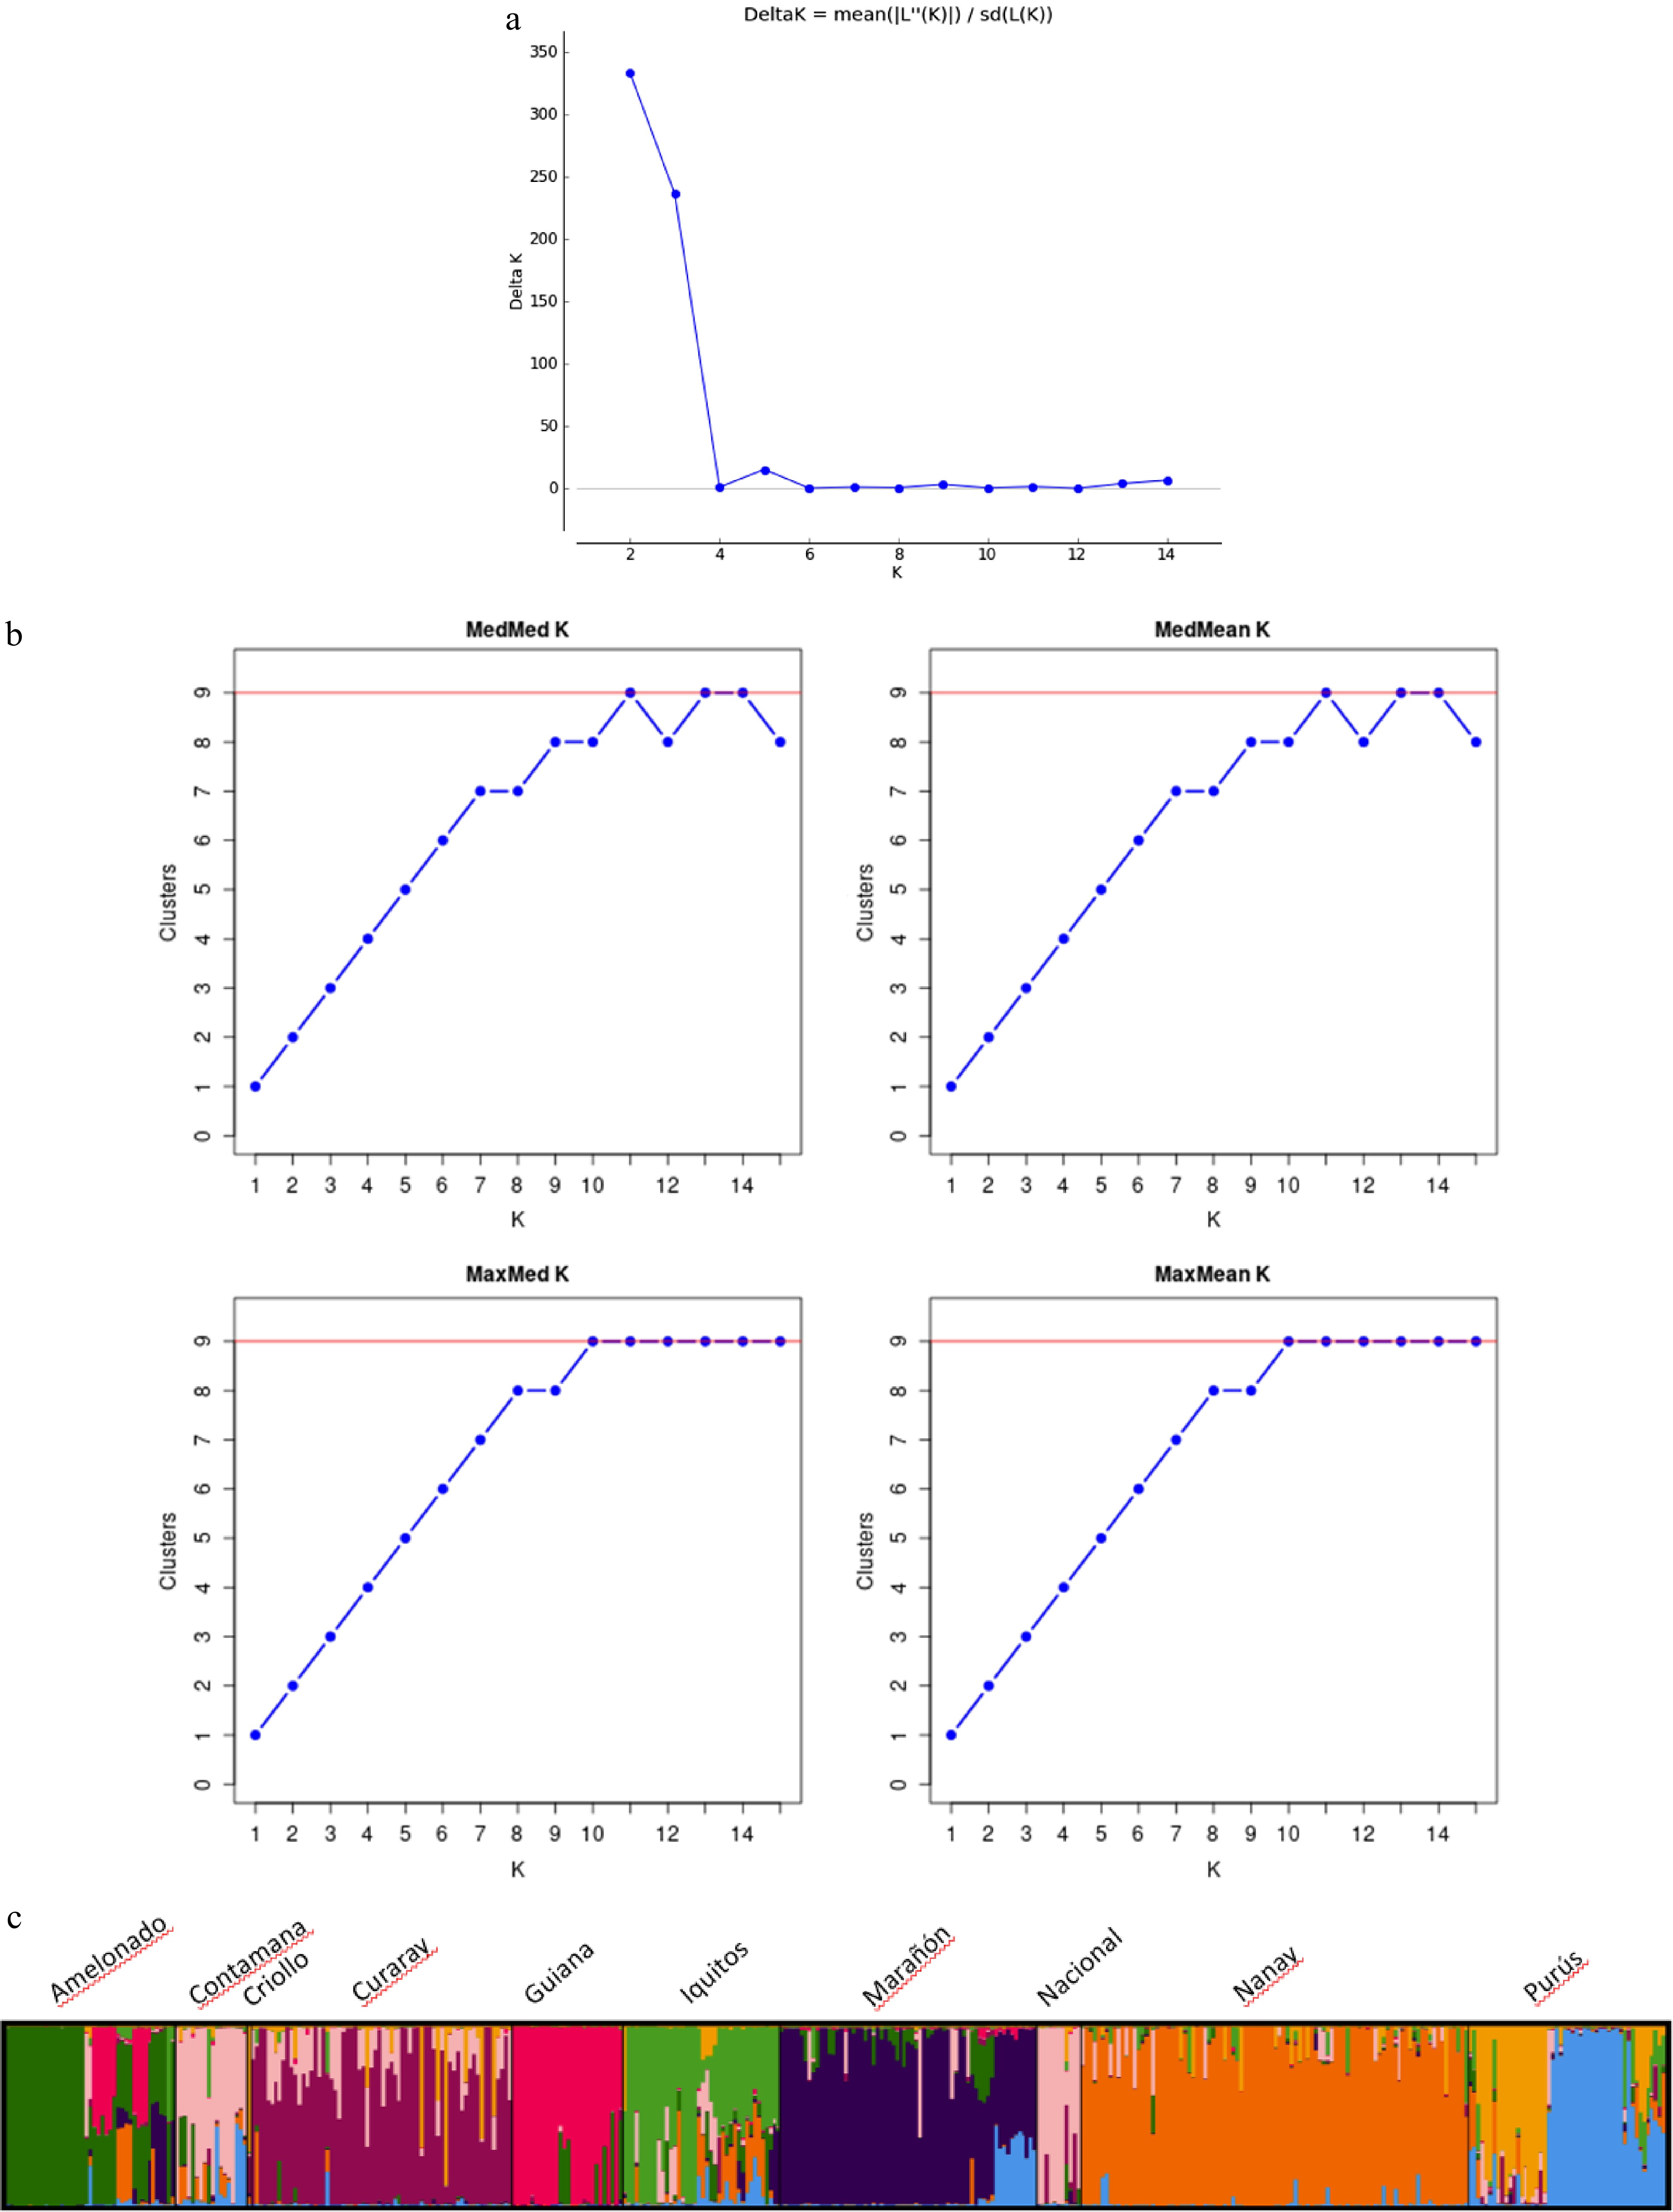
Figure 2.
(a) Number of clusters based on the Evanno's Delta K value[10]. (b) Inferred clusters obtained using the method of Puechmaille. (c) Population structure of the 420 cacao accessions (Theobroma cacao L.) germplasm collections containing representative genotypes of the nine cacao genetic groups obtained using Structure v2.3.3. Black vertical lines indicate the separation of the genetic groups. Multiple colors within the genetic group imply admixed individuals.
-
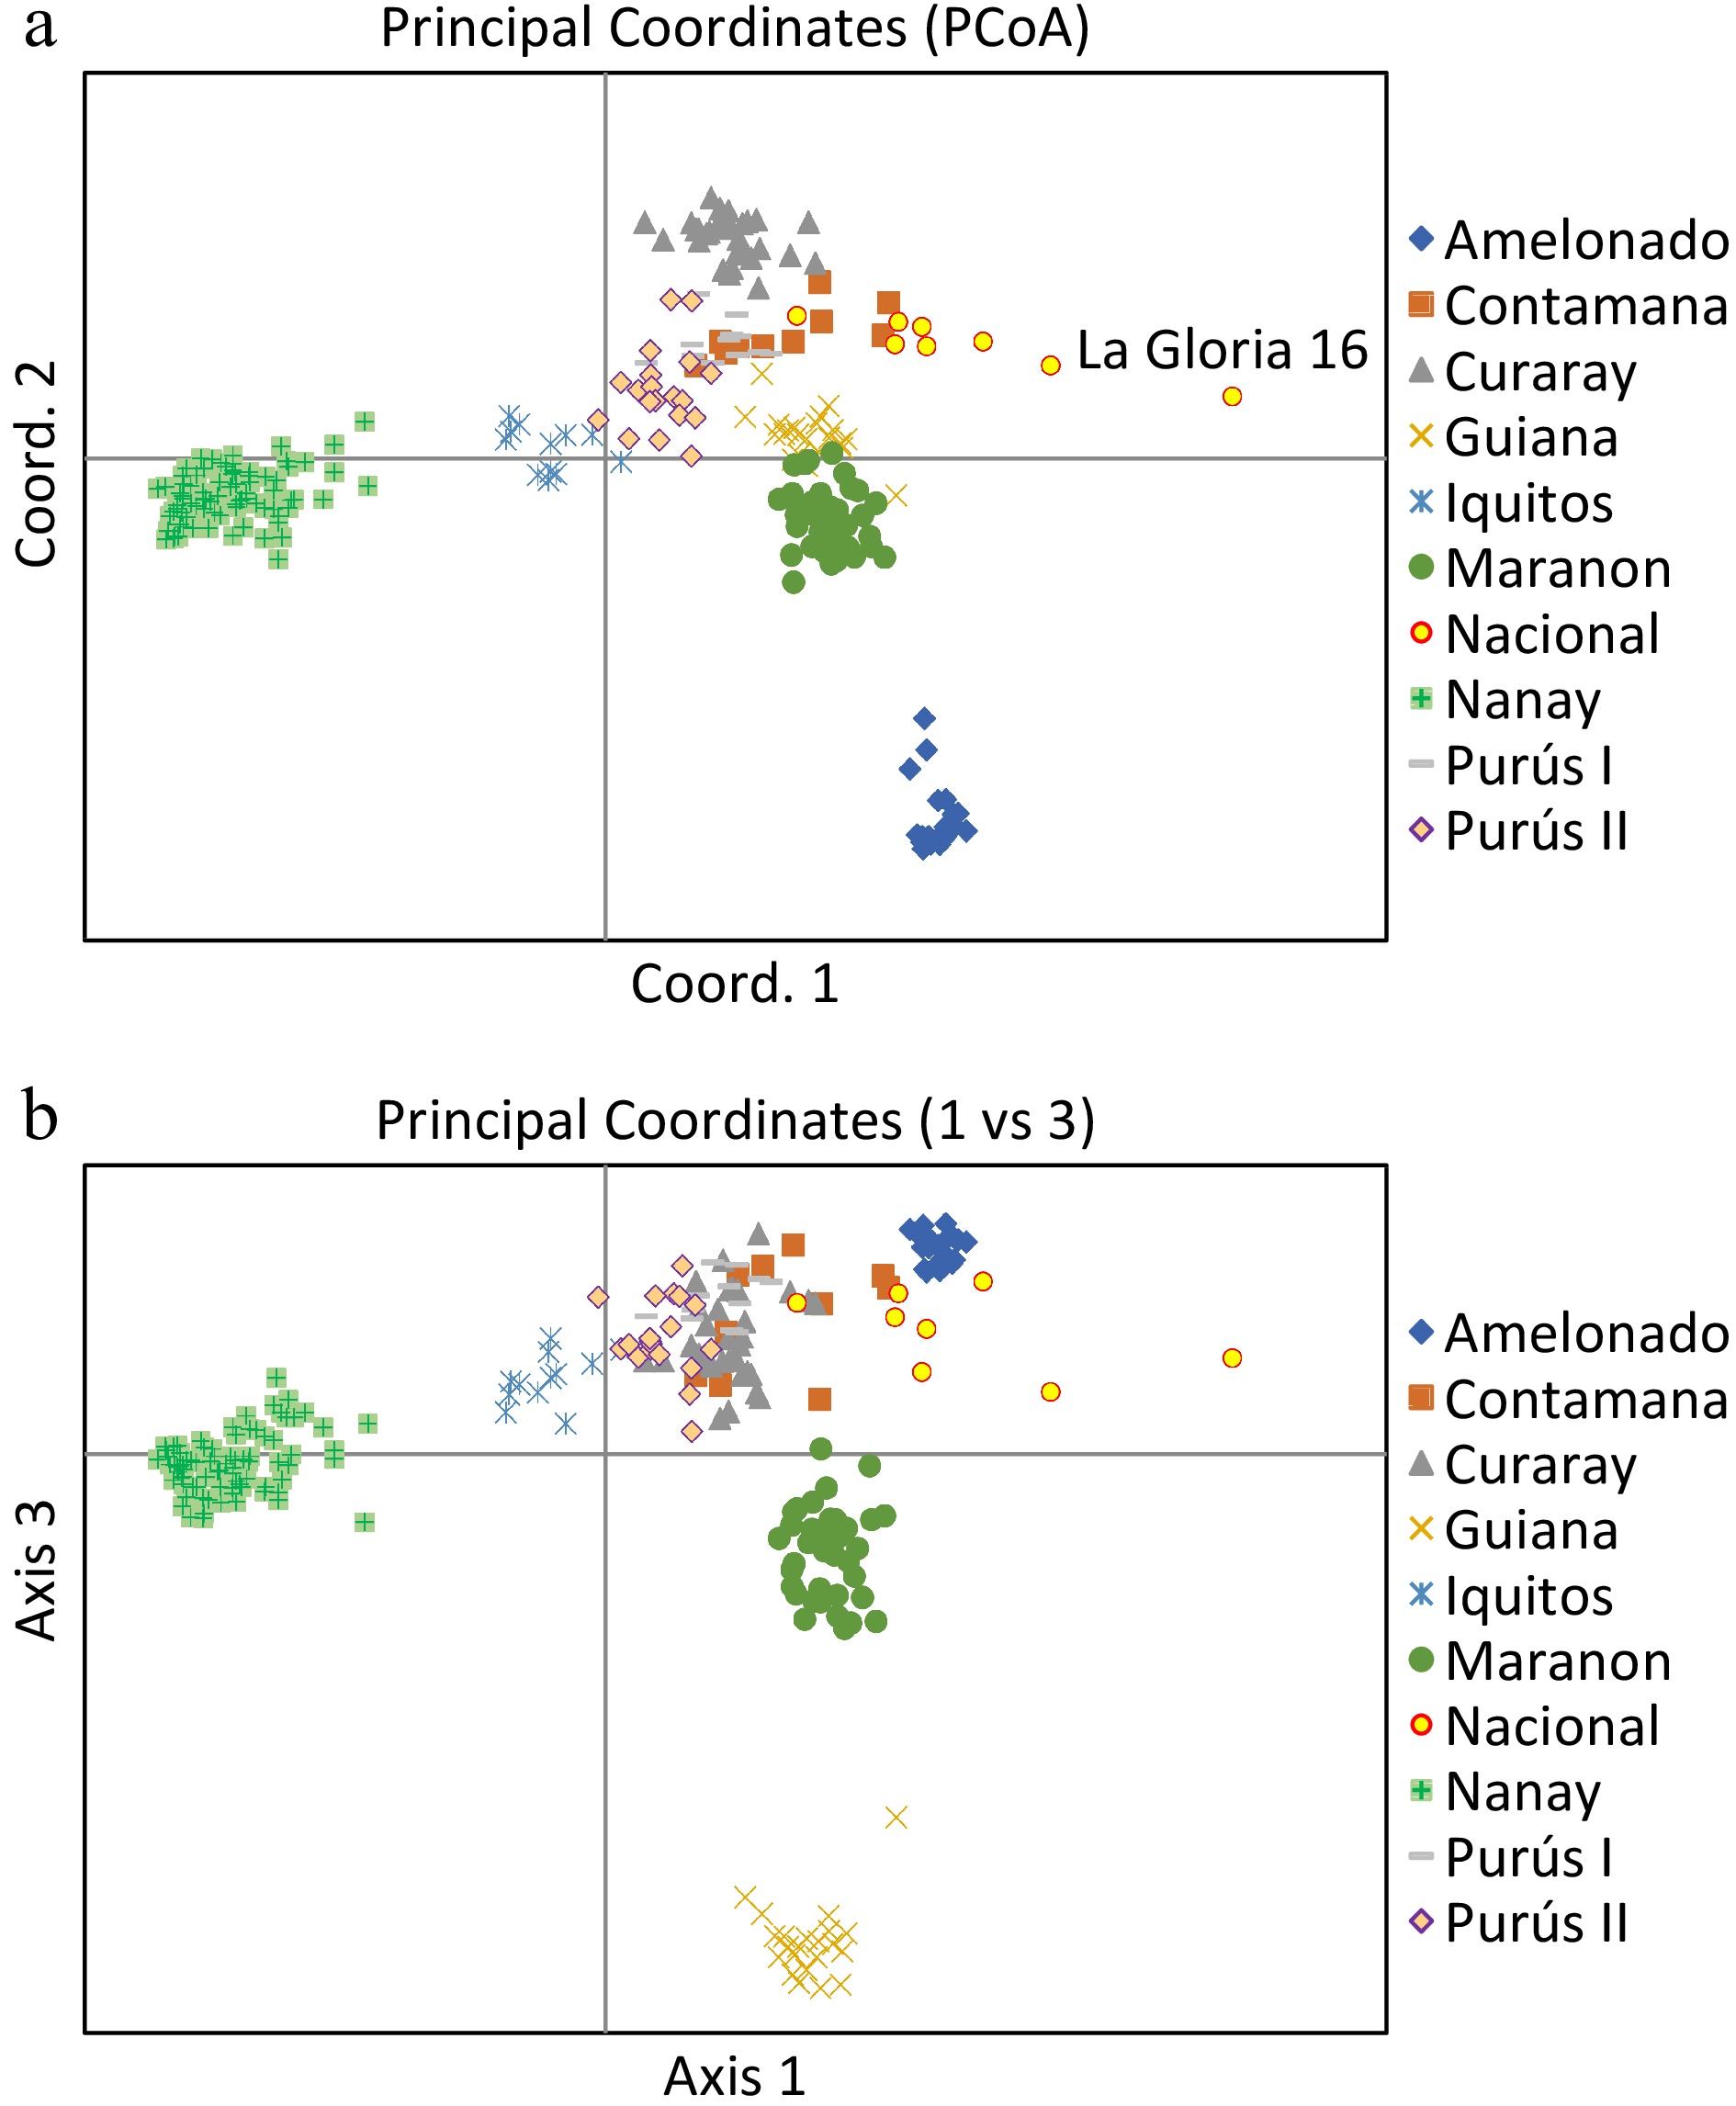
Figure 3.
Principal Coordinates Analysis plots of 420 cacao accessions belonging to nine genetic groups. The plane of the first three main axes accounted for: first axis = 23.1%, the second = 7.6% and the third = 3.8% of the total variation.
-
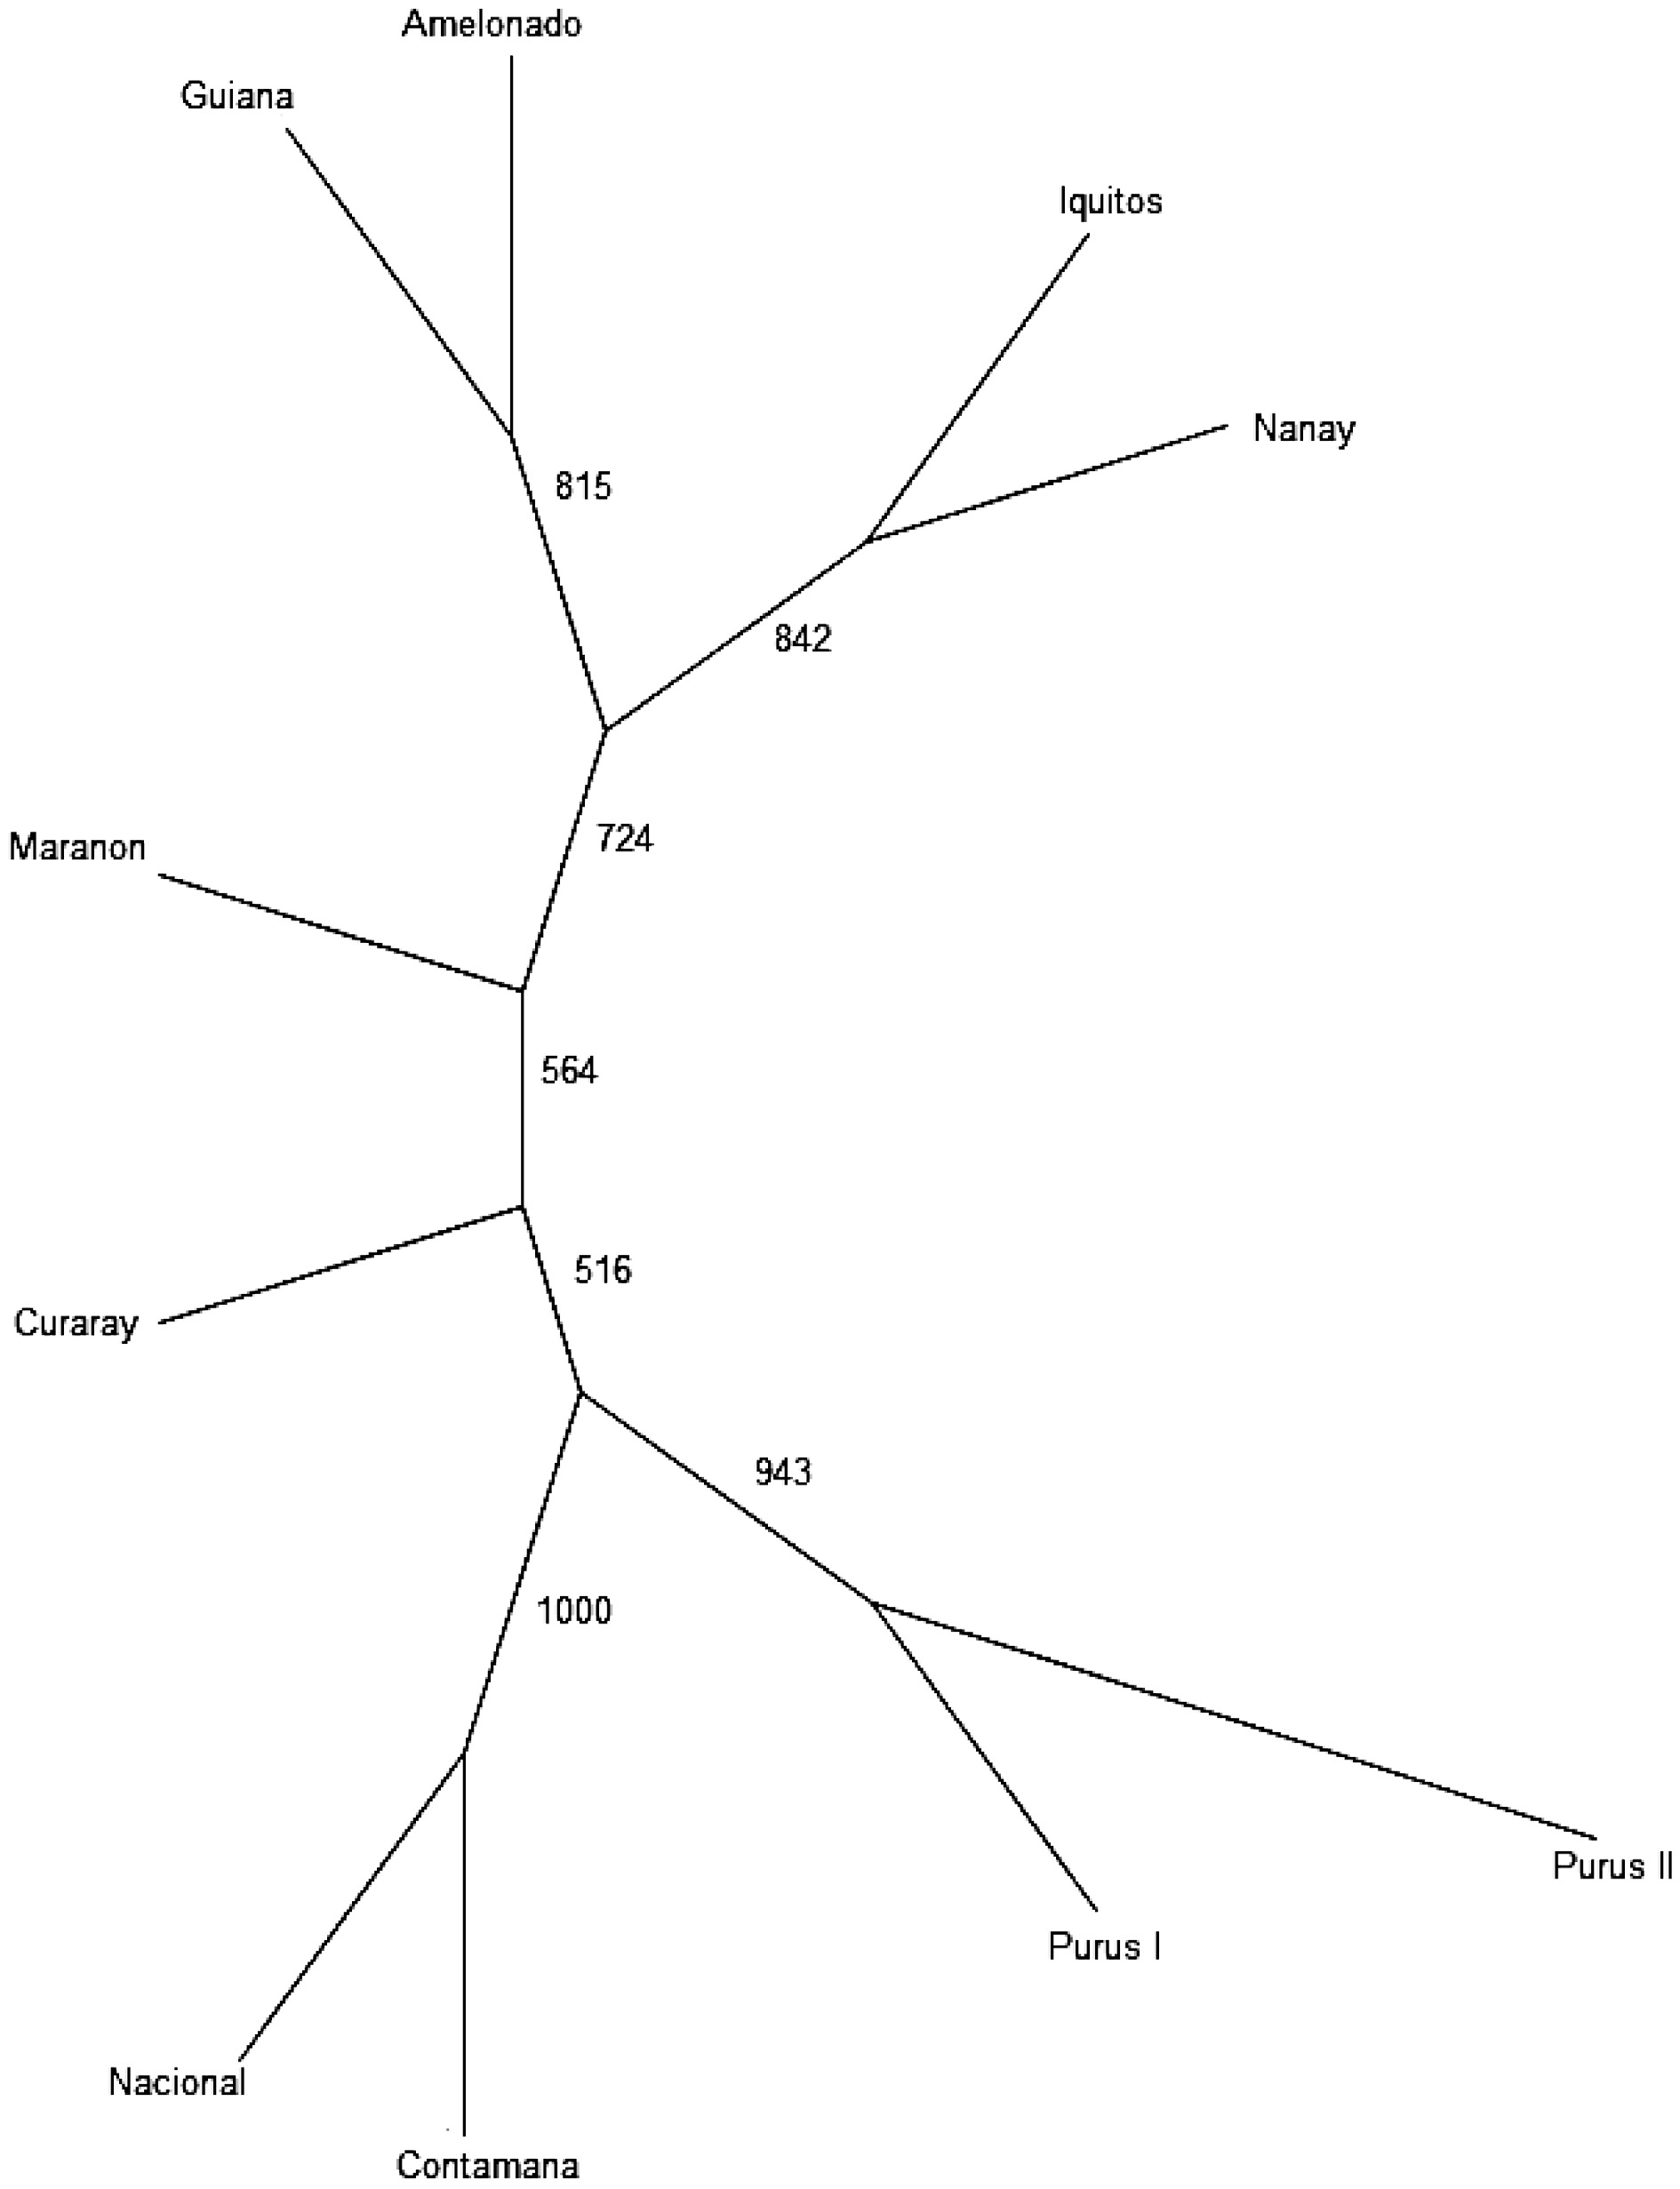
Figure 4.
UPGMA tree indicating the relationships among the genetic groups.
-
Source of variation d.f. Sum of squares Means squares Est. Var % Among populations 9 12,047.62 1,338.62 53.84 53 Within populations 215 11,874.38 47.69 47.69 47 Total 435 23,922.00 16.57380 101.53 100 Table 1.
Analysis of molecular variance (AMOVA) for the nine cacao genetics groups.
-
Populations Amelonado Contamana Curaray Guiana Iquitos Marañon Nacional Nanay Purús I Purús II Amelonado 0.000 0.001 0.001 0.001 0.001 0.001 0.001 0.001 0.001 0.001 Contamana 0.633 0.000 0.001 0.001 0.001 0.001 0.011 0.001 0.001 0.001 Curaray 0.645 0.407 0.000 0.001 0.001 0.001 0.001 0.001 0.001 0.001 Guiana 0.702 0.561 0.540 0.000 0.001 0.001 0.001 0.001 0.001 0.001 Iquitos 0.695 0.462 0.500 0.634 0.000 0.001 0.001 0.001 0.001 0.001 Maranon 0.539 0.406 0.443 0.477 0.444 0.000 0.001 0.001 0.001 0.001 Nacional 0.622 0.095 0.436 0.561 0.499 0.395 0.000 0.001 0.001 0.001 Nanay 0.712 0.593 0.558 0.644 0.489 0.547 0.673 0.000 0.001 0.001 Purús I 0.637 0.319 0.373 0.568 0.437 0.404 0.317 0.555 0.000 0.001 Purús II 0.577 0.300 0.382 0.508 0.360 0.367 0.336 0.483 0.268 0.000 Note: PhiPT Values below diagonal. Probability, P (r and ≥ data) based on 999 permutations is shown above the diagonal. Table 2.
Pairwise Population PhiPT Values among nine cacao germplasm groups.
-
Amelonado Contamana Curaray Guiana Iquitos Marañon Nacional Nanay Purús I Purús II Amelonado 0.000 Contamana 0.181 0.000 Curaray 0.179 0.092 0.000 Guiana 0.180 0.143 0.124 0.000 Iquitos 0.180 0.117 0.113 0.150 0.000 Maranon 0.129 0.094 0.095 0.104 0.098 0.000 Nacional 0.166 0.038 0.101 0.138 0.129 0.091 0.000 Nanay 0.194 0.135 0.121 0.150 0.087 0.115 0.176 0.000 Purús I 0.168 0.085 0.078 0.133 0.100 0.087 0.083 0.114 0.000 Purús II 0.157 0.083 0.086 0.125 0.082 0.077 0.094 0.092 0.065 0.000 Table 3.
Pairwise Population Fst Values based on the result of population stratification. Within each population, samples with the assignment coefficient > 0.75 were retained for analysis.
Figures
(4)
Tables
(3)