-
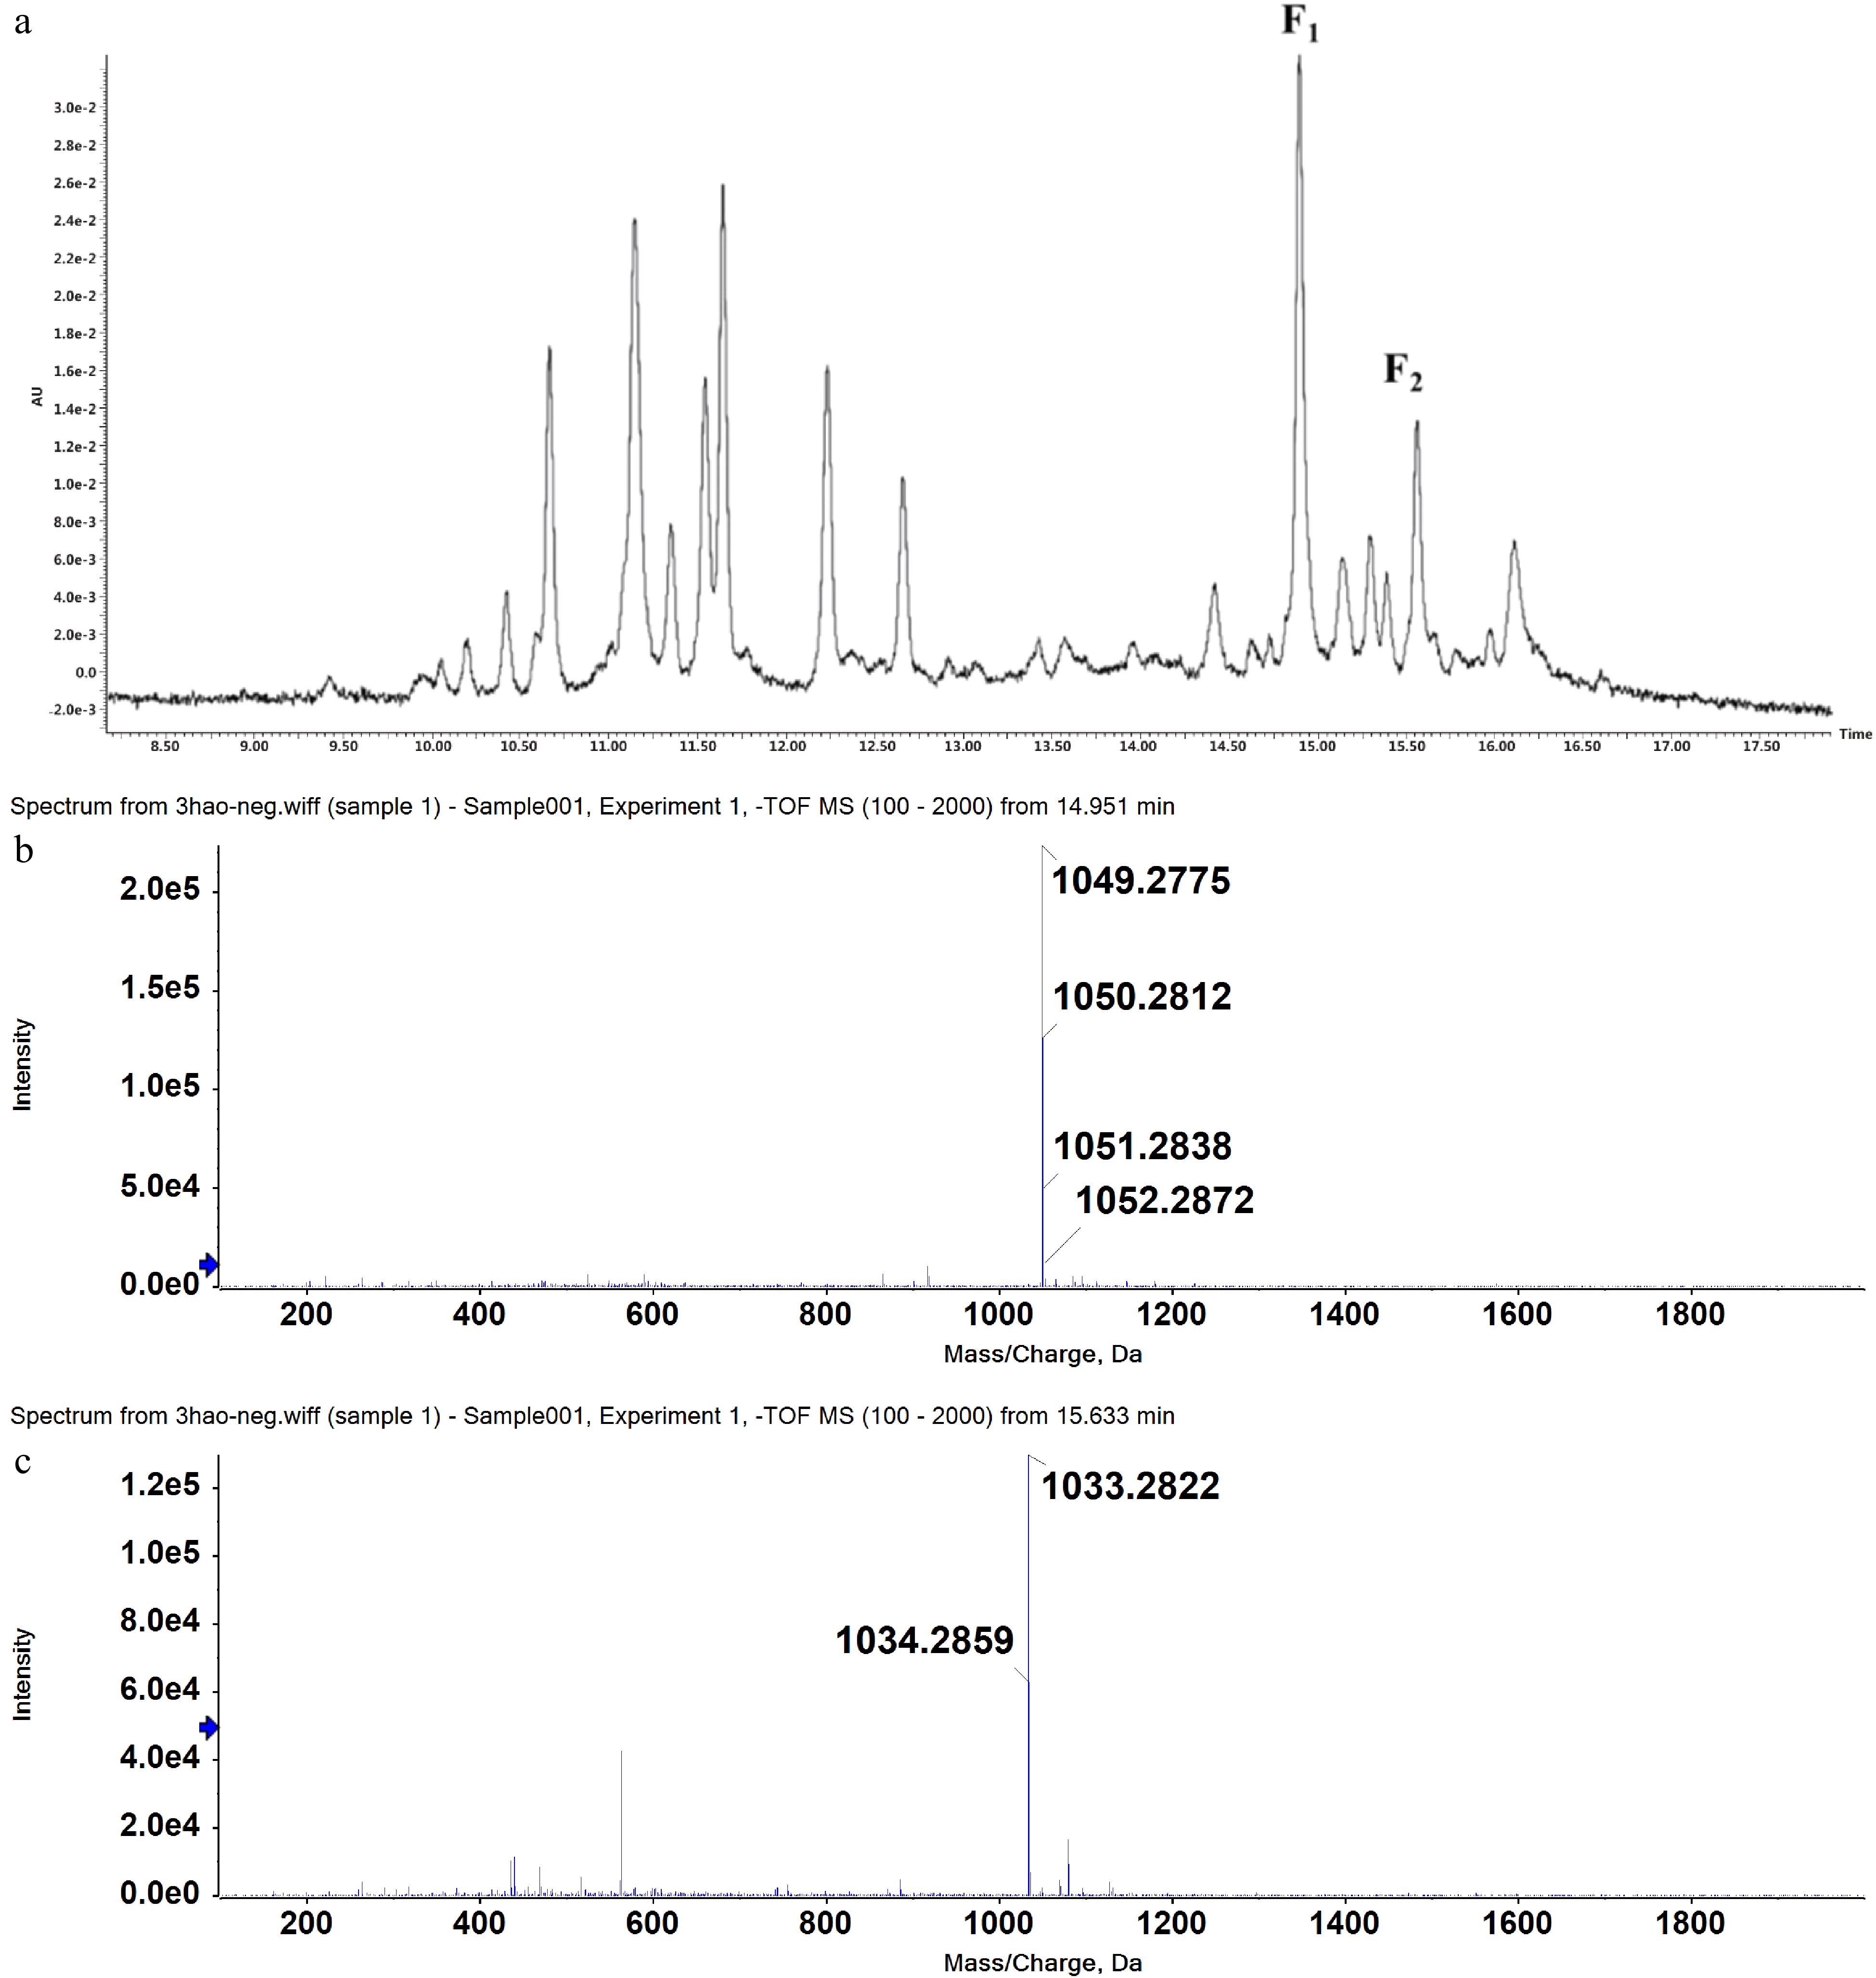
Figure 1.
UPLC chromatogram (UV detection at 360 nm) of ethanol extracts of tea product Y303 (a) and mass spectrometry scan results of peak F1 (b) and peak F2 (c).
-
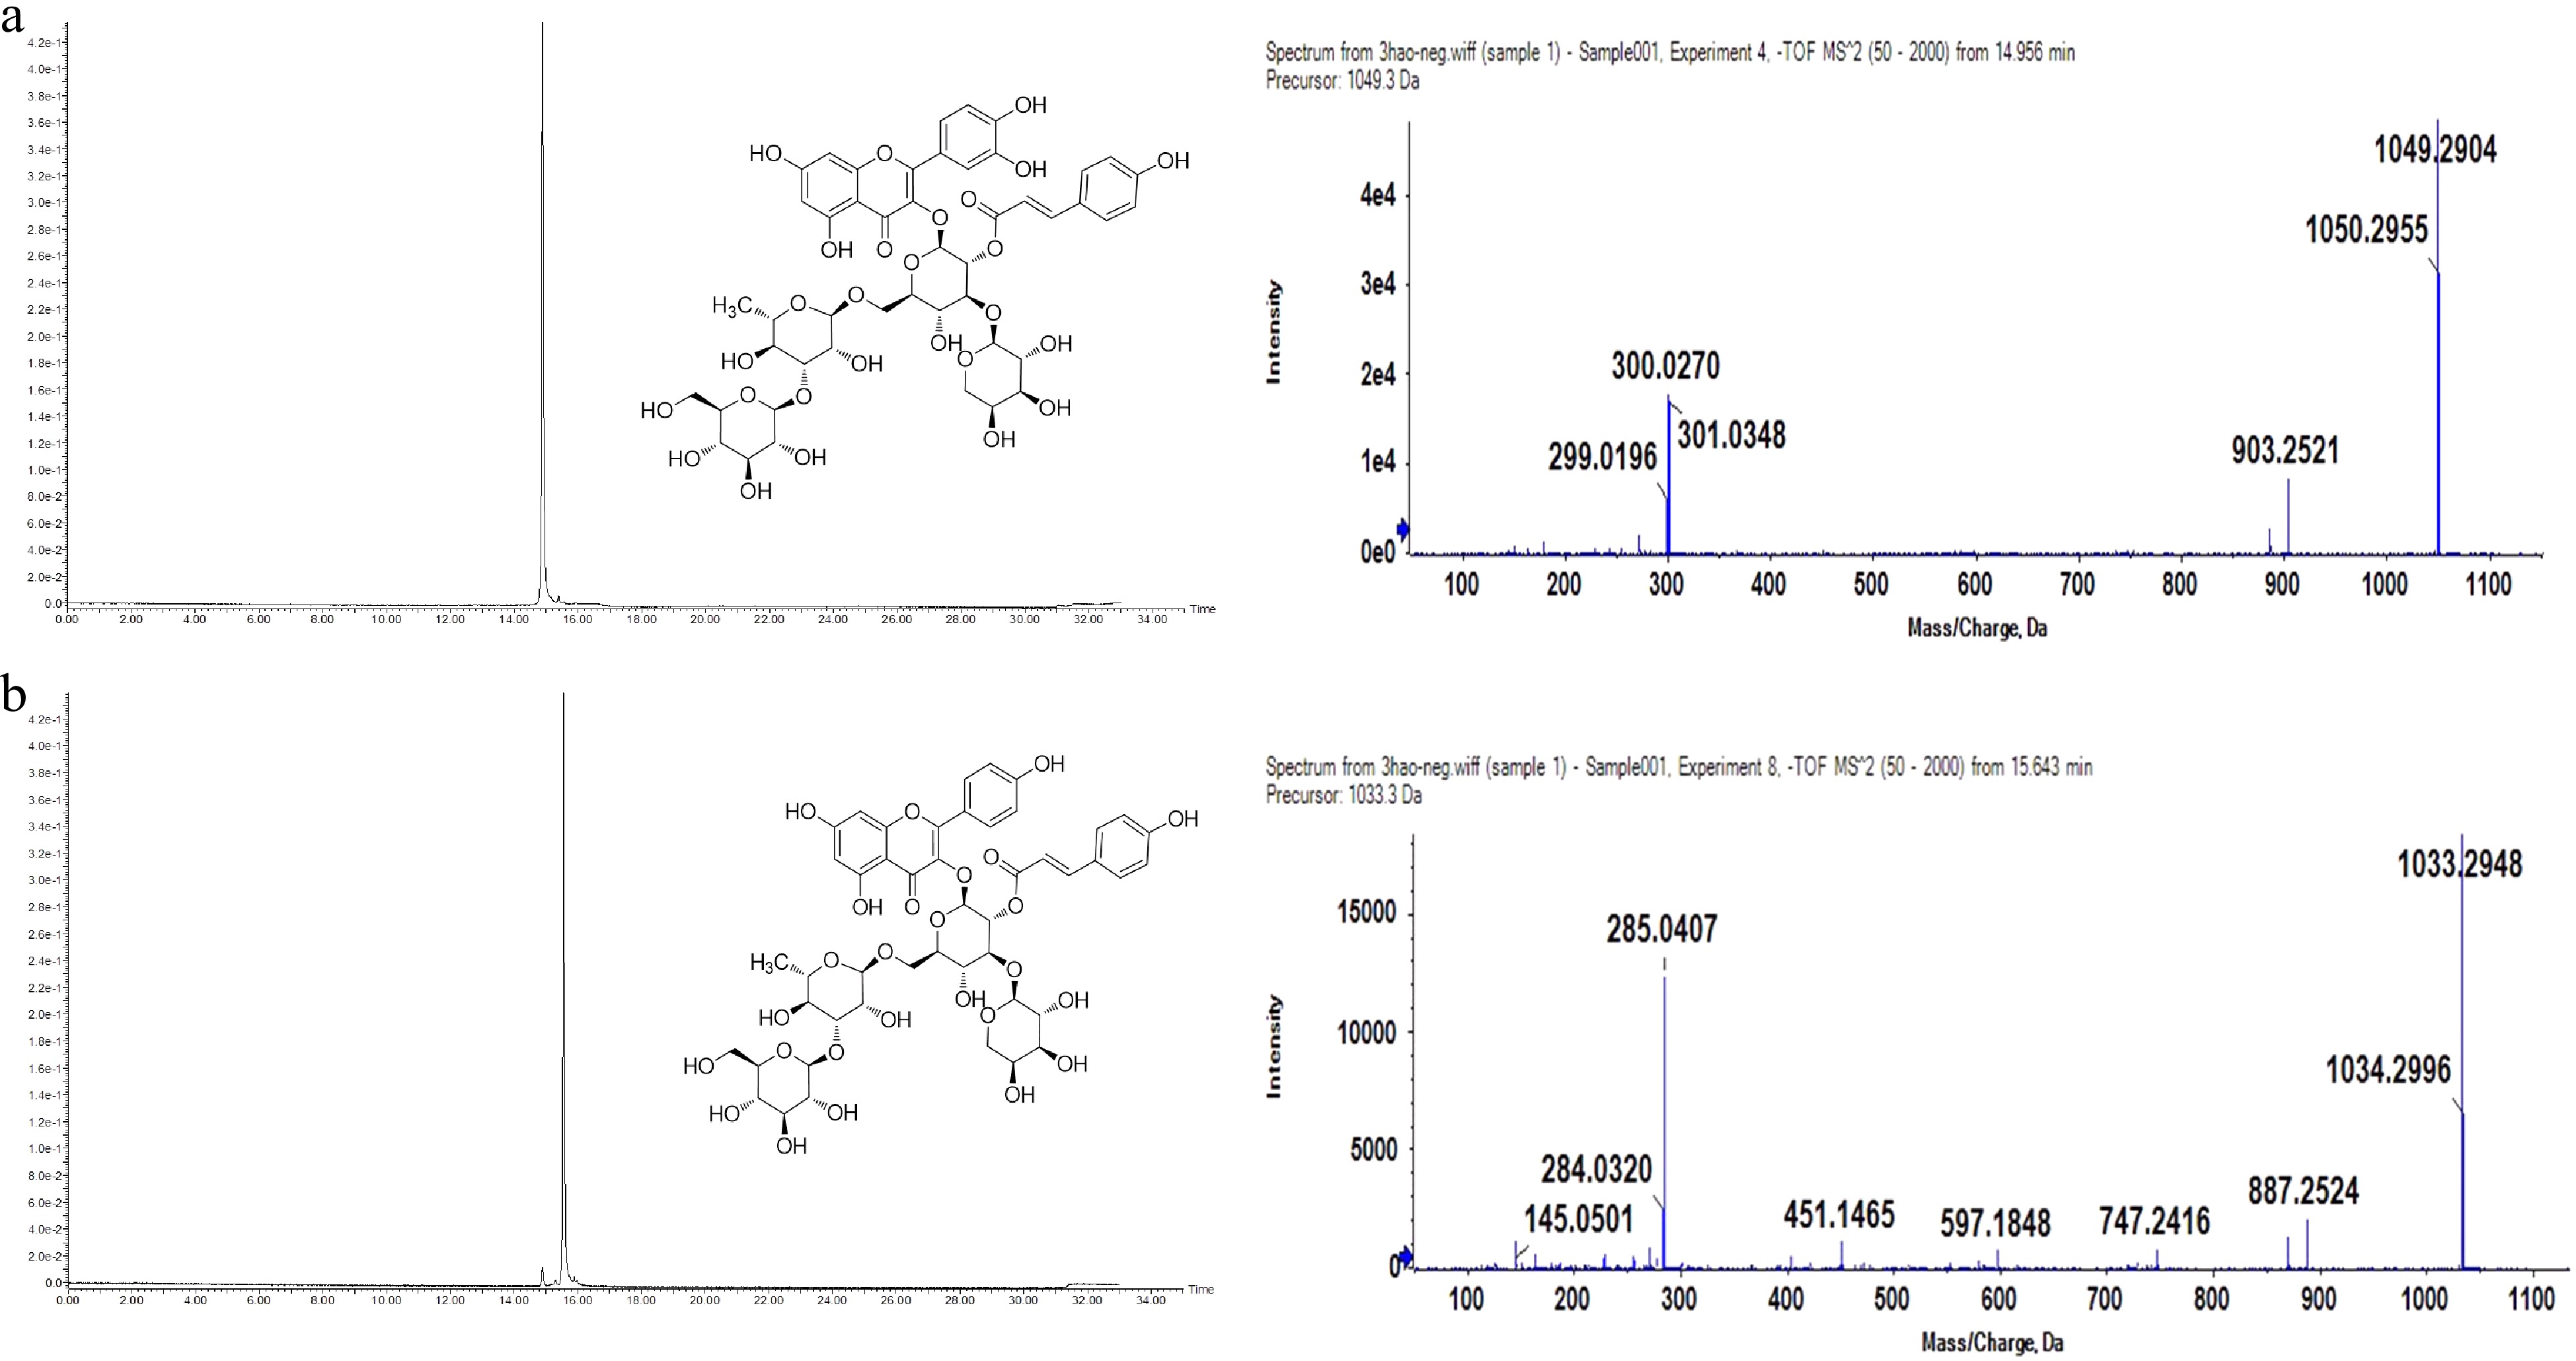
Figure 2.
UPLC (UV detection at 360 nm) and MS/MS chromatograms in negative ion mode of purified F1 (a) and F2 (b).
-
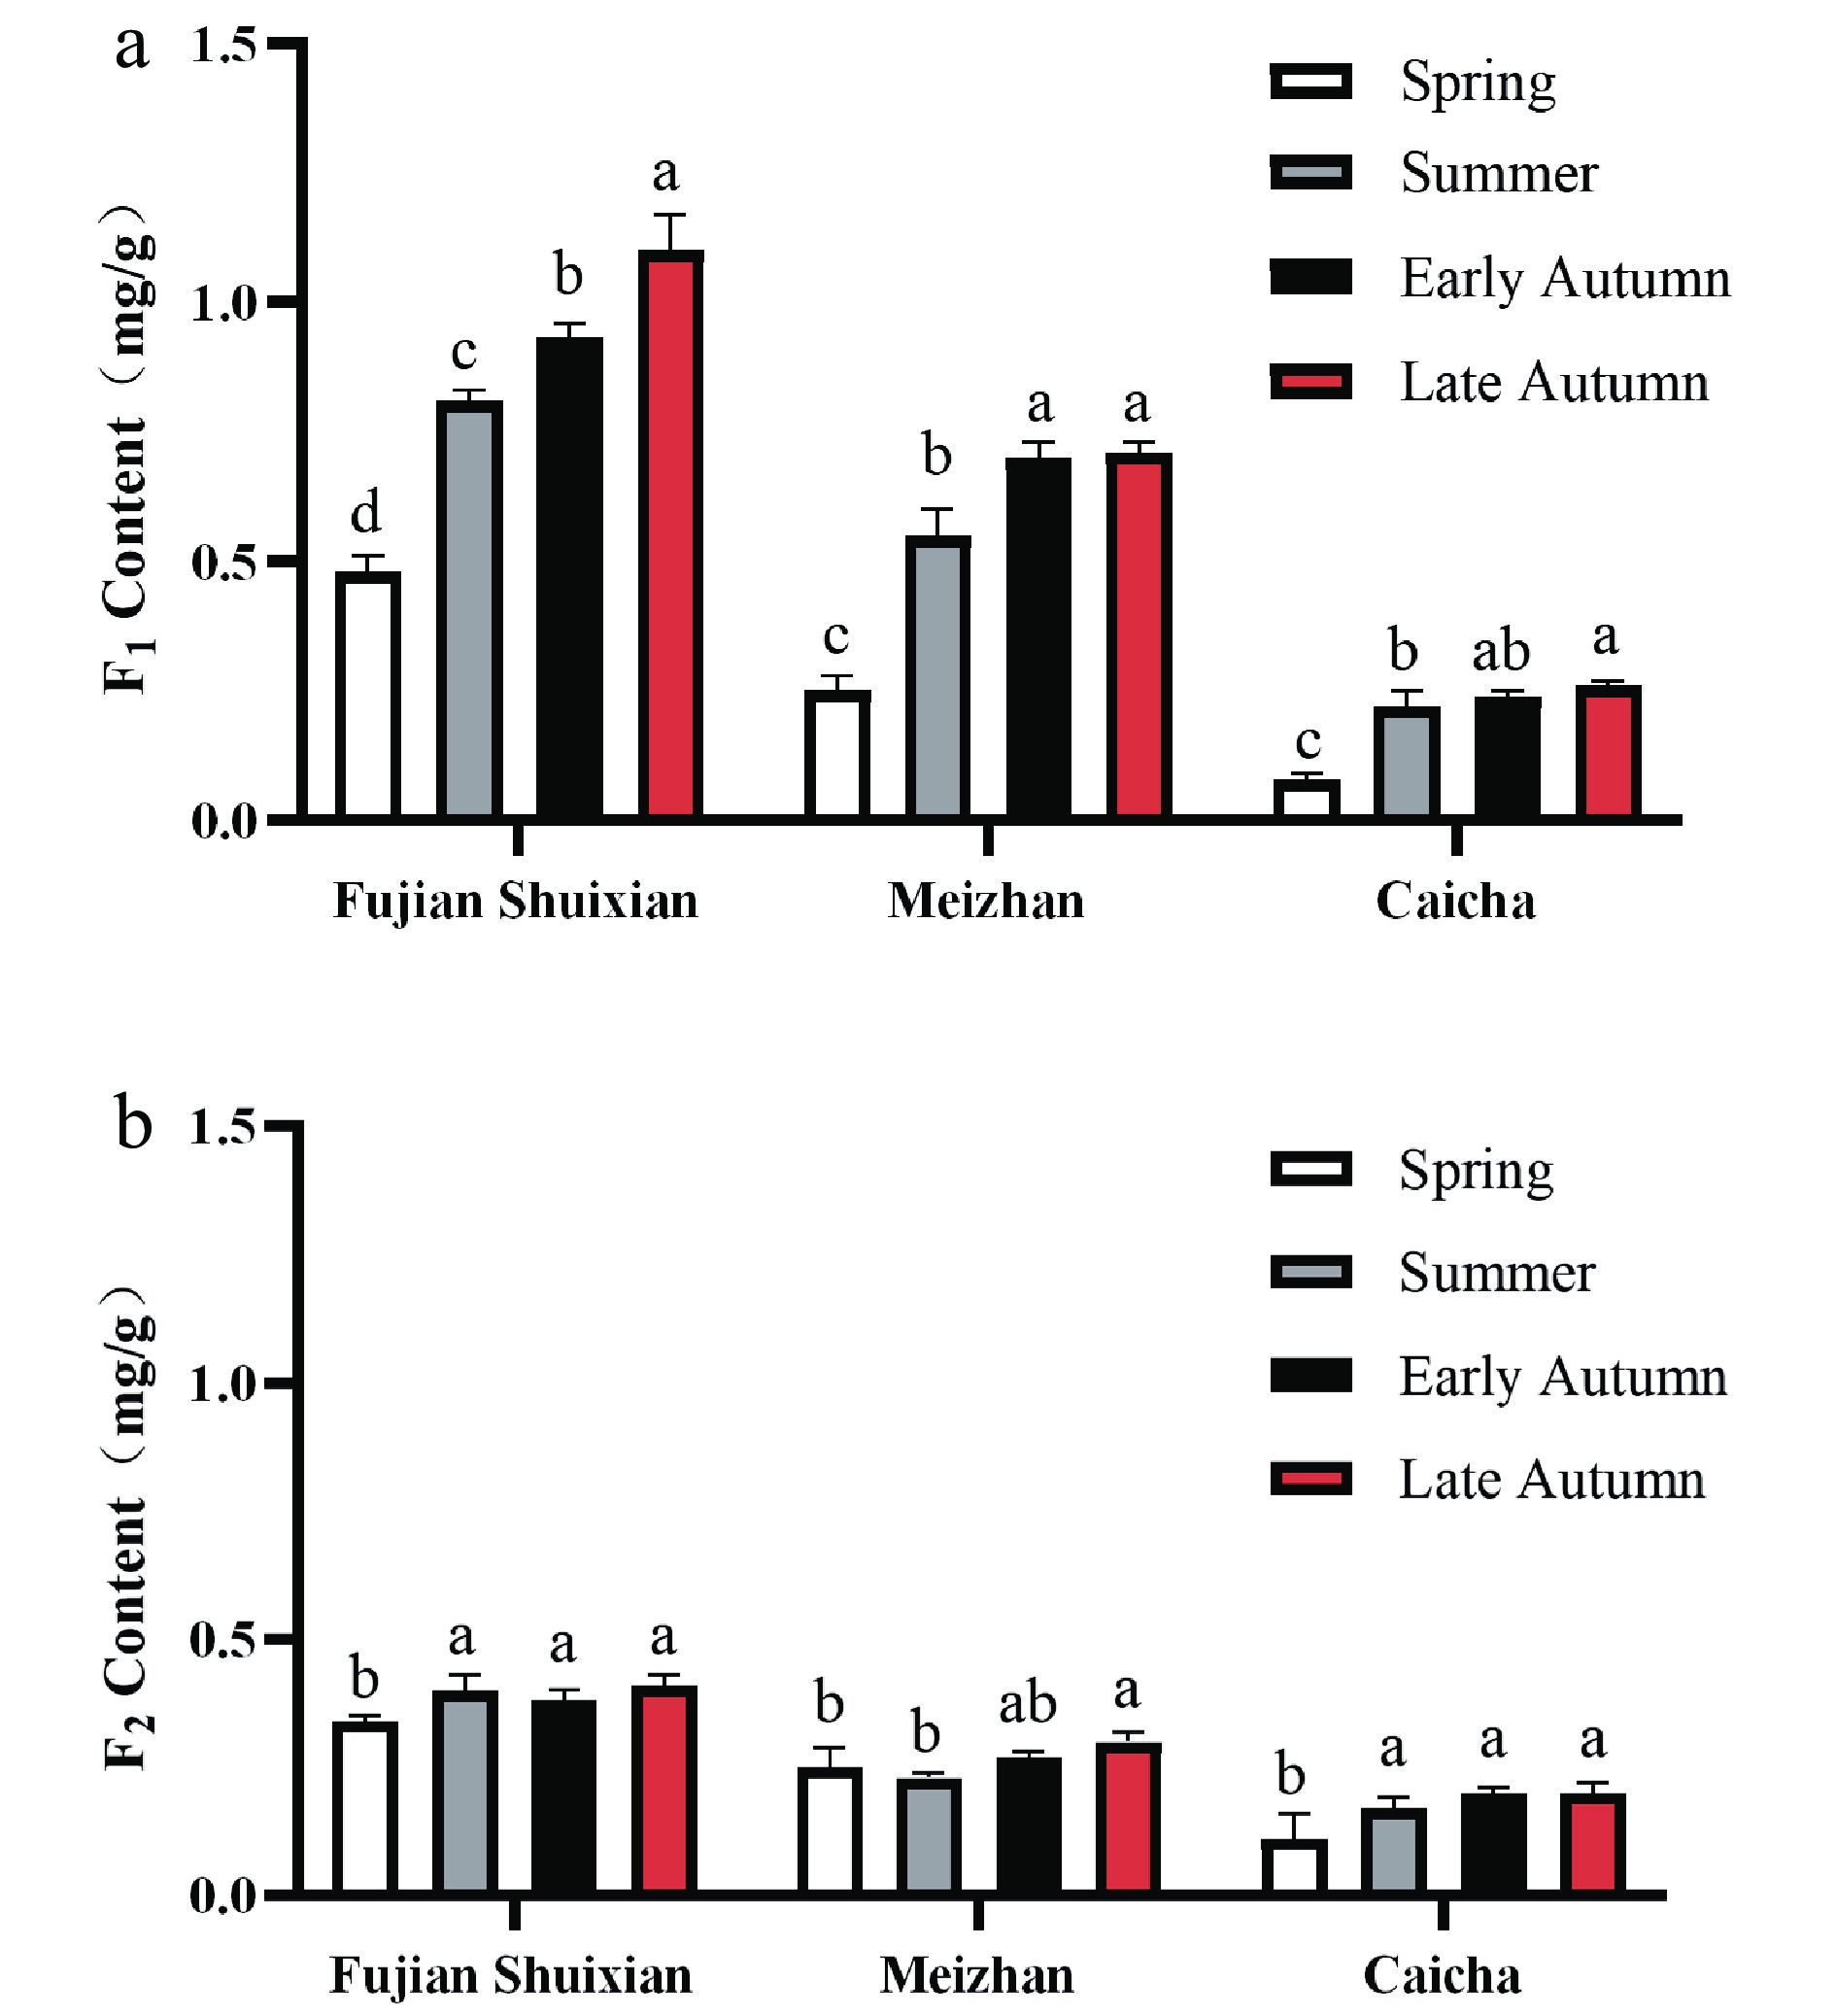
Figure 3.
Seasonal variation of two acylated flavonol glycoside in cultivar teas blended to form tea product Y303. Different letters (a, b, c) for the same cultivar indicate significant difference (p < 0.05).
-
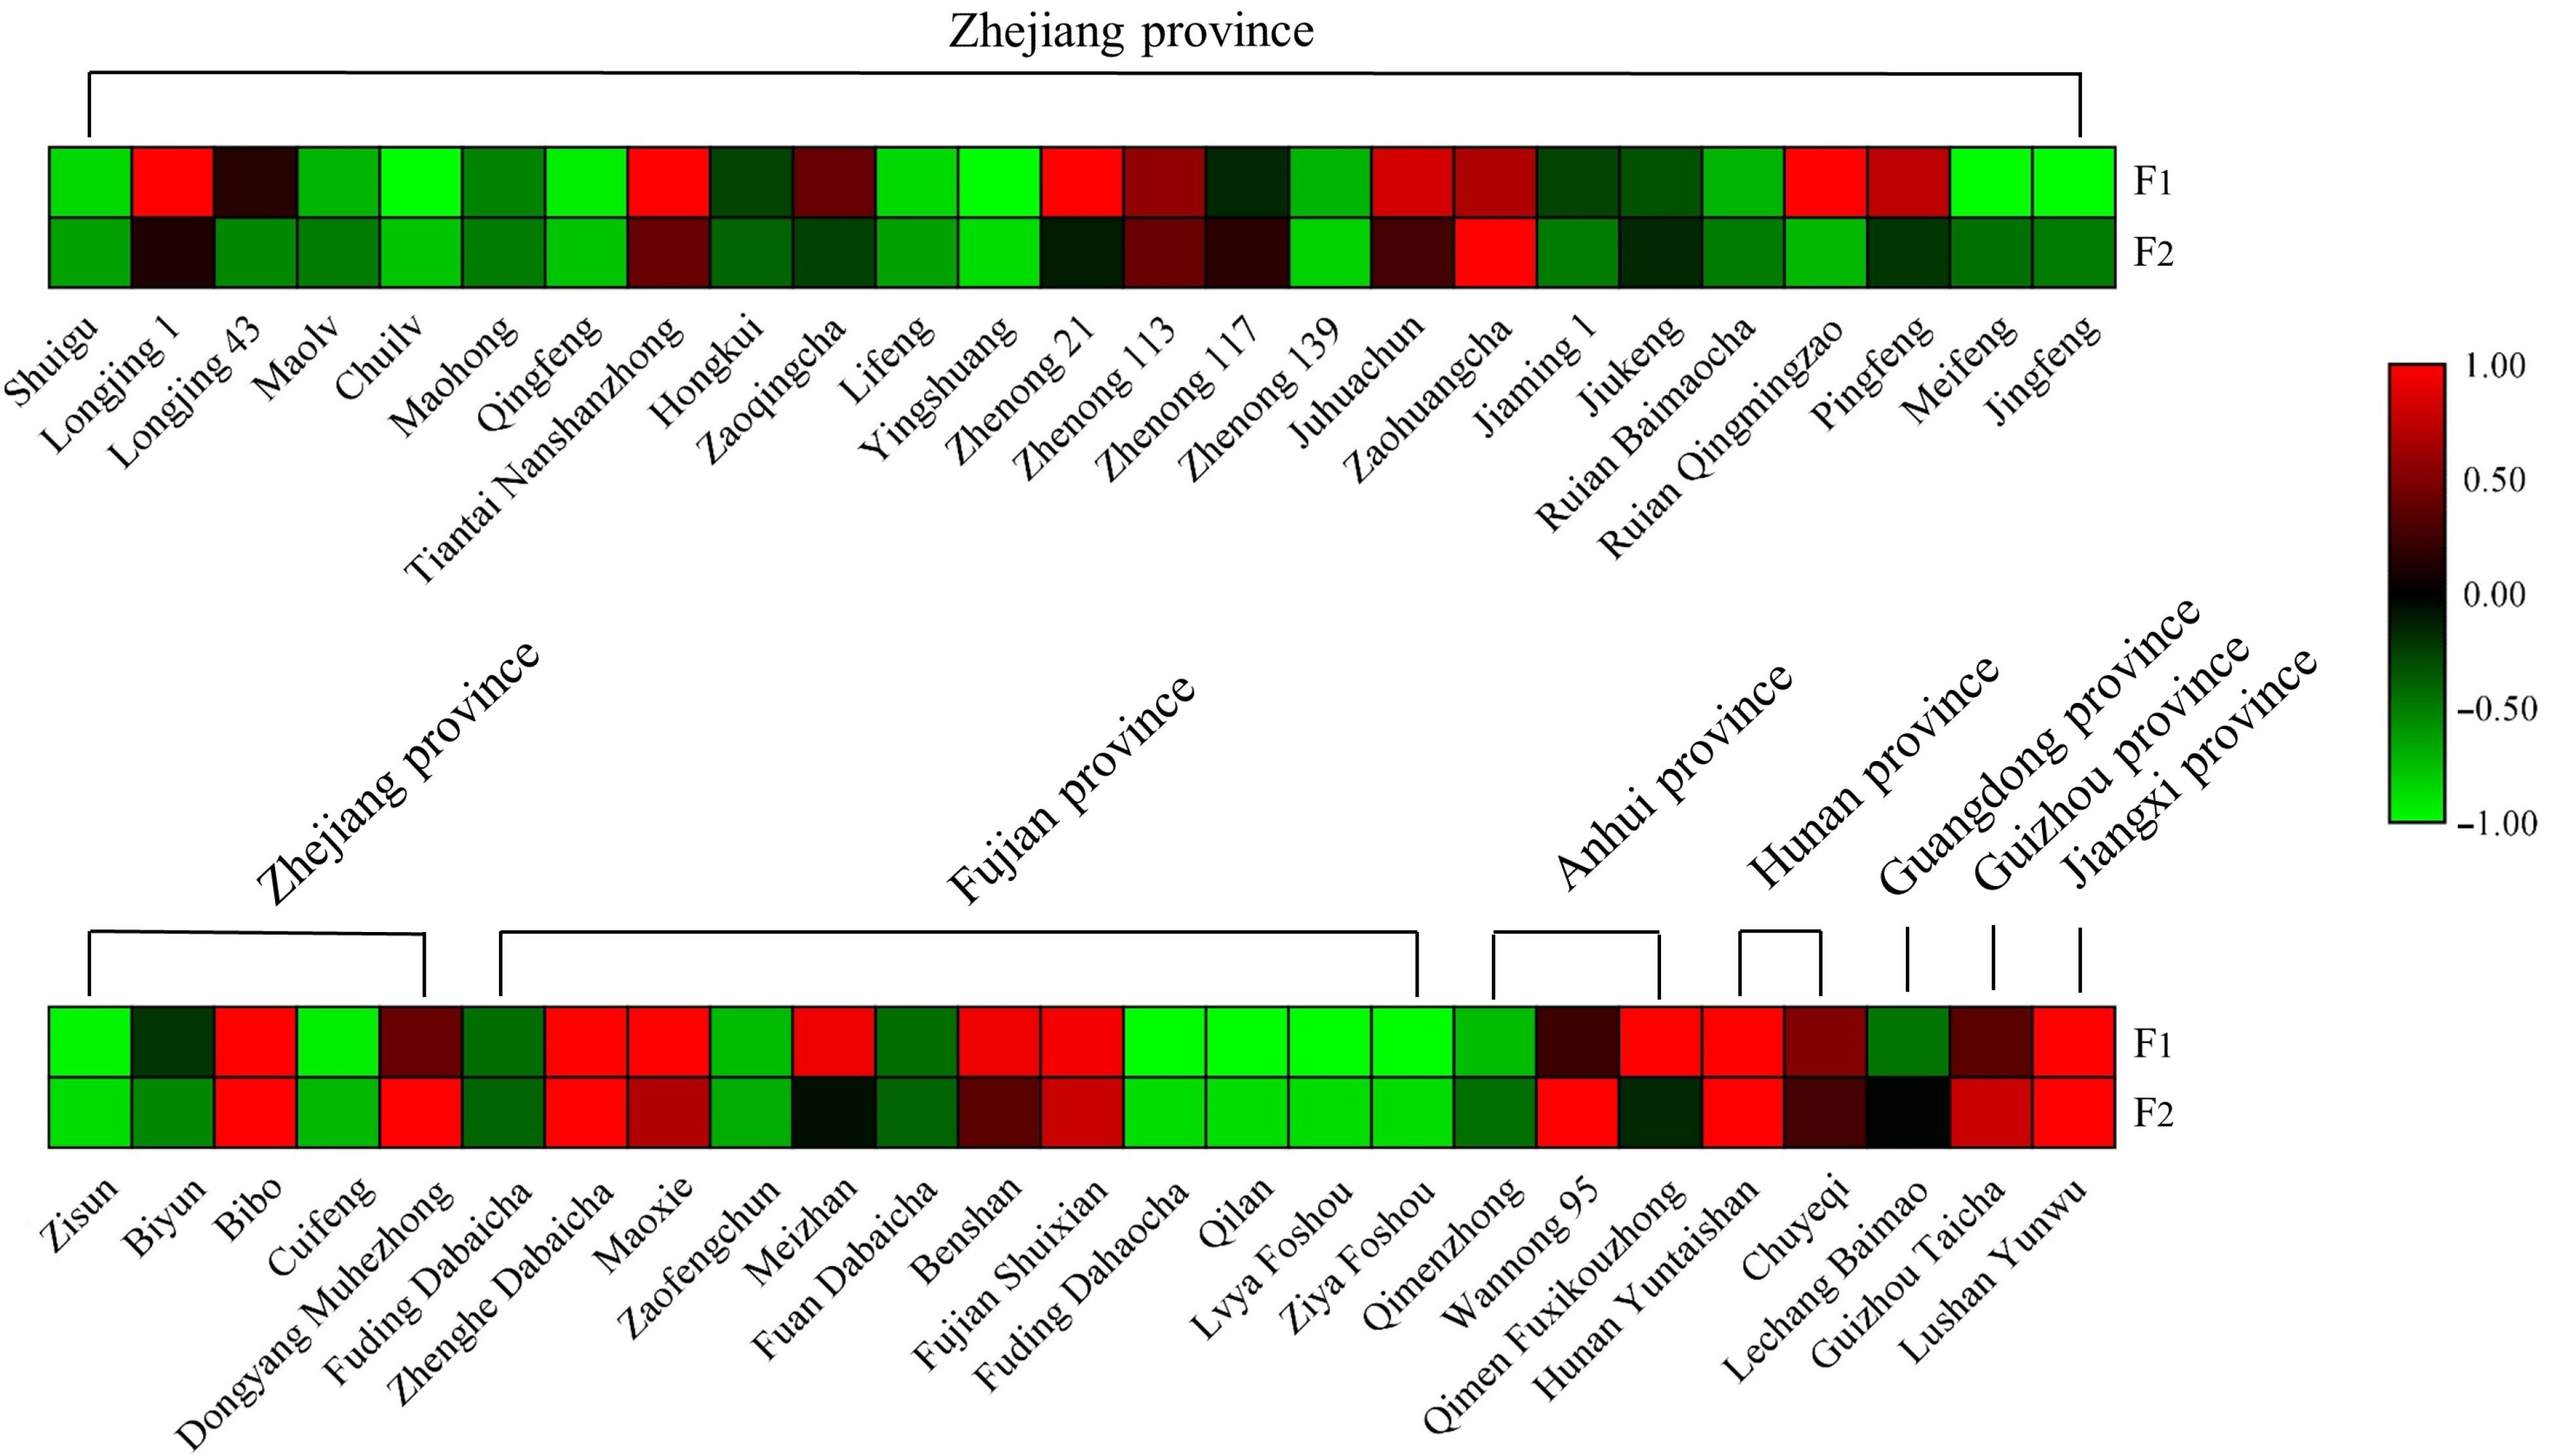
Figure 4.
Heat-map of the content of F1 and F2 in different tea cultivars.
-

Figure 5.
Effects of F1 and F2 and their aglycones on inhibition of biofilm formation by P. gingivalis (a) and F. nucleatum (b). Control is the treatment without drugs, and the vertical axis is the inhibition rate of biofilm production (%), different letters (a, b, c) for the same compound indicate significant difference (p < 0.05).
-
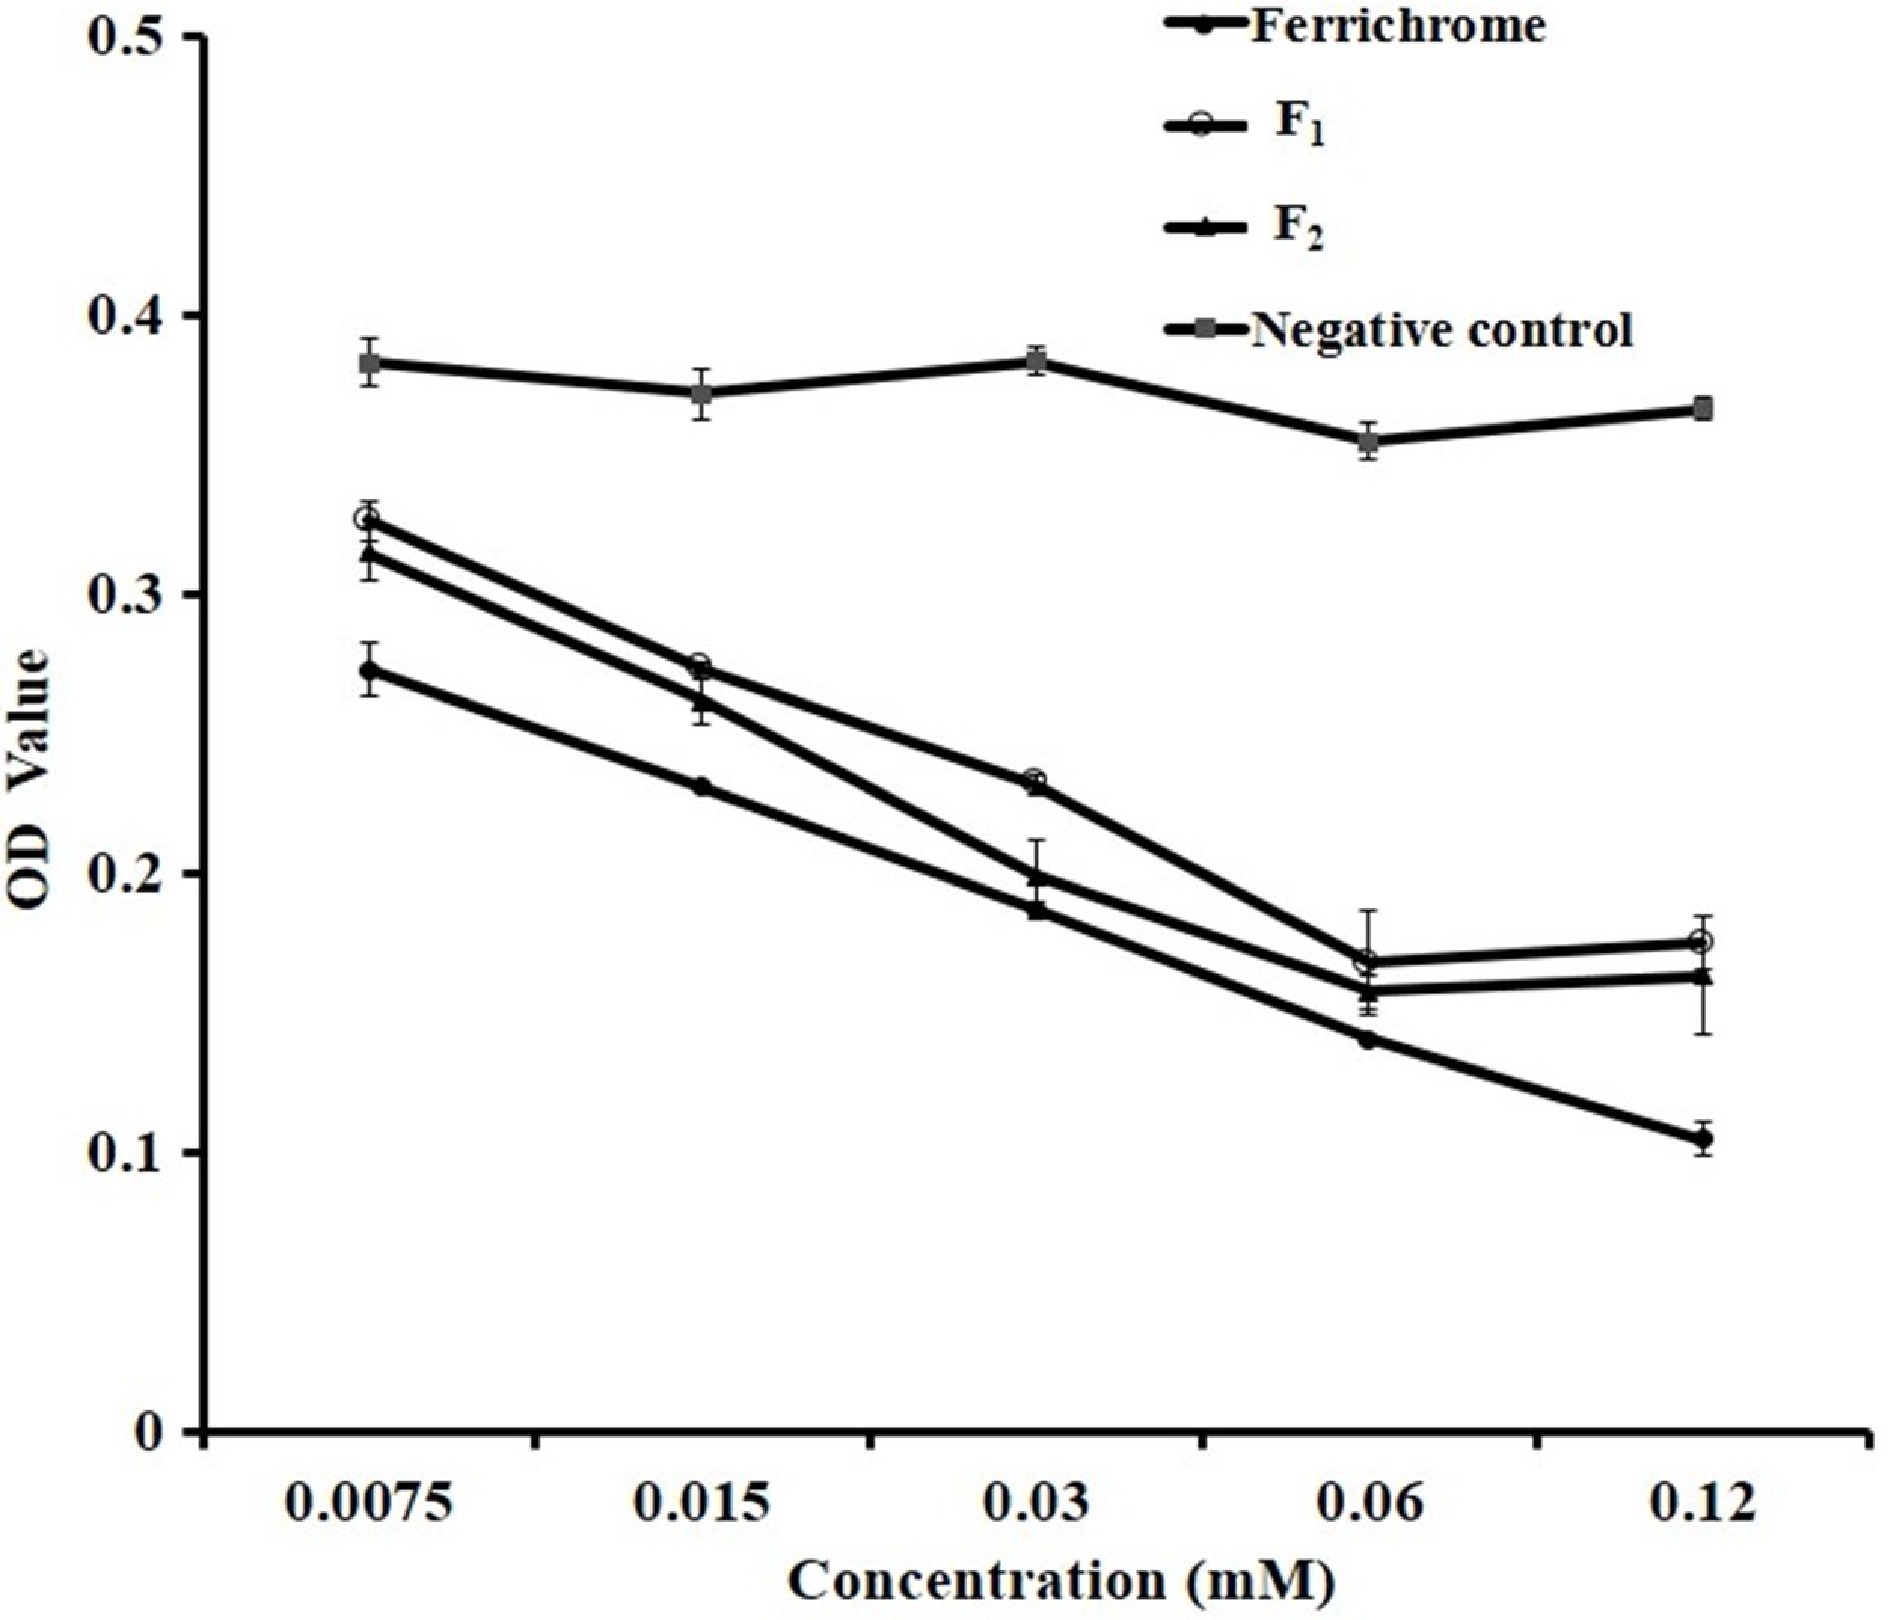
Figure 6.
Iron chelation activity of F1 and F2.
Figures
(6)
Tables
(0)