-
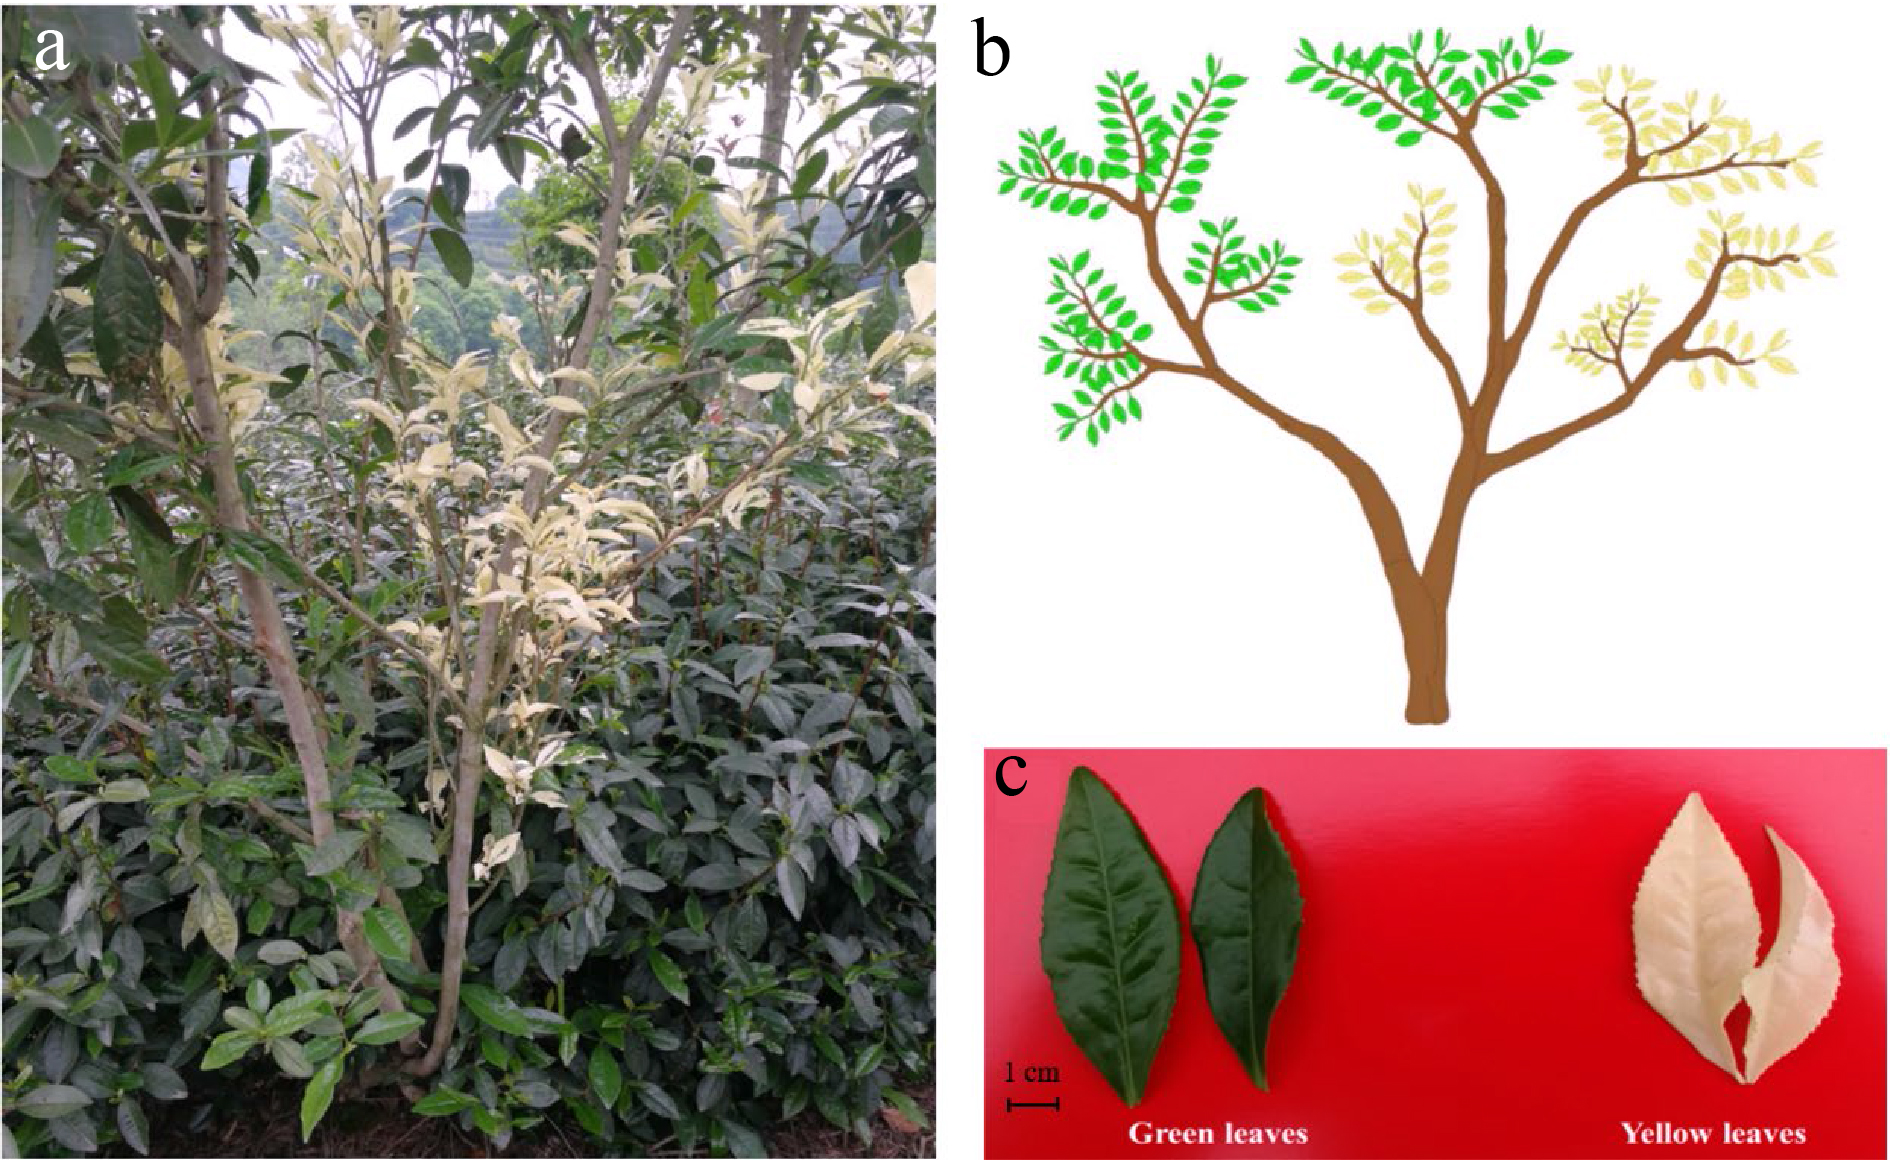
Figure 1. The phenotype of 'Haishun 2' tea mutant. (a) The original 'Haishun 2' tea plant; (b) Diagram of the 'Haishun 2' tea plant; (c) The green and yellow tea samples of 'Haishun 2' tea plant.
-
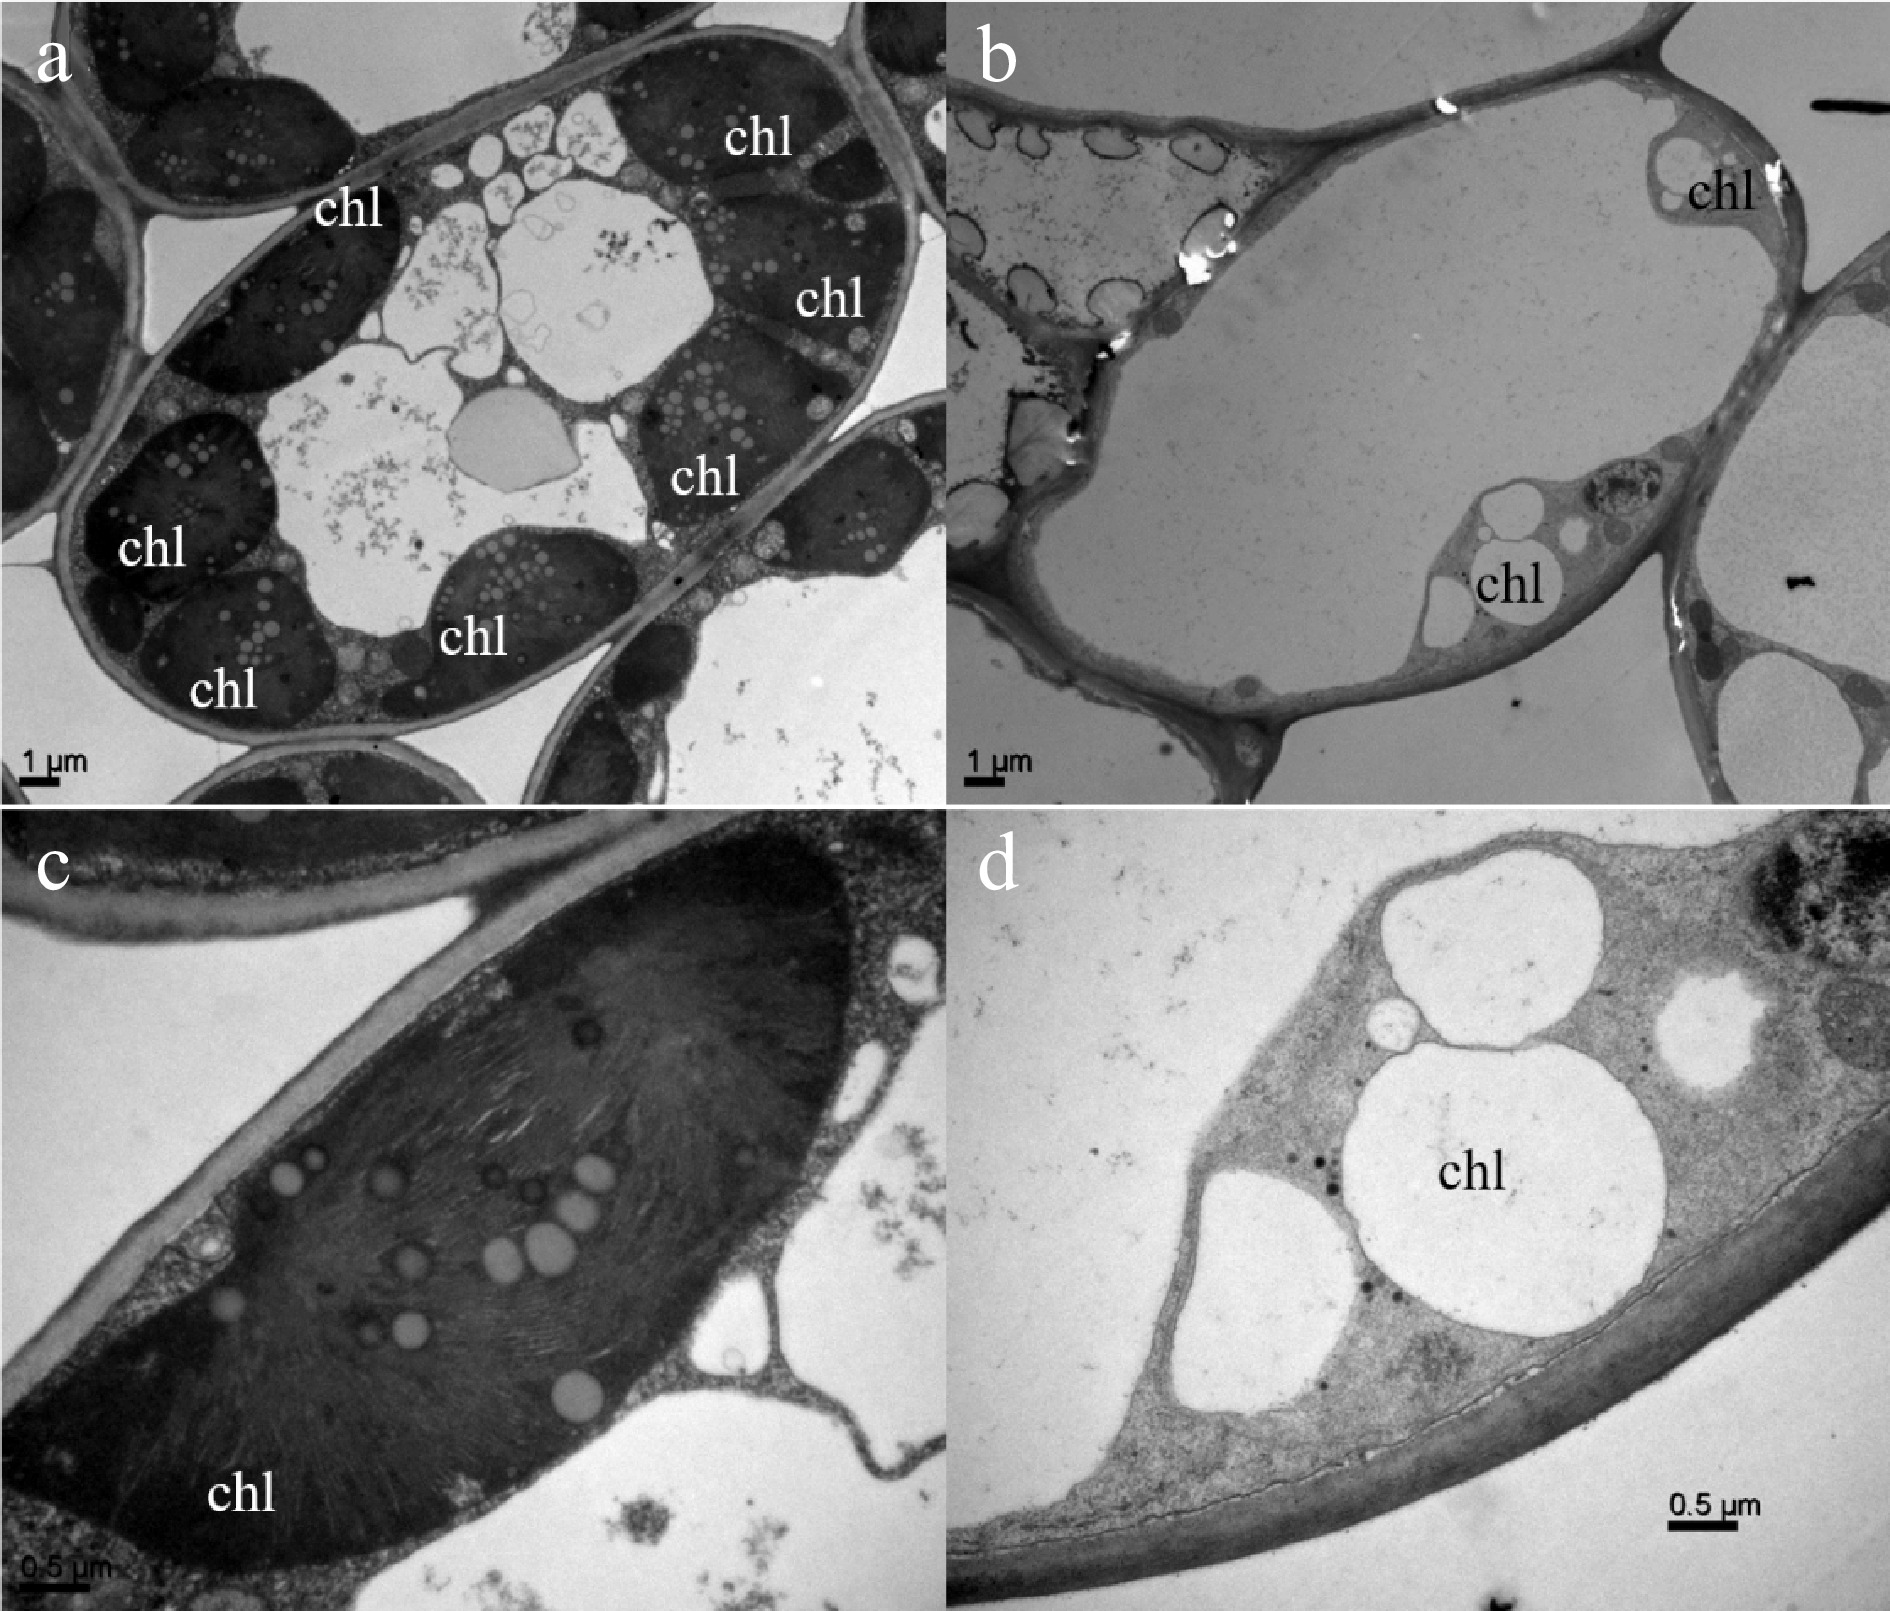
Figure 2. Comparison of subcellular structures of green and yellow leaves of 'Haishun 2' tea mutant.
-
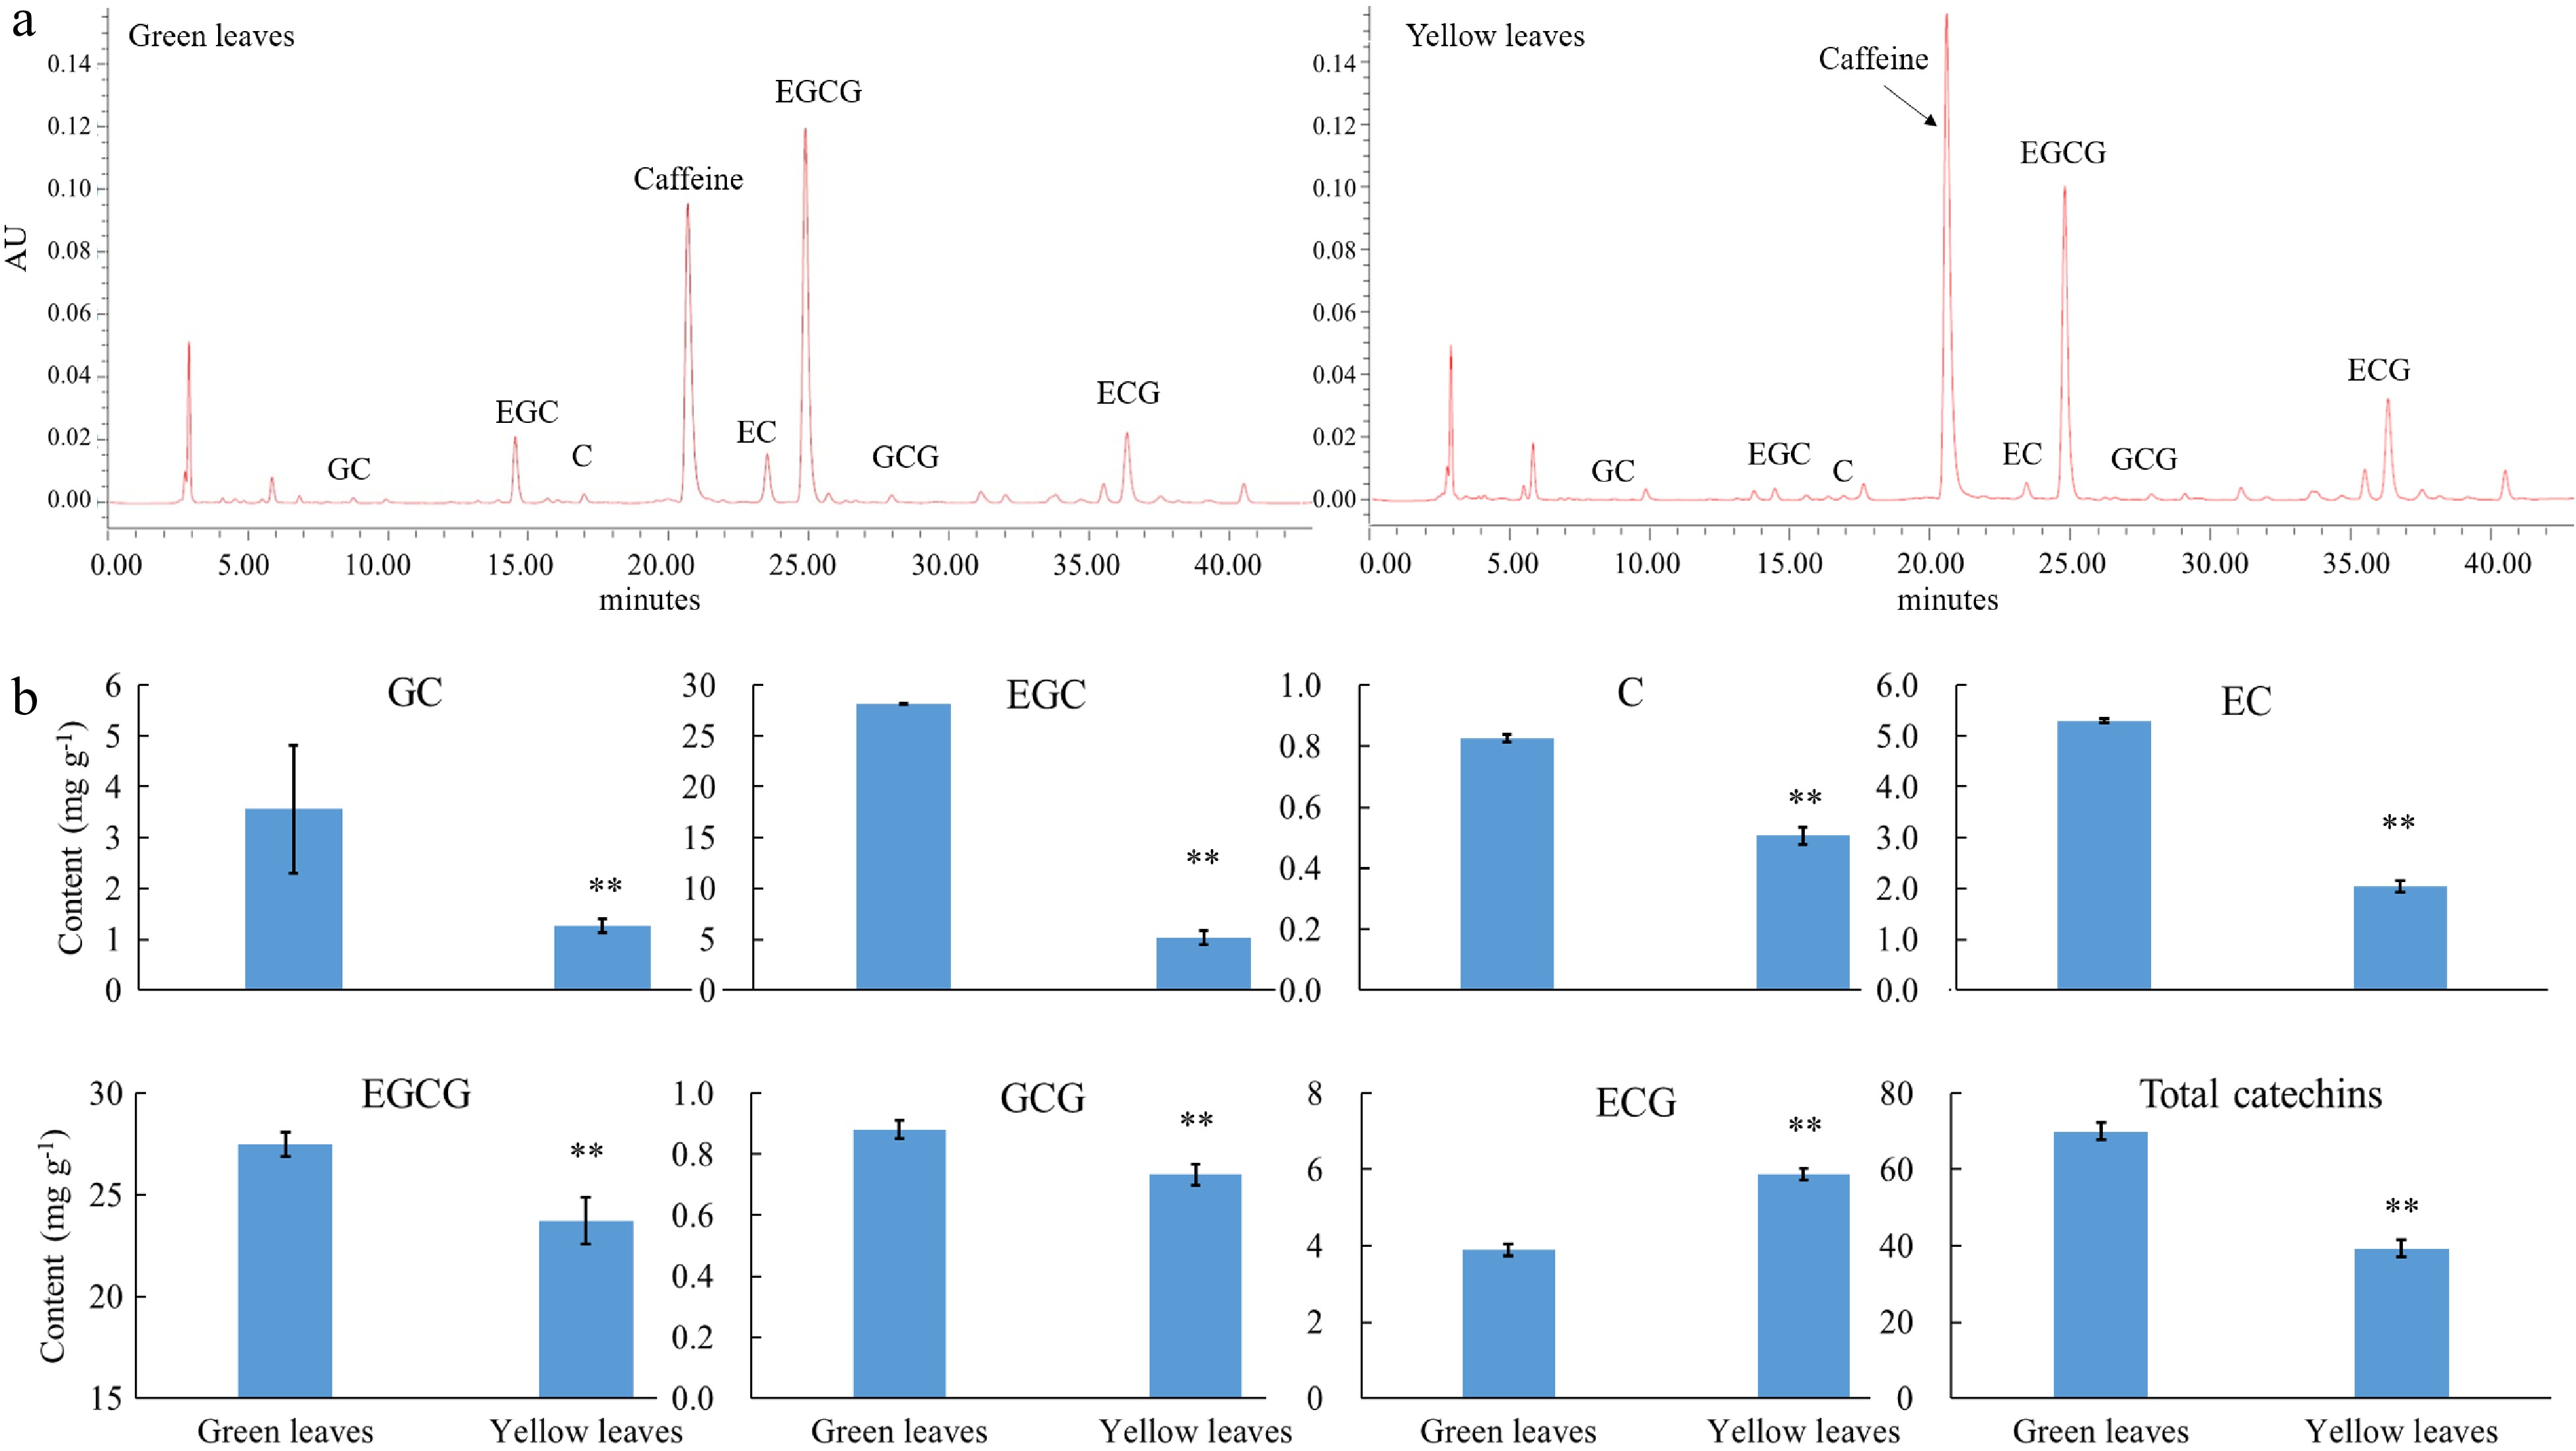
Figure 3. Catechin content in green and yellow leaves of 'Haishun 2'. (a) Chromatogram of the catechin component in green and yellow leaves of 'Haishun 2'. (b) The changes of catechin components and total catechins in green and yellow leaves of 'Haishun 2'.
-
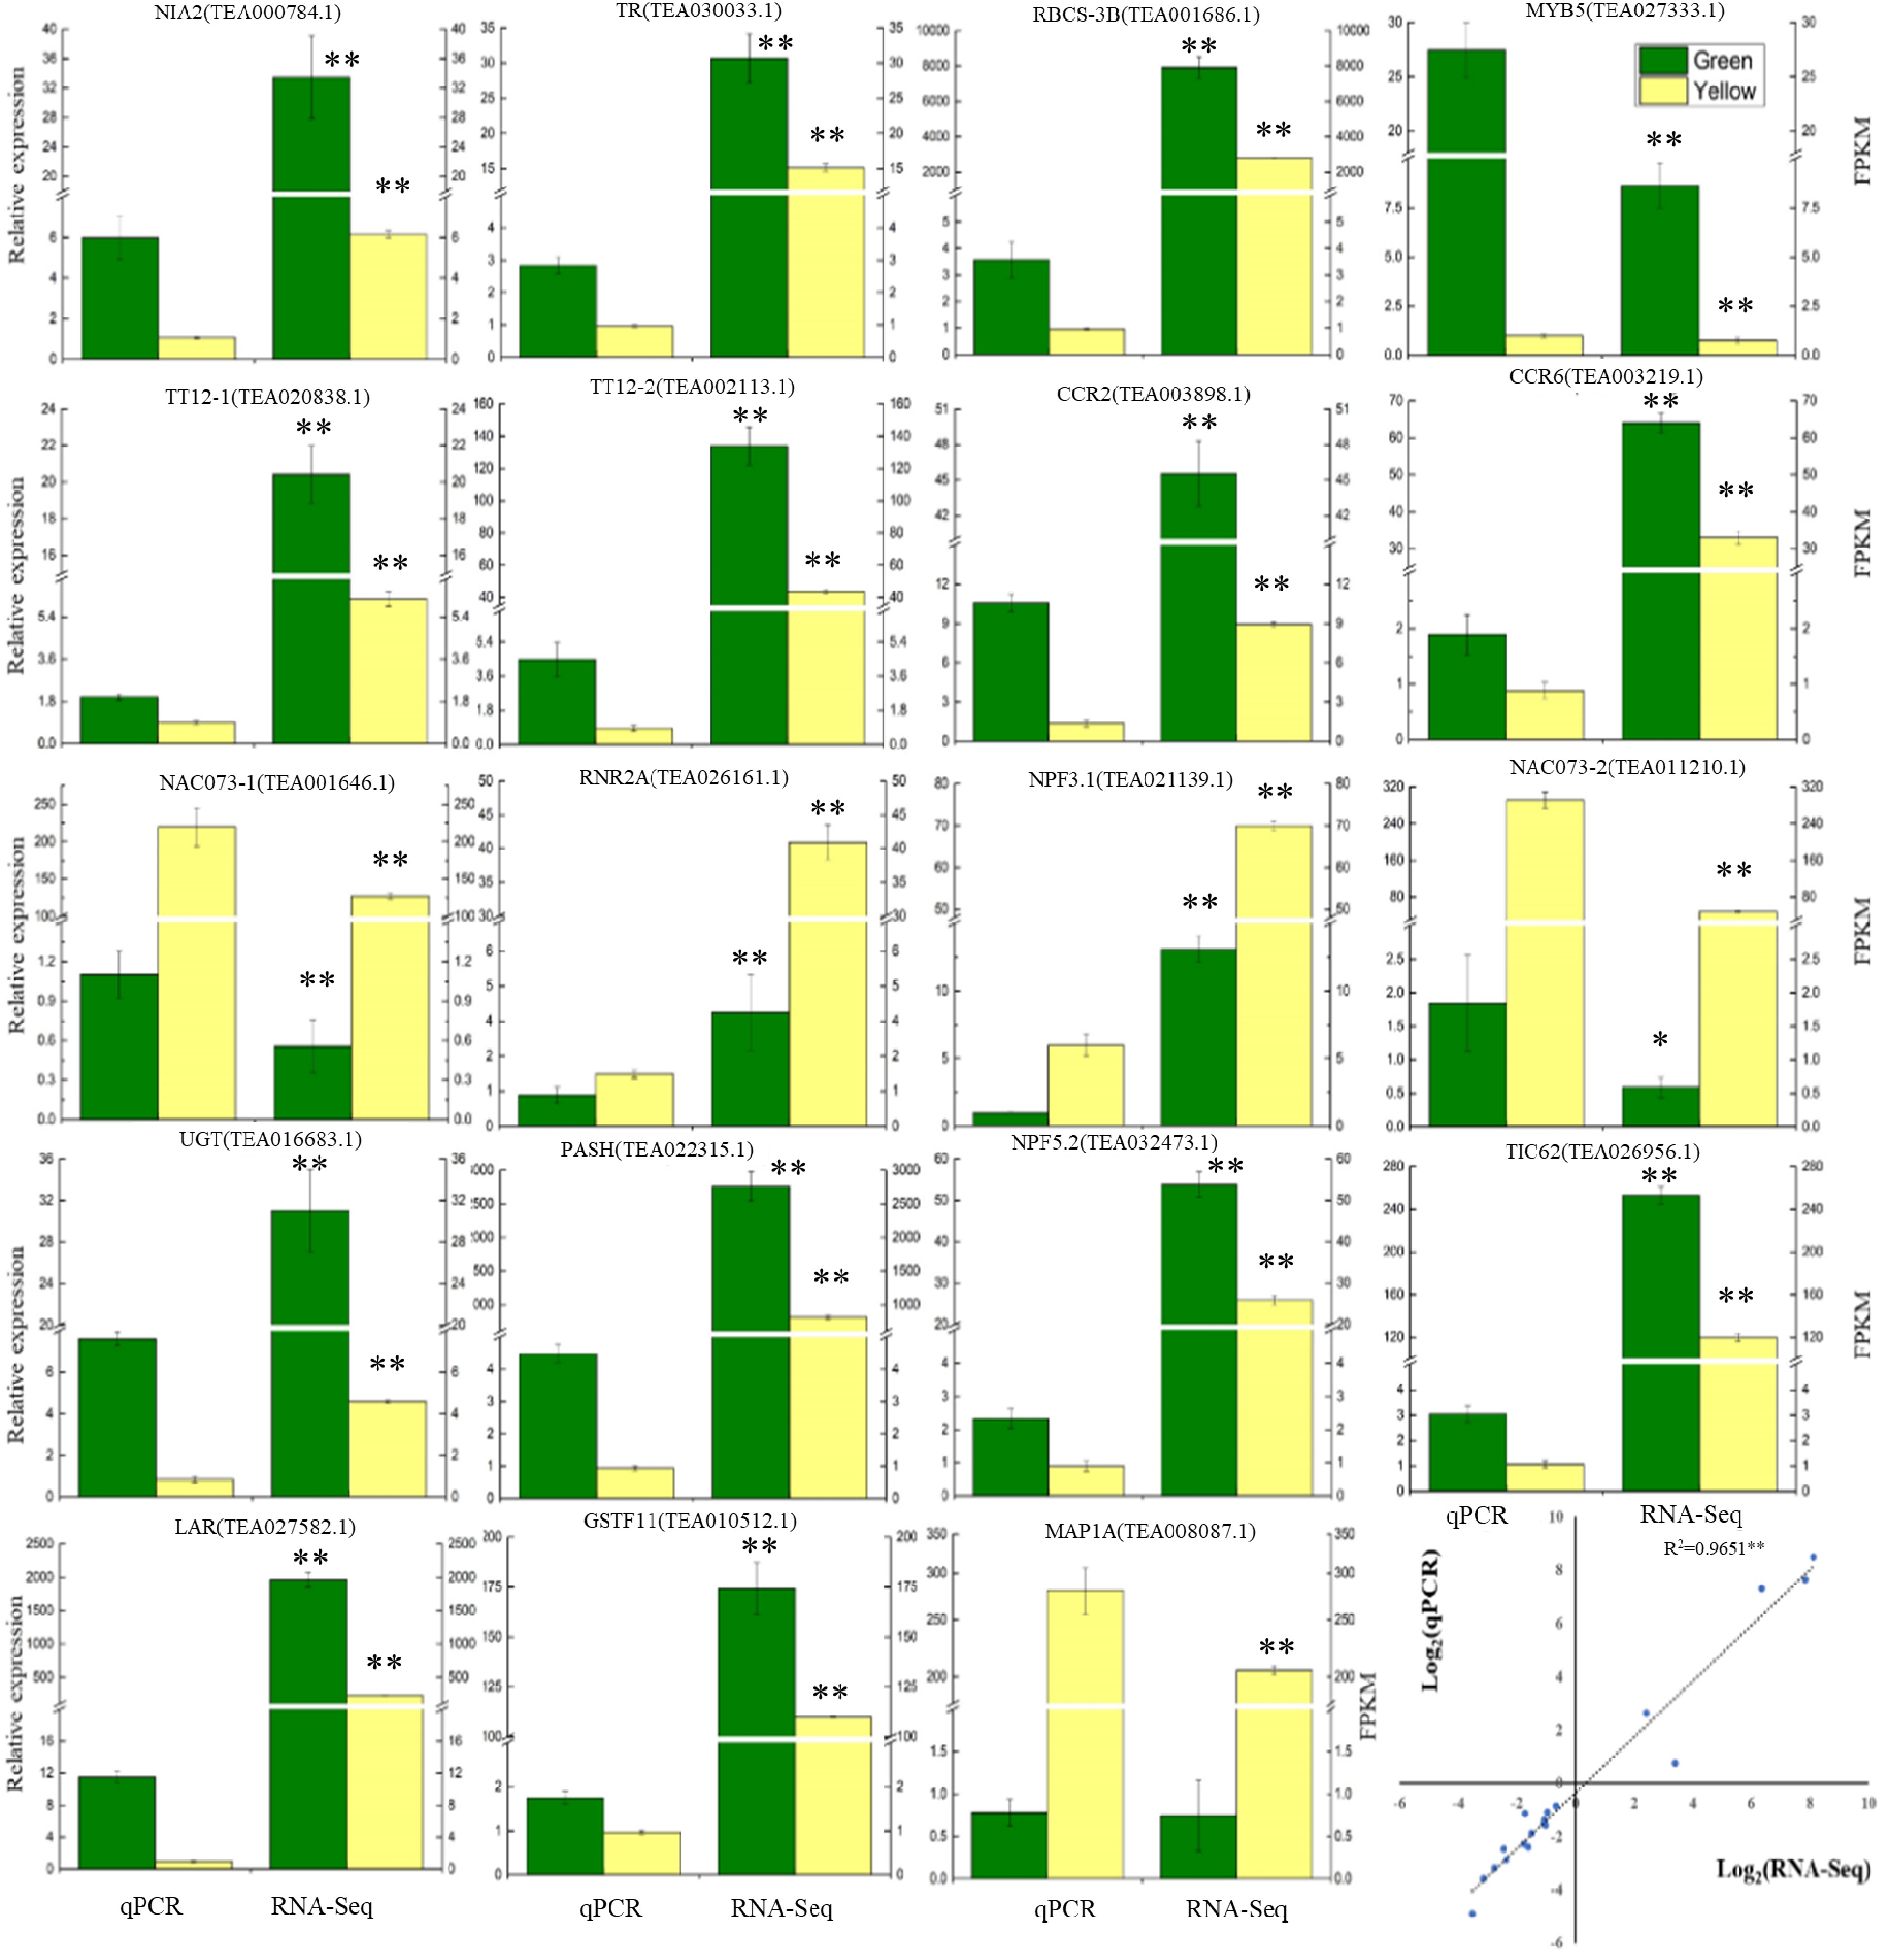
Figure 4. Verification of the gene expressions determined by RT-qPCR and RNA-Seq analysis. Data are shown as the means ± SD (n = 3).
-
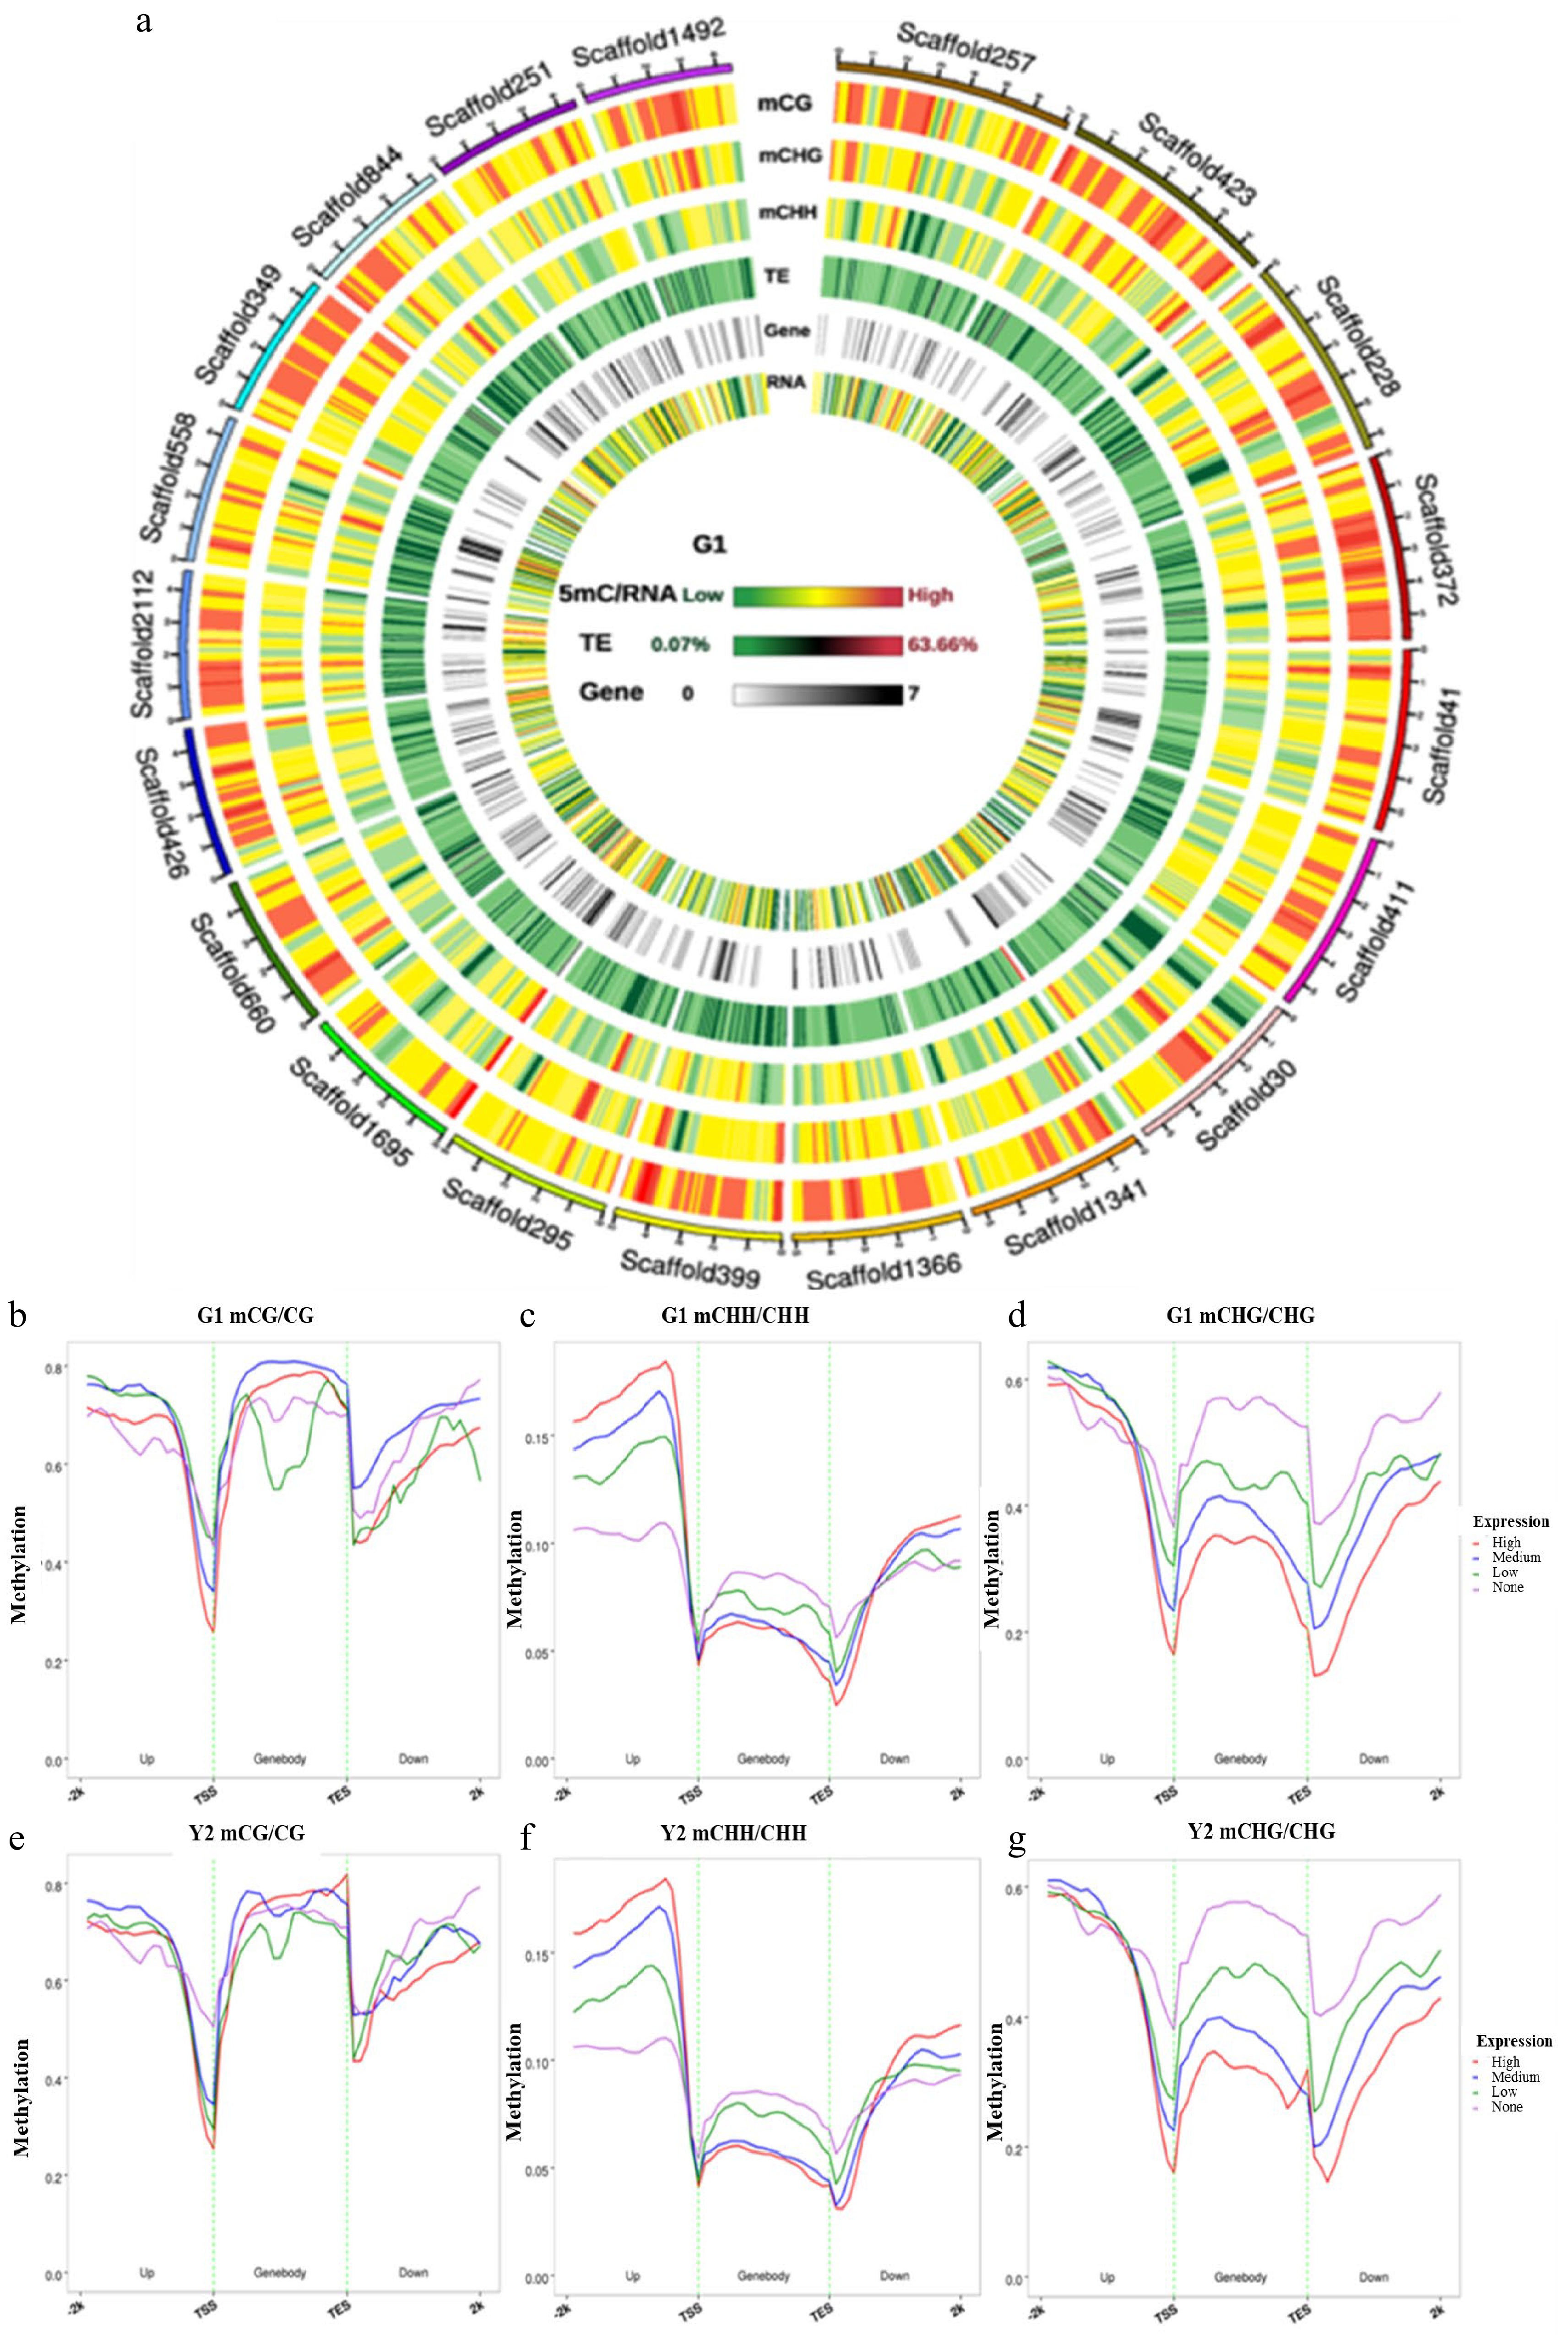
Figure 5. Circos plots of scaffolds in tea genome and the association between DNA methylation and gene expression. (a) Circos plots of scaffolds in tea genome. Track order: density plot of 5mC in CpG, CHG and CHH contexts; density of transposable elements (TEs); gene density of each scaffold. (b−g) Distributions of methylation levels within gene bodies partitioned by different expression levels: 1st_quintile is the lowest and 4th_quintile is the highest; genes with FPKM value < 0.1 were considered non-expressed (none). (b−d) The association between CpG, CHG and CHH methylation and gene expression in green leaves; (e−g) The association between CpG, CHG and CHH methylation and gene expression in yellow leaves; Genes were divided into four groups according to their expression levels. Association between gene expression and DNA methylation in the CpG, CHG and CHH sequence contexts. Genes with FPKM value groups by their gene expression levels. This means that the first group of genes contained the highest expressed genes. Each upstream 2 kb, gene body, and downstream 2 kb region was divided proportionally into 20 bins, and average methylation levels were estimated for each bin.
-
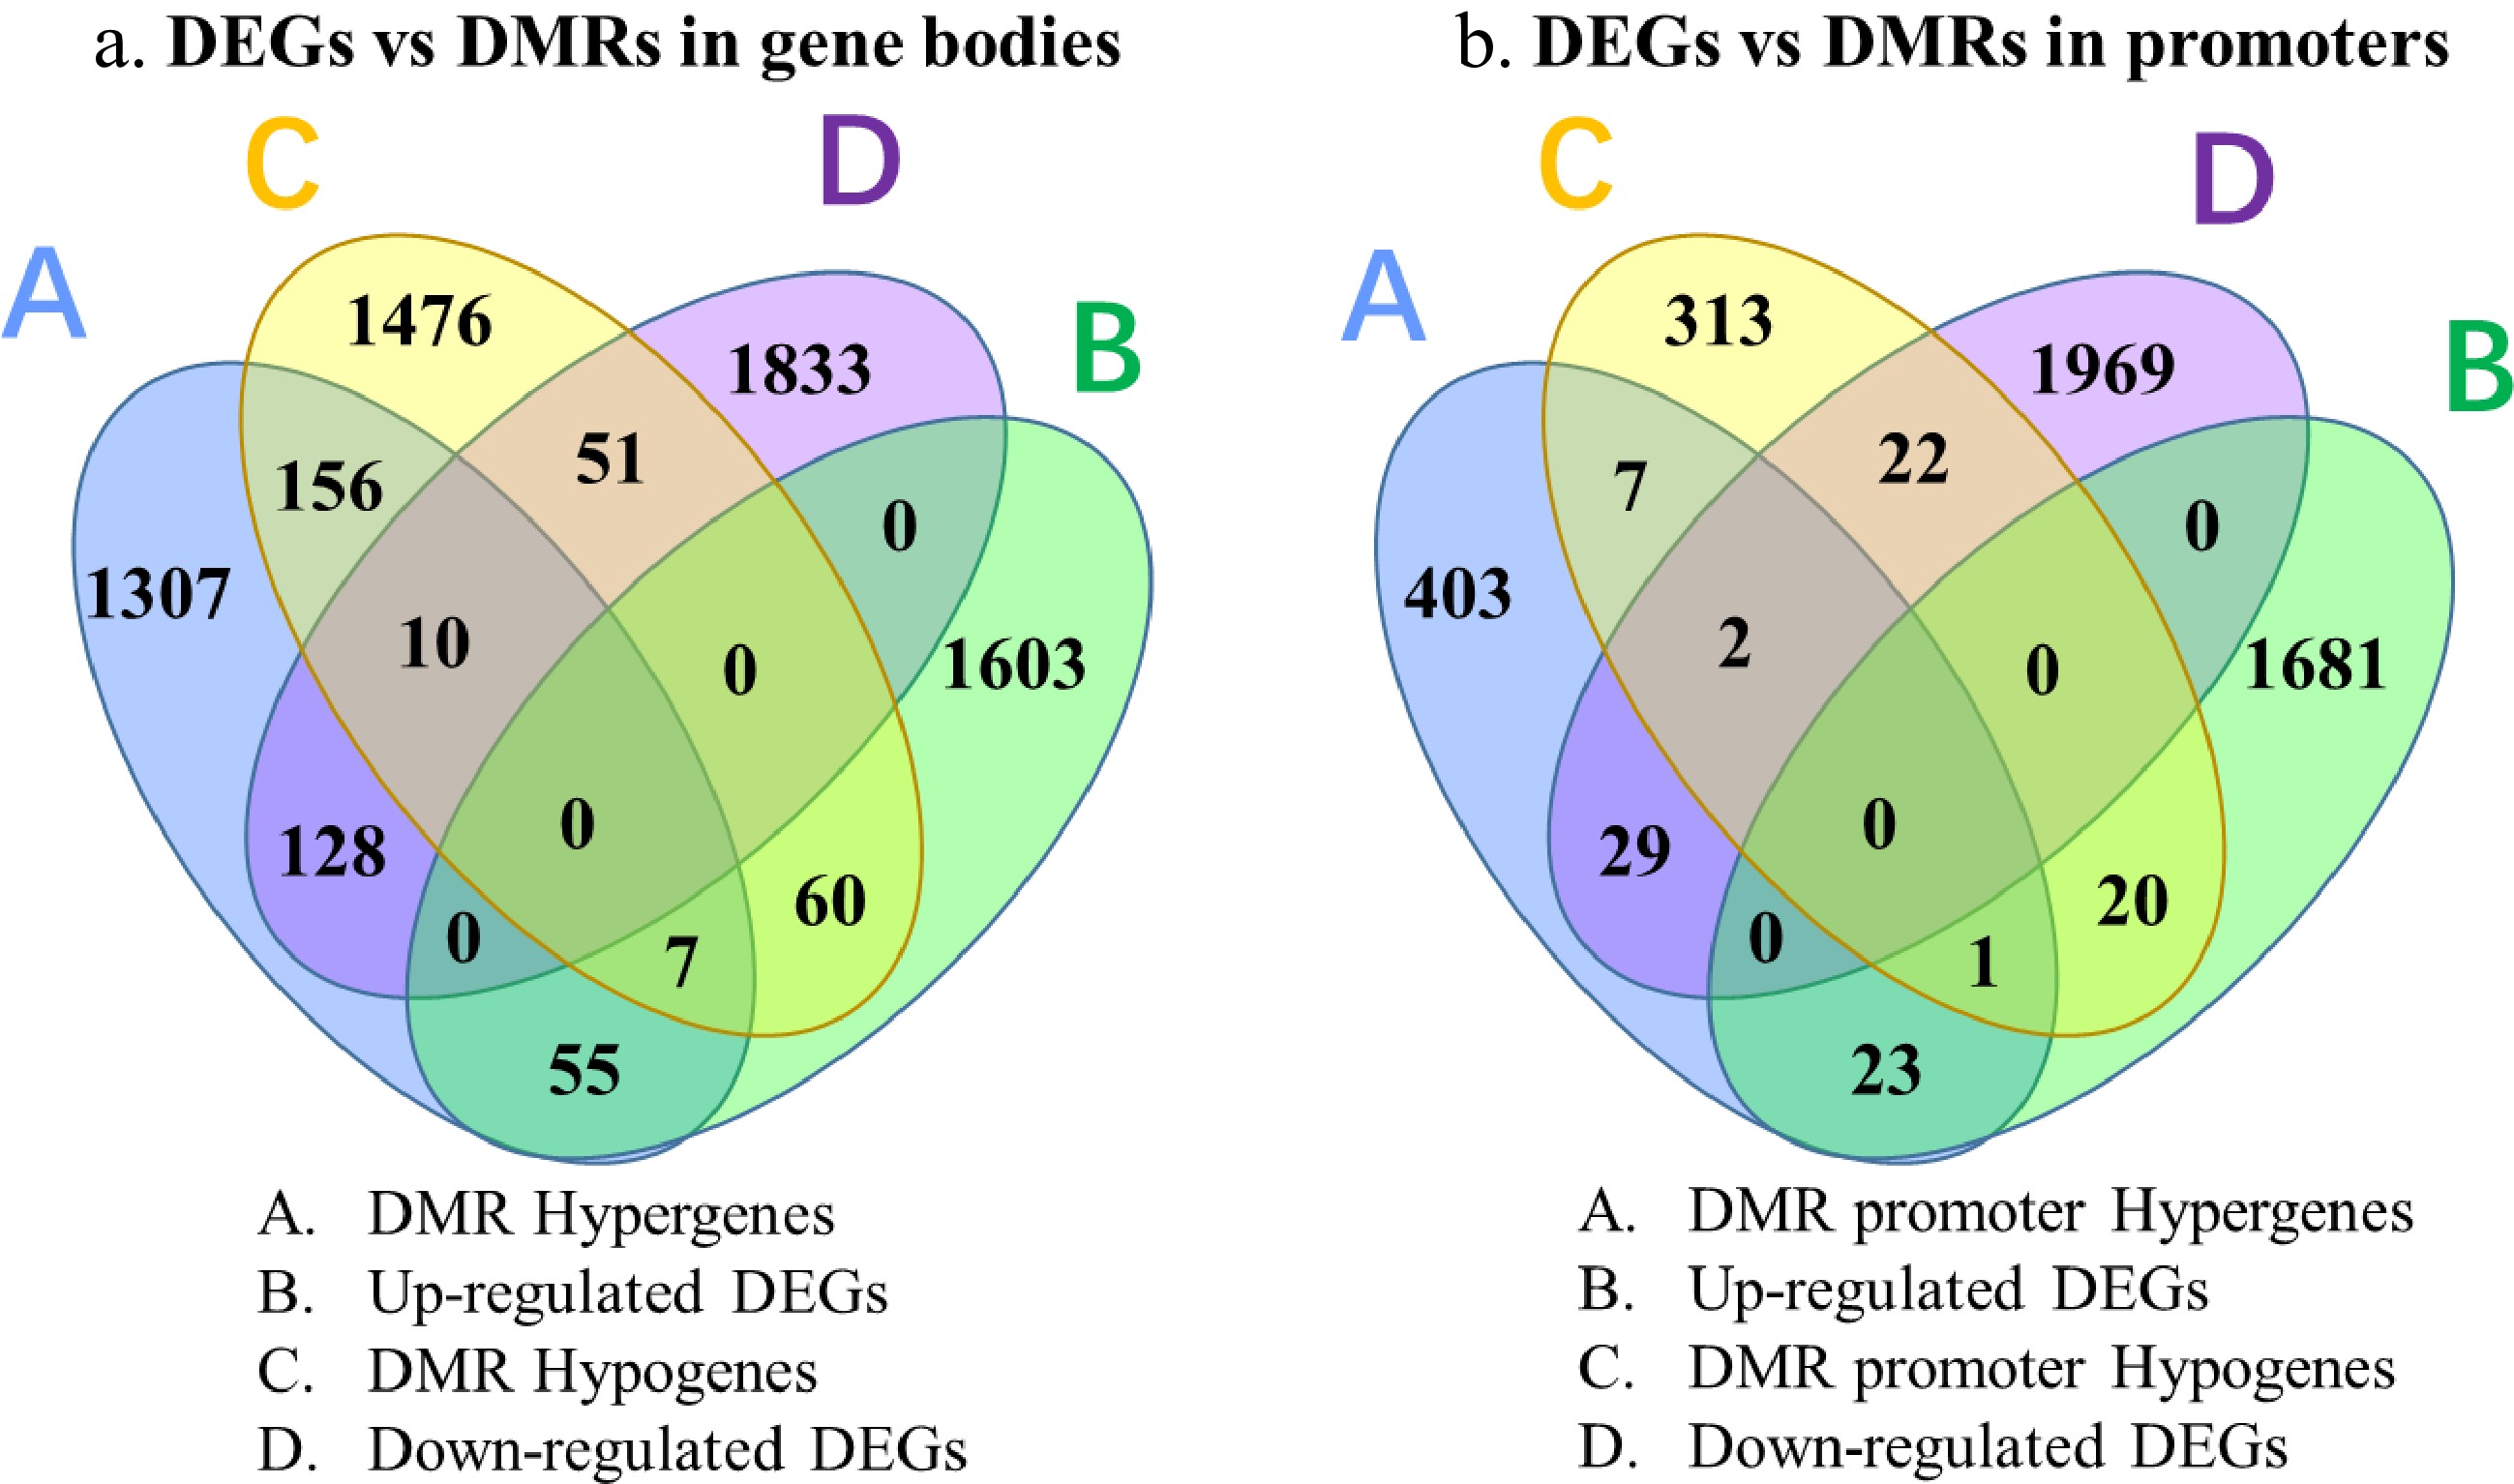
Figure 6. Venn diagrams of genes identified by RNA-Seq and BS-Seq analysis.
-
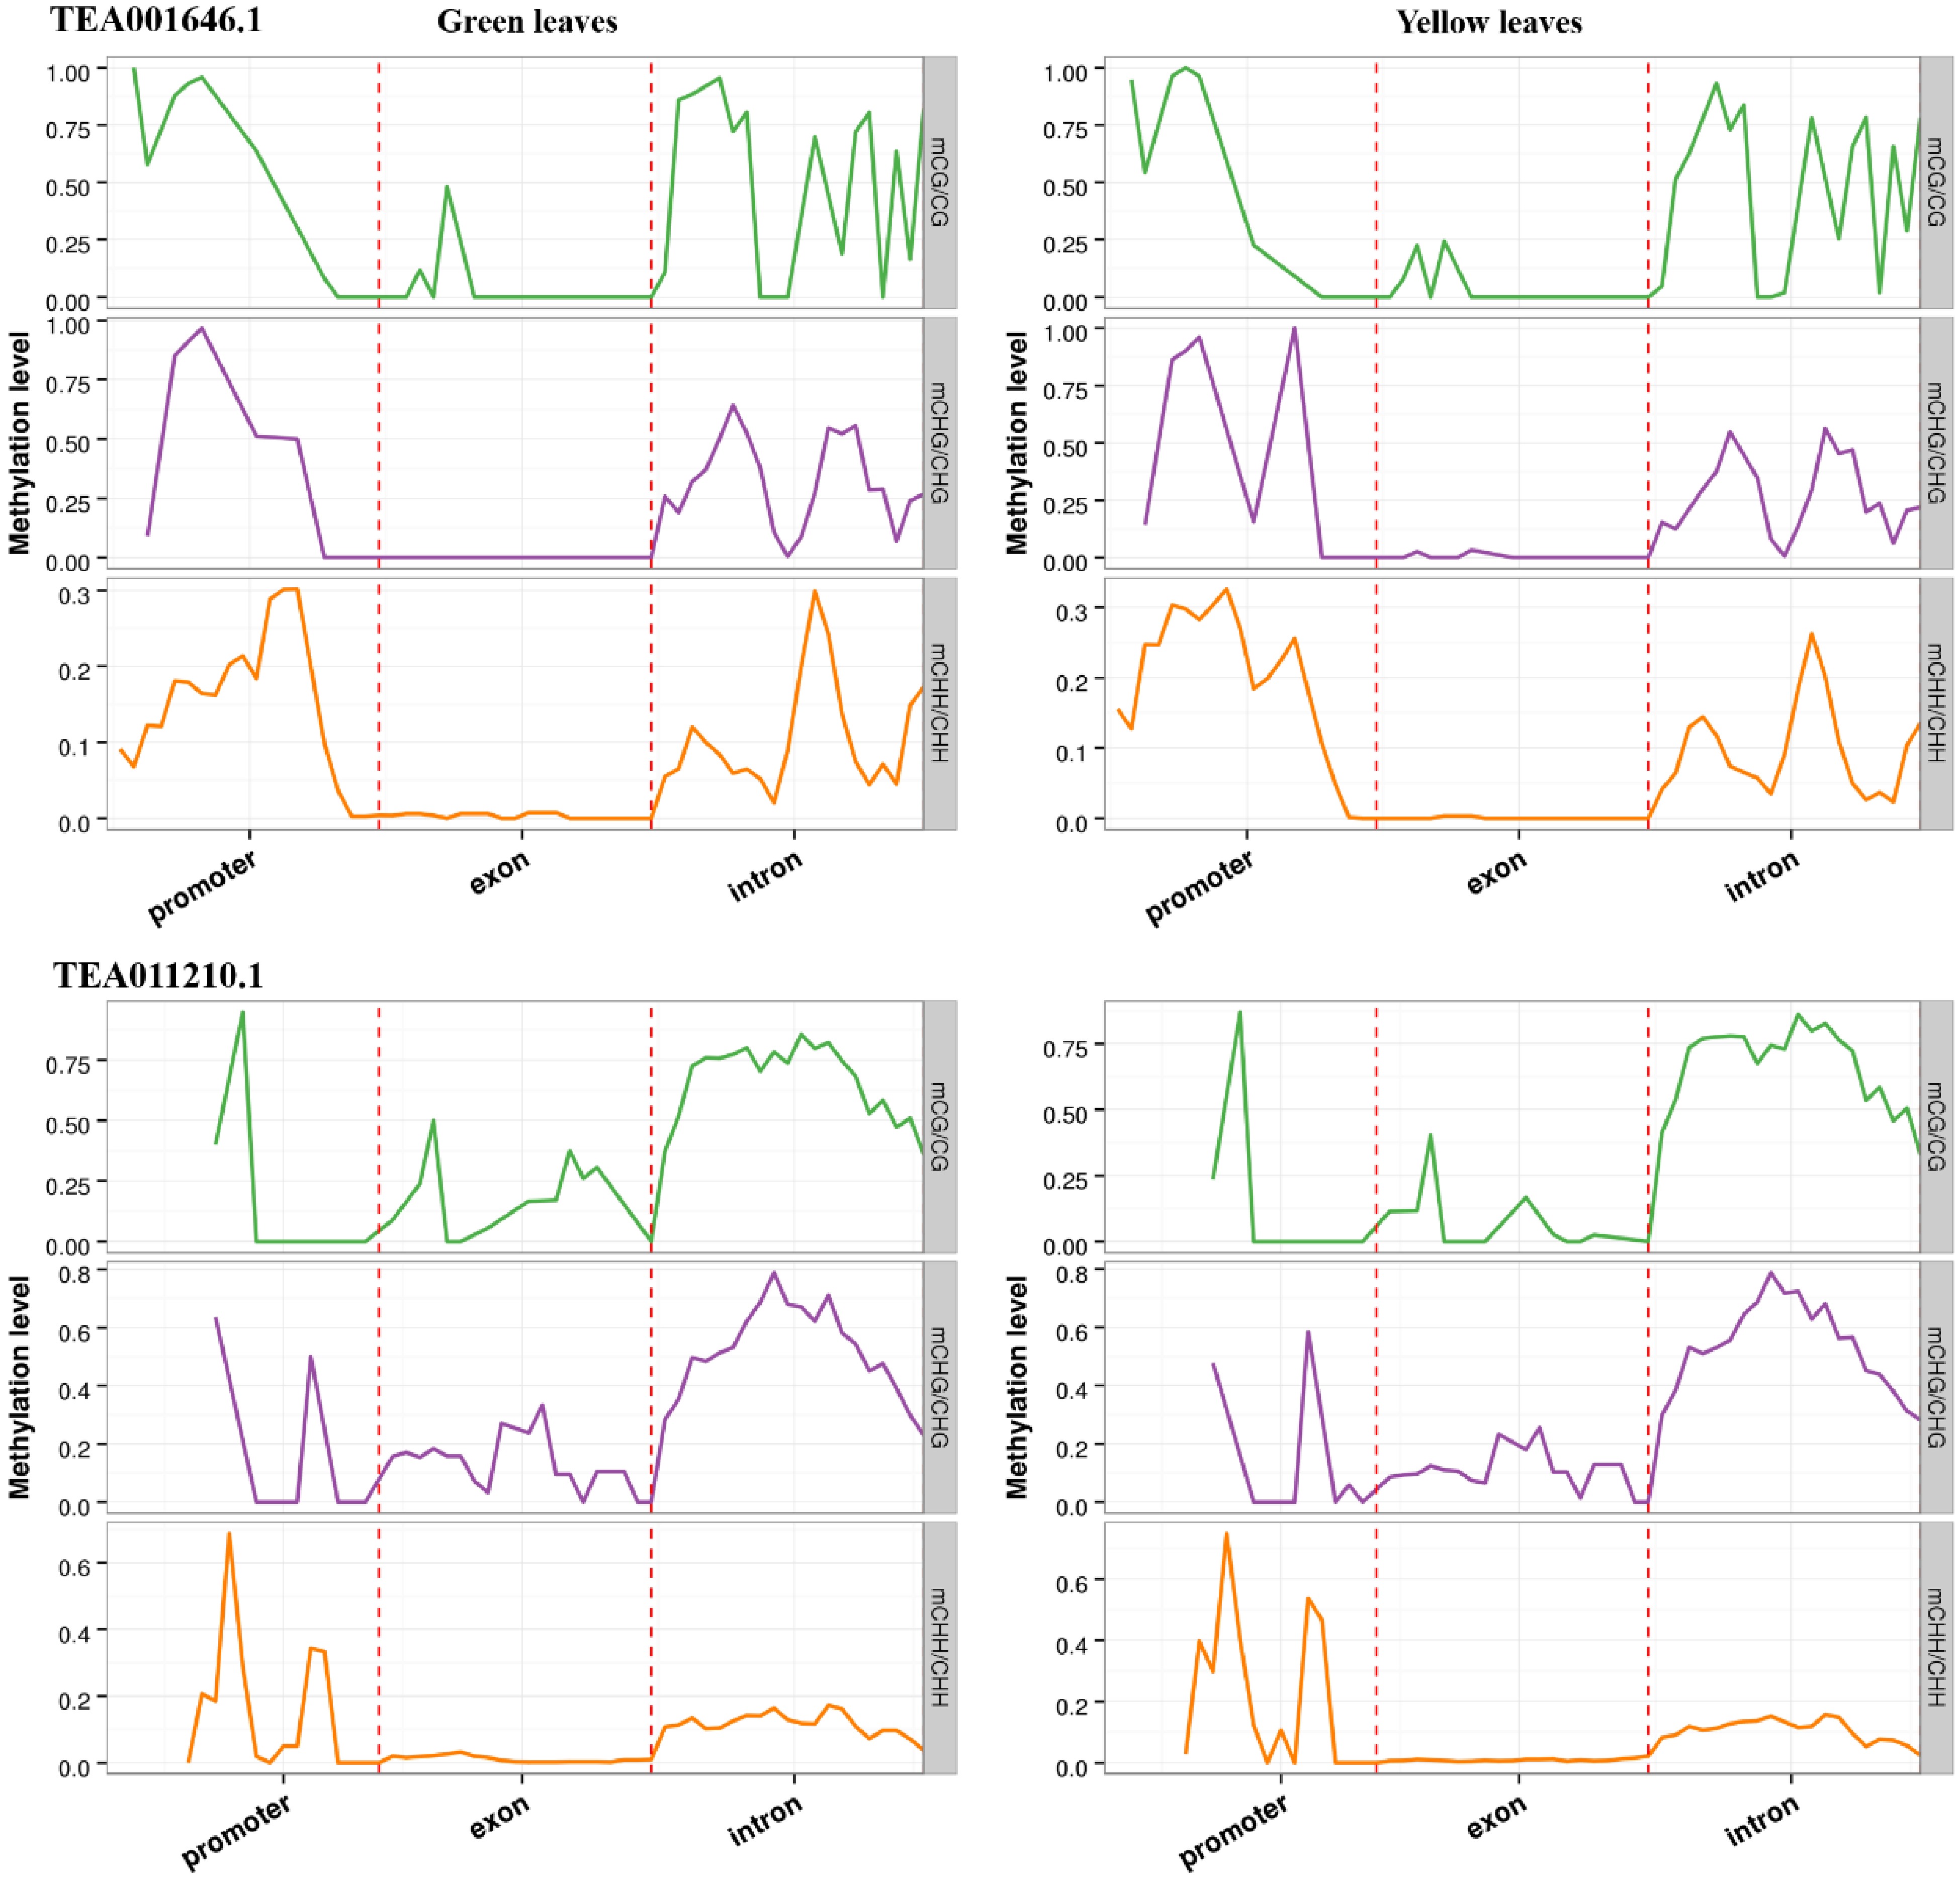
Figure 7. DNA methylation patterns of two NAC transcription factors (TEA001646.1 and TEA011210.1). In all cases, promoter indicates the upstream 2,000 bp of transcriptional start sites, exon and intron are the corresponding parts of gene bodies.
-
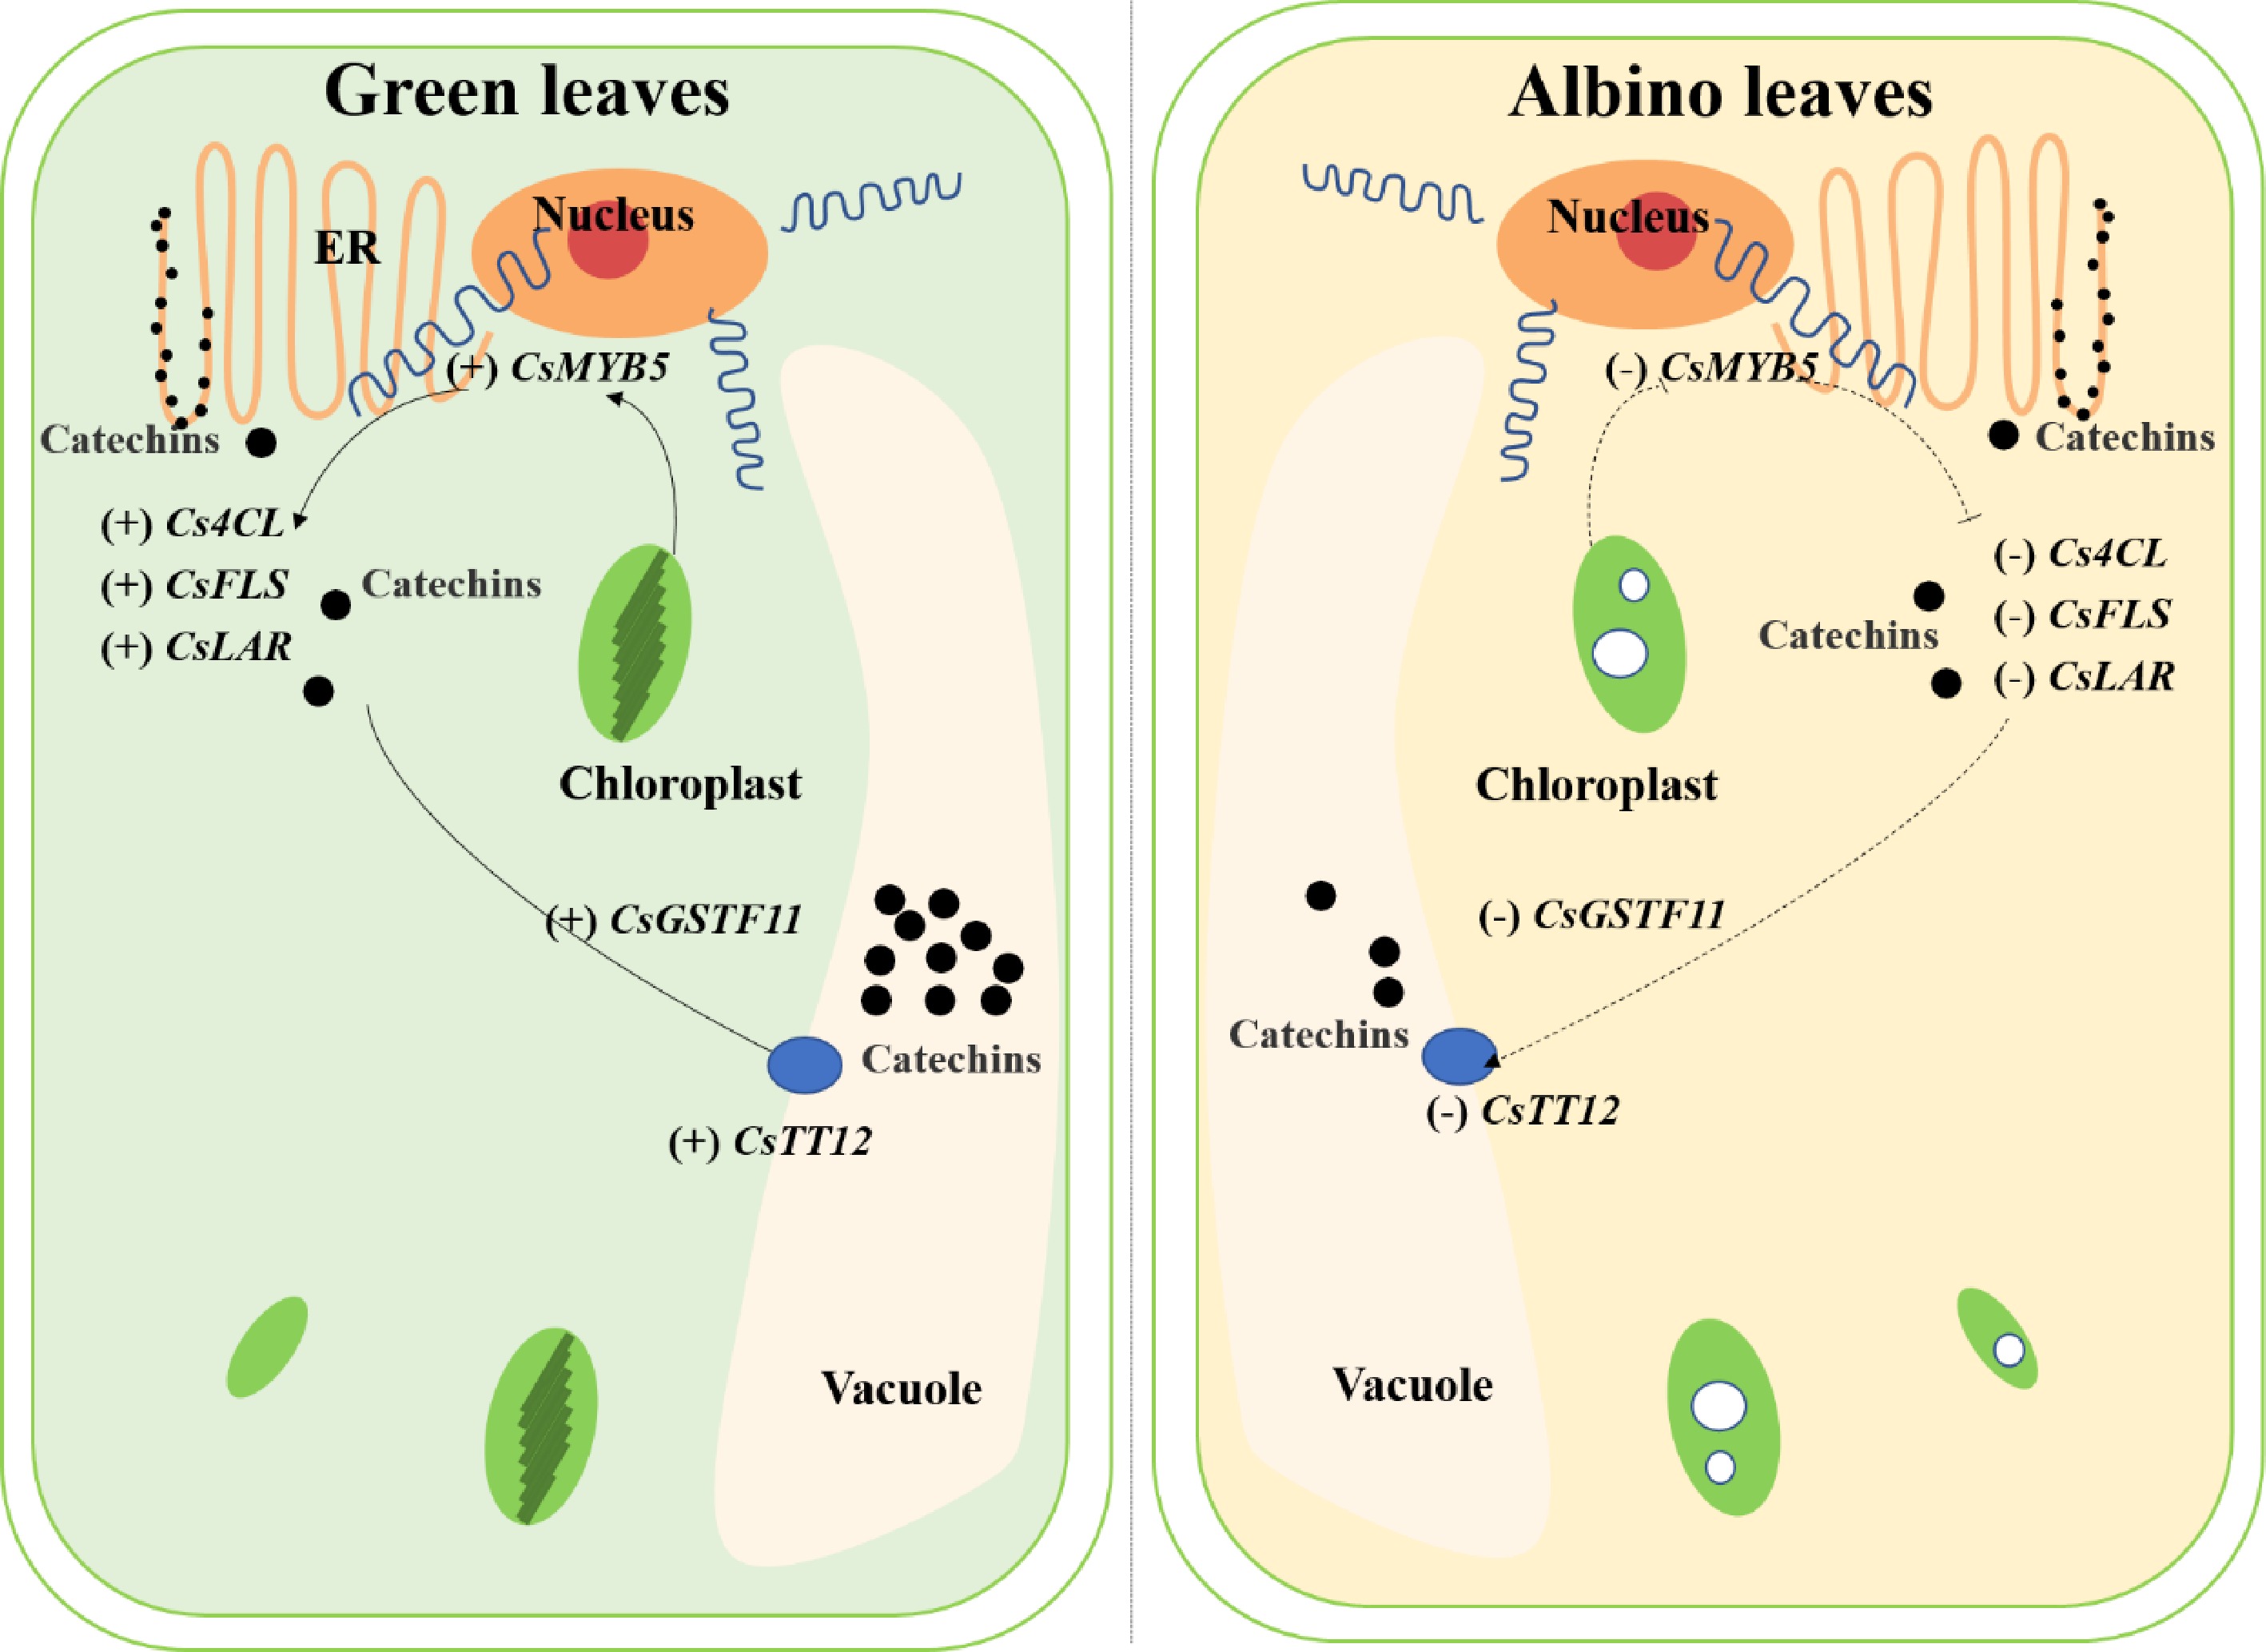
Figure 8. The potential mechanisms involved in catechin accumulation in green and albino leaves of 'Haishun 2'. 4CL, 4-coumaroyl CoA ligase; FLS, flavonol synthase; GST, glutathione S-transferase; LAR, leucoanthocyanidin reductase; TT12, transparent testa 12.
Figures
(8)
Tables
(0)