-
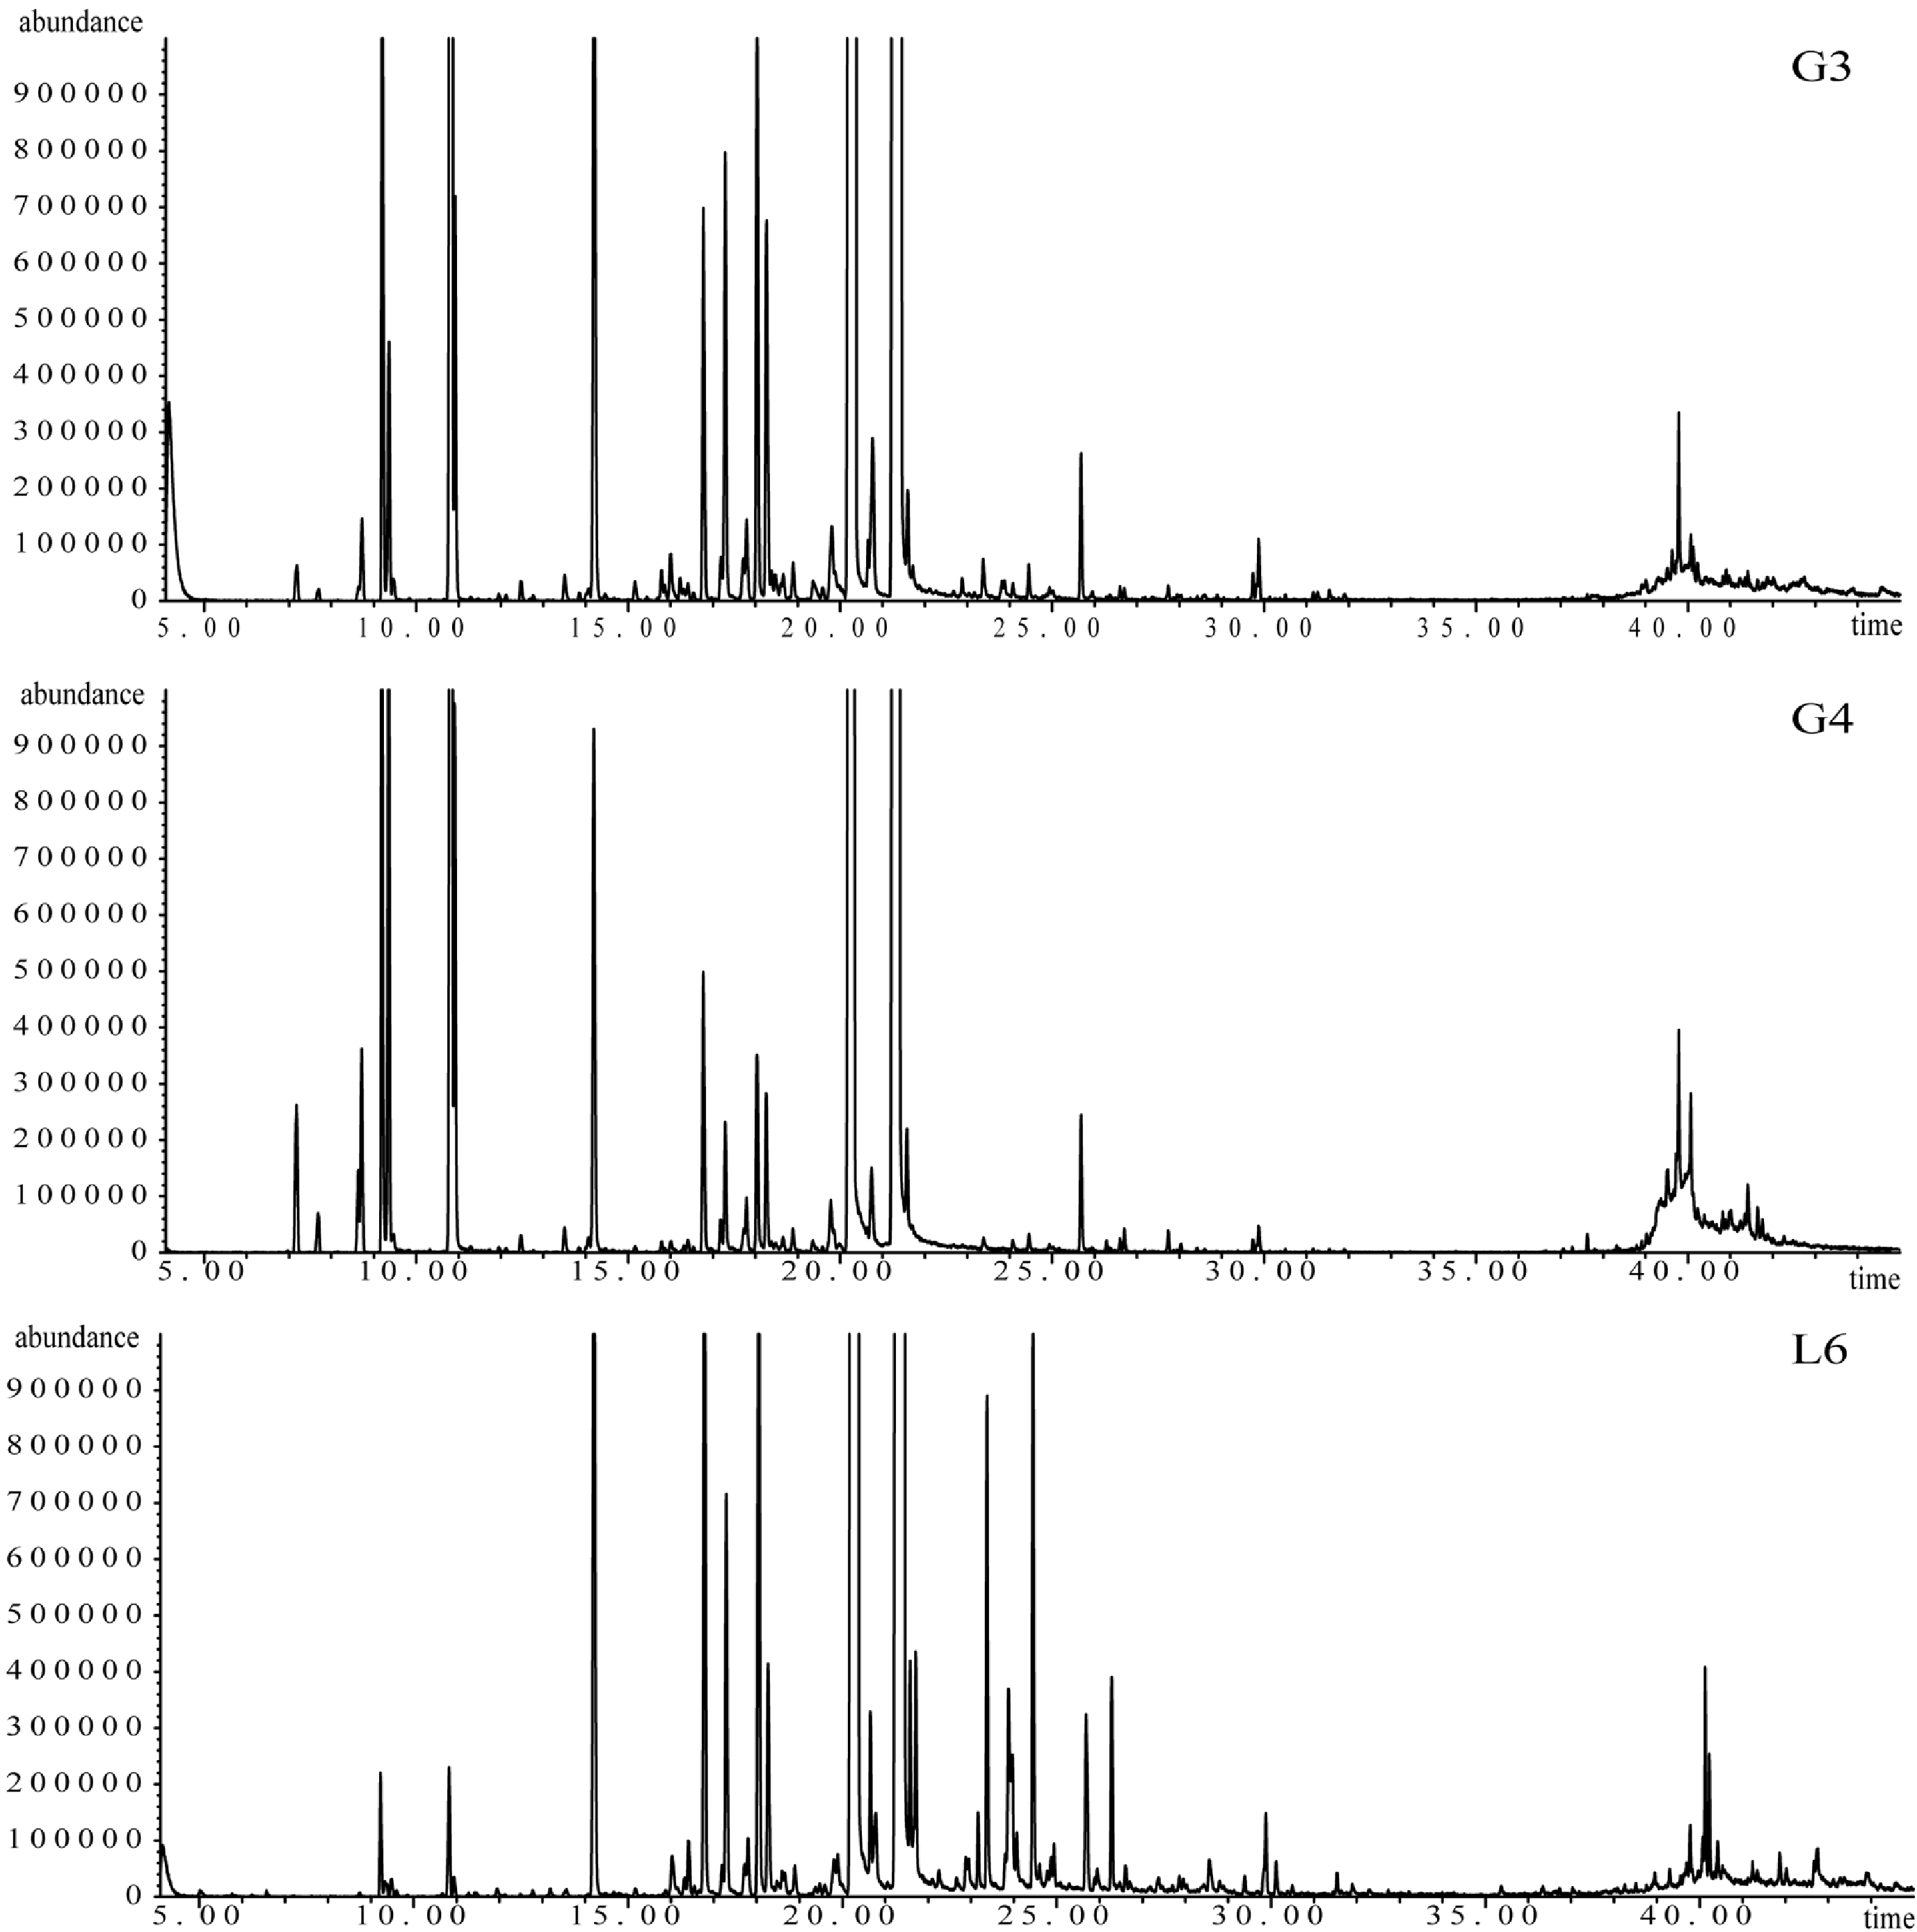
Figure 1.
GC–MS ion flow diagrams of essential oils from L. cubeba families G3, G4, and L6. The x-coordinate represents retention time in min, while the y-coordinate represents ion abundance.
-
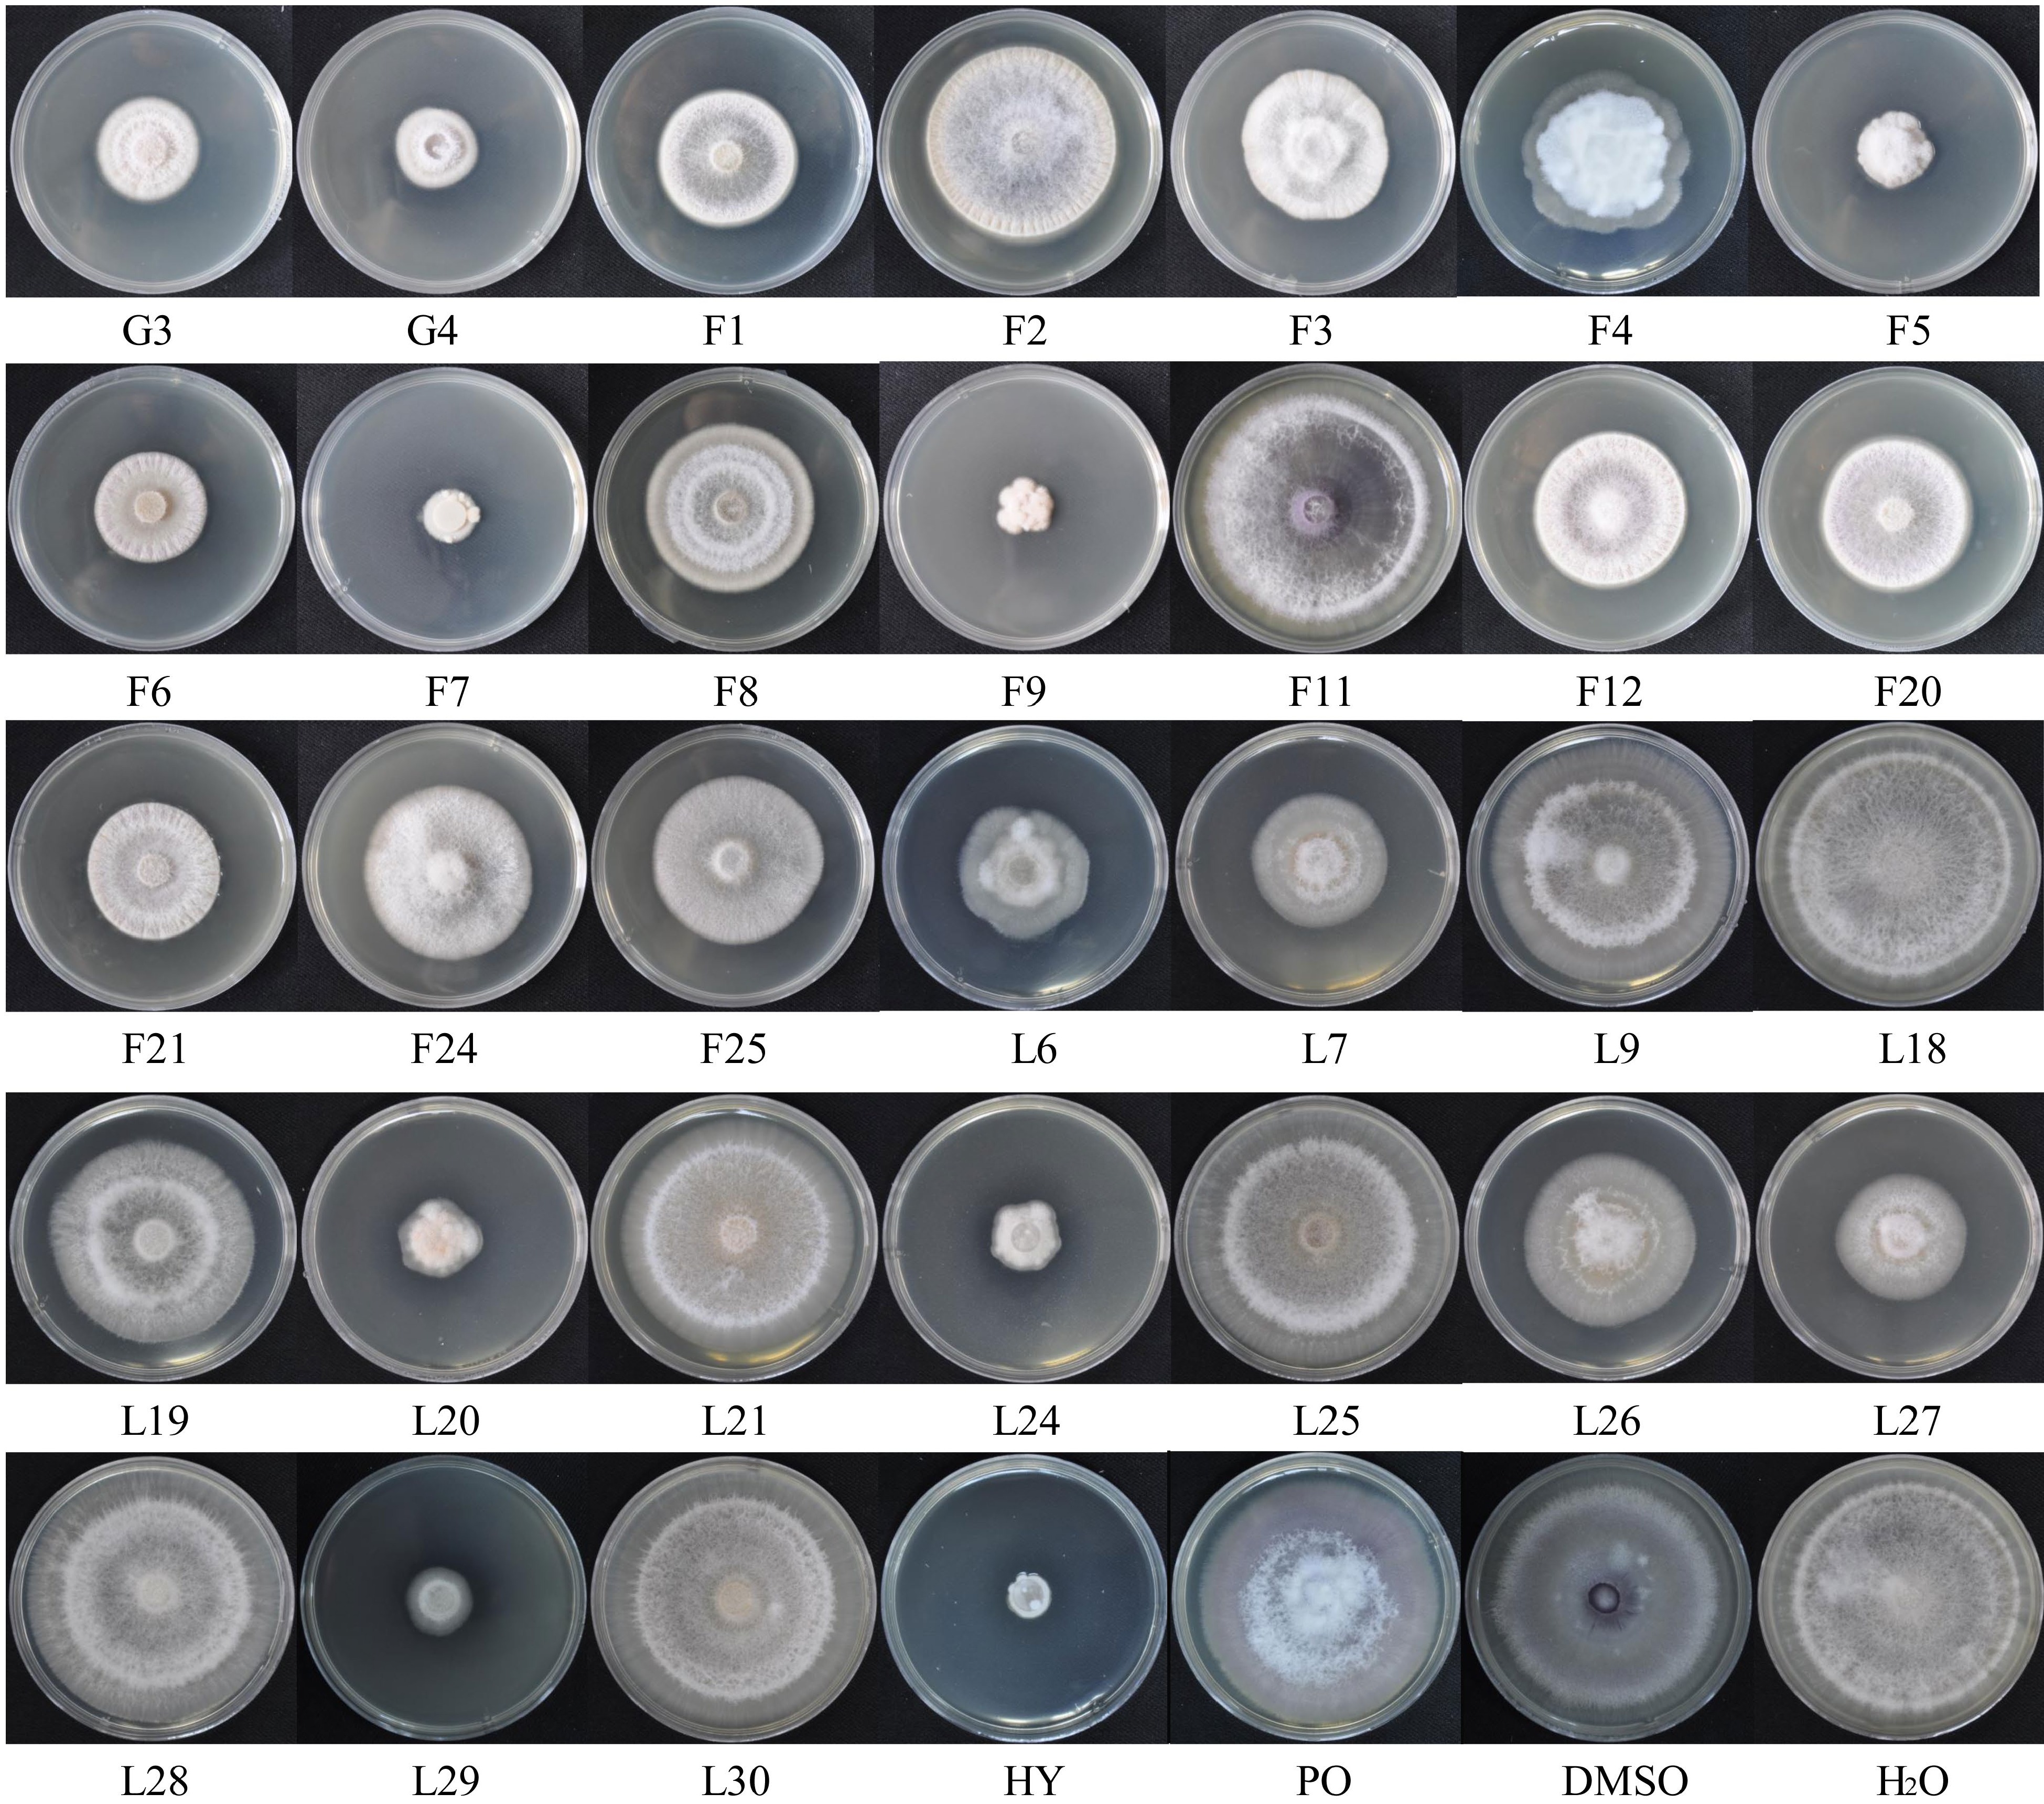
Figure 2.
The morphology of Fof-1 cultured with L. cubeba essential oils from families G3−L30. The pathogen Fof-1 was cultured at PDA medium with the L. cubeba essential oils from 24 families at the concentration 250 µL/L in 7 days, the picture was recorded using a Digital Single Lens Reflex camera (Nikon D610). G3−L30 represented the families of L. cubeba. The 'HY' and 'PO' were represented for two inorganic antifungal and antibacterial agents (hygromycin and polyoxin, respectively). The 'H2O' expressed that water was used instead of essential oils as a control test. Petri dishes with diameter 90 mm were used.
-
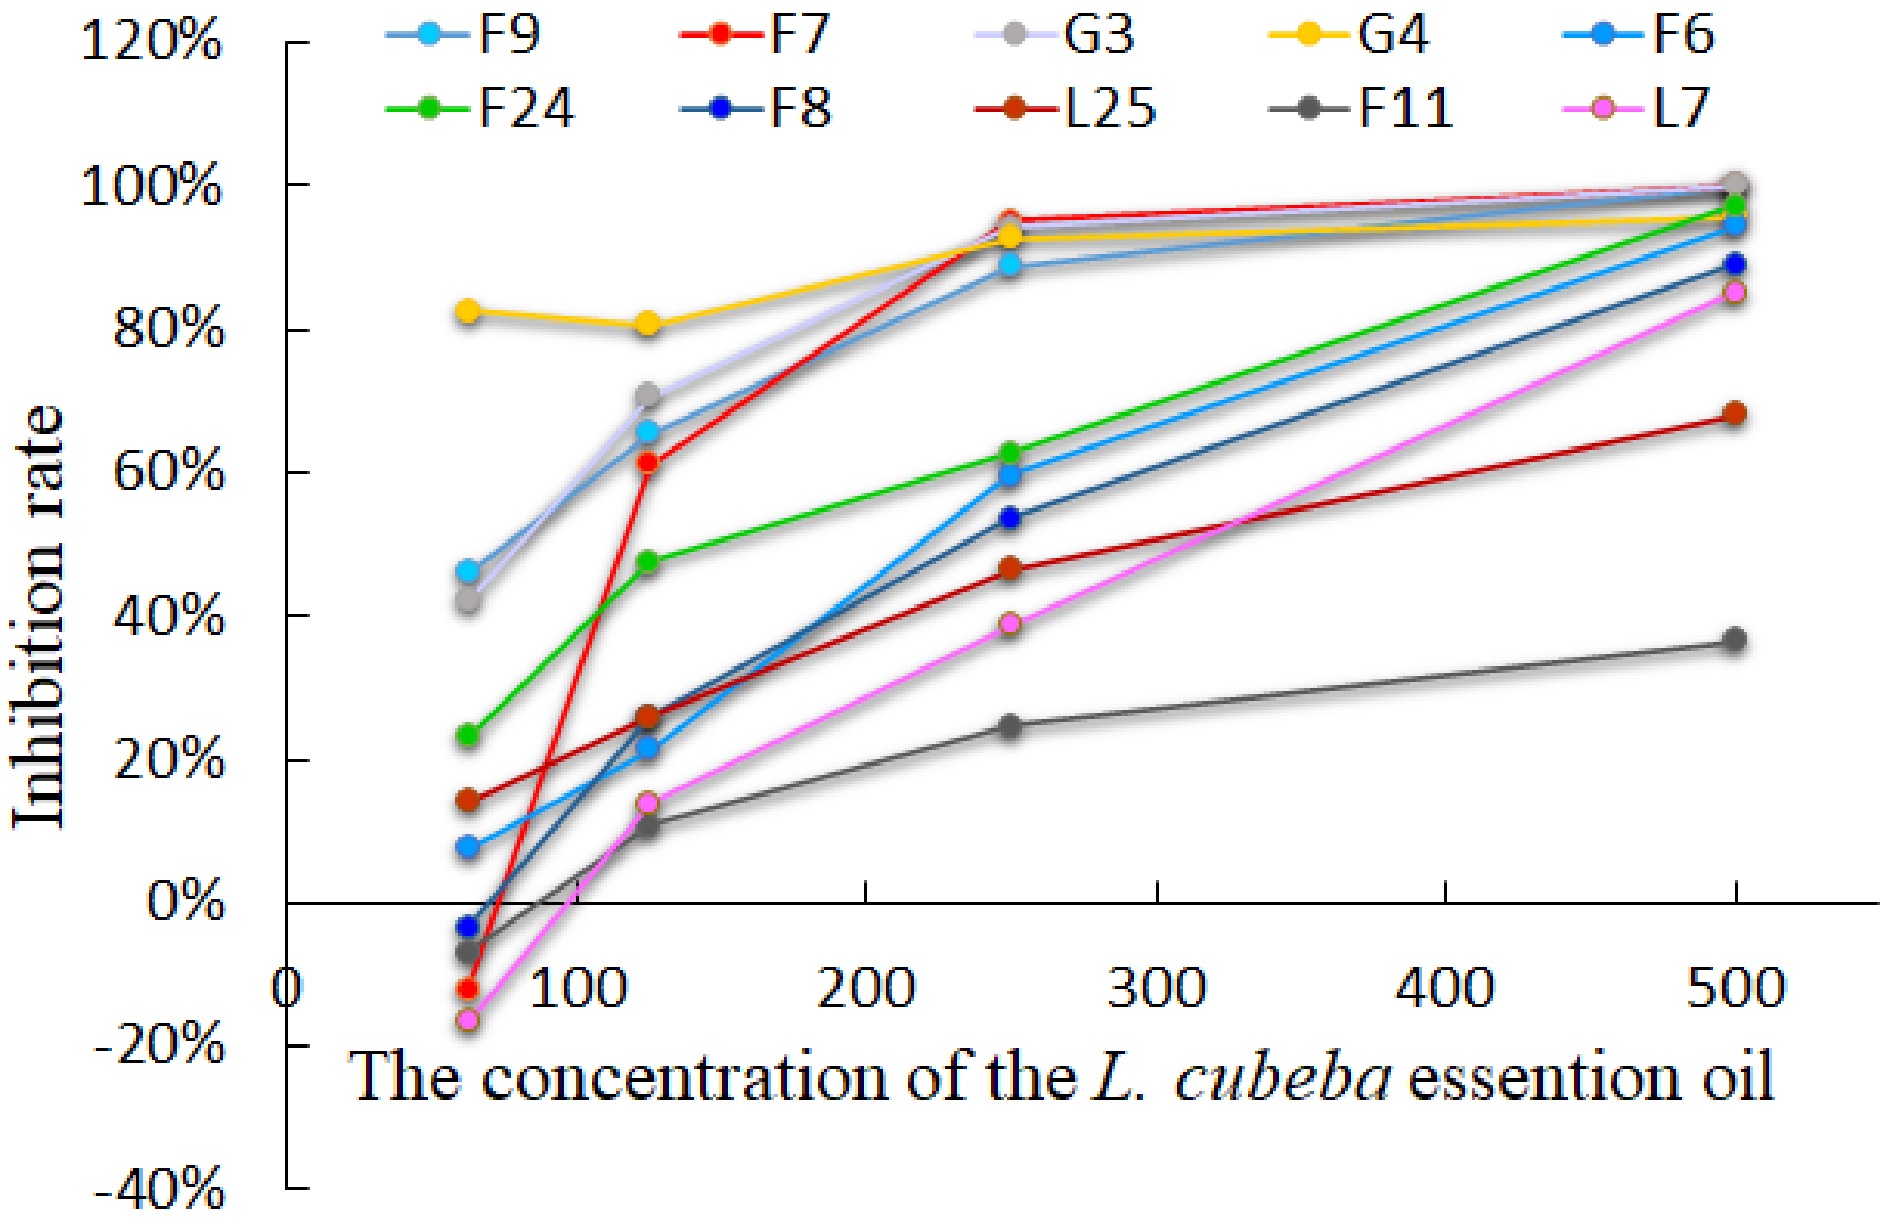
Figure 3.
The inhibition rate of L. cubeba essential oils from different families with gradient concentrations against Fof-1 for 6 days. Lines with different colors represent the different families, including F9, F7, G3, G4, F6, F24, F8, L25, F11, and L7.
-
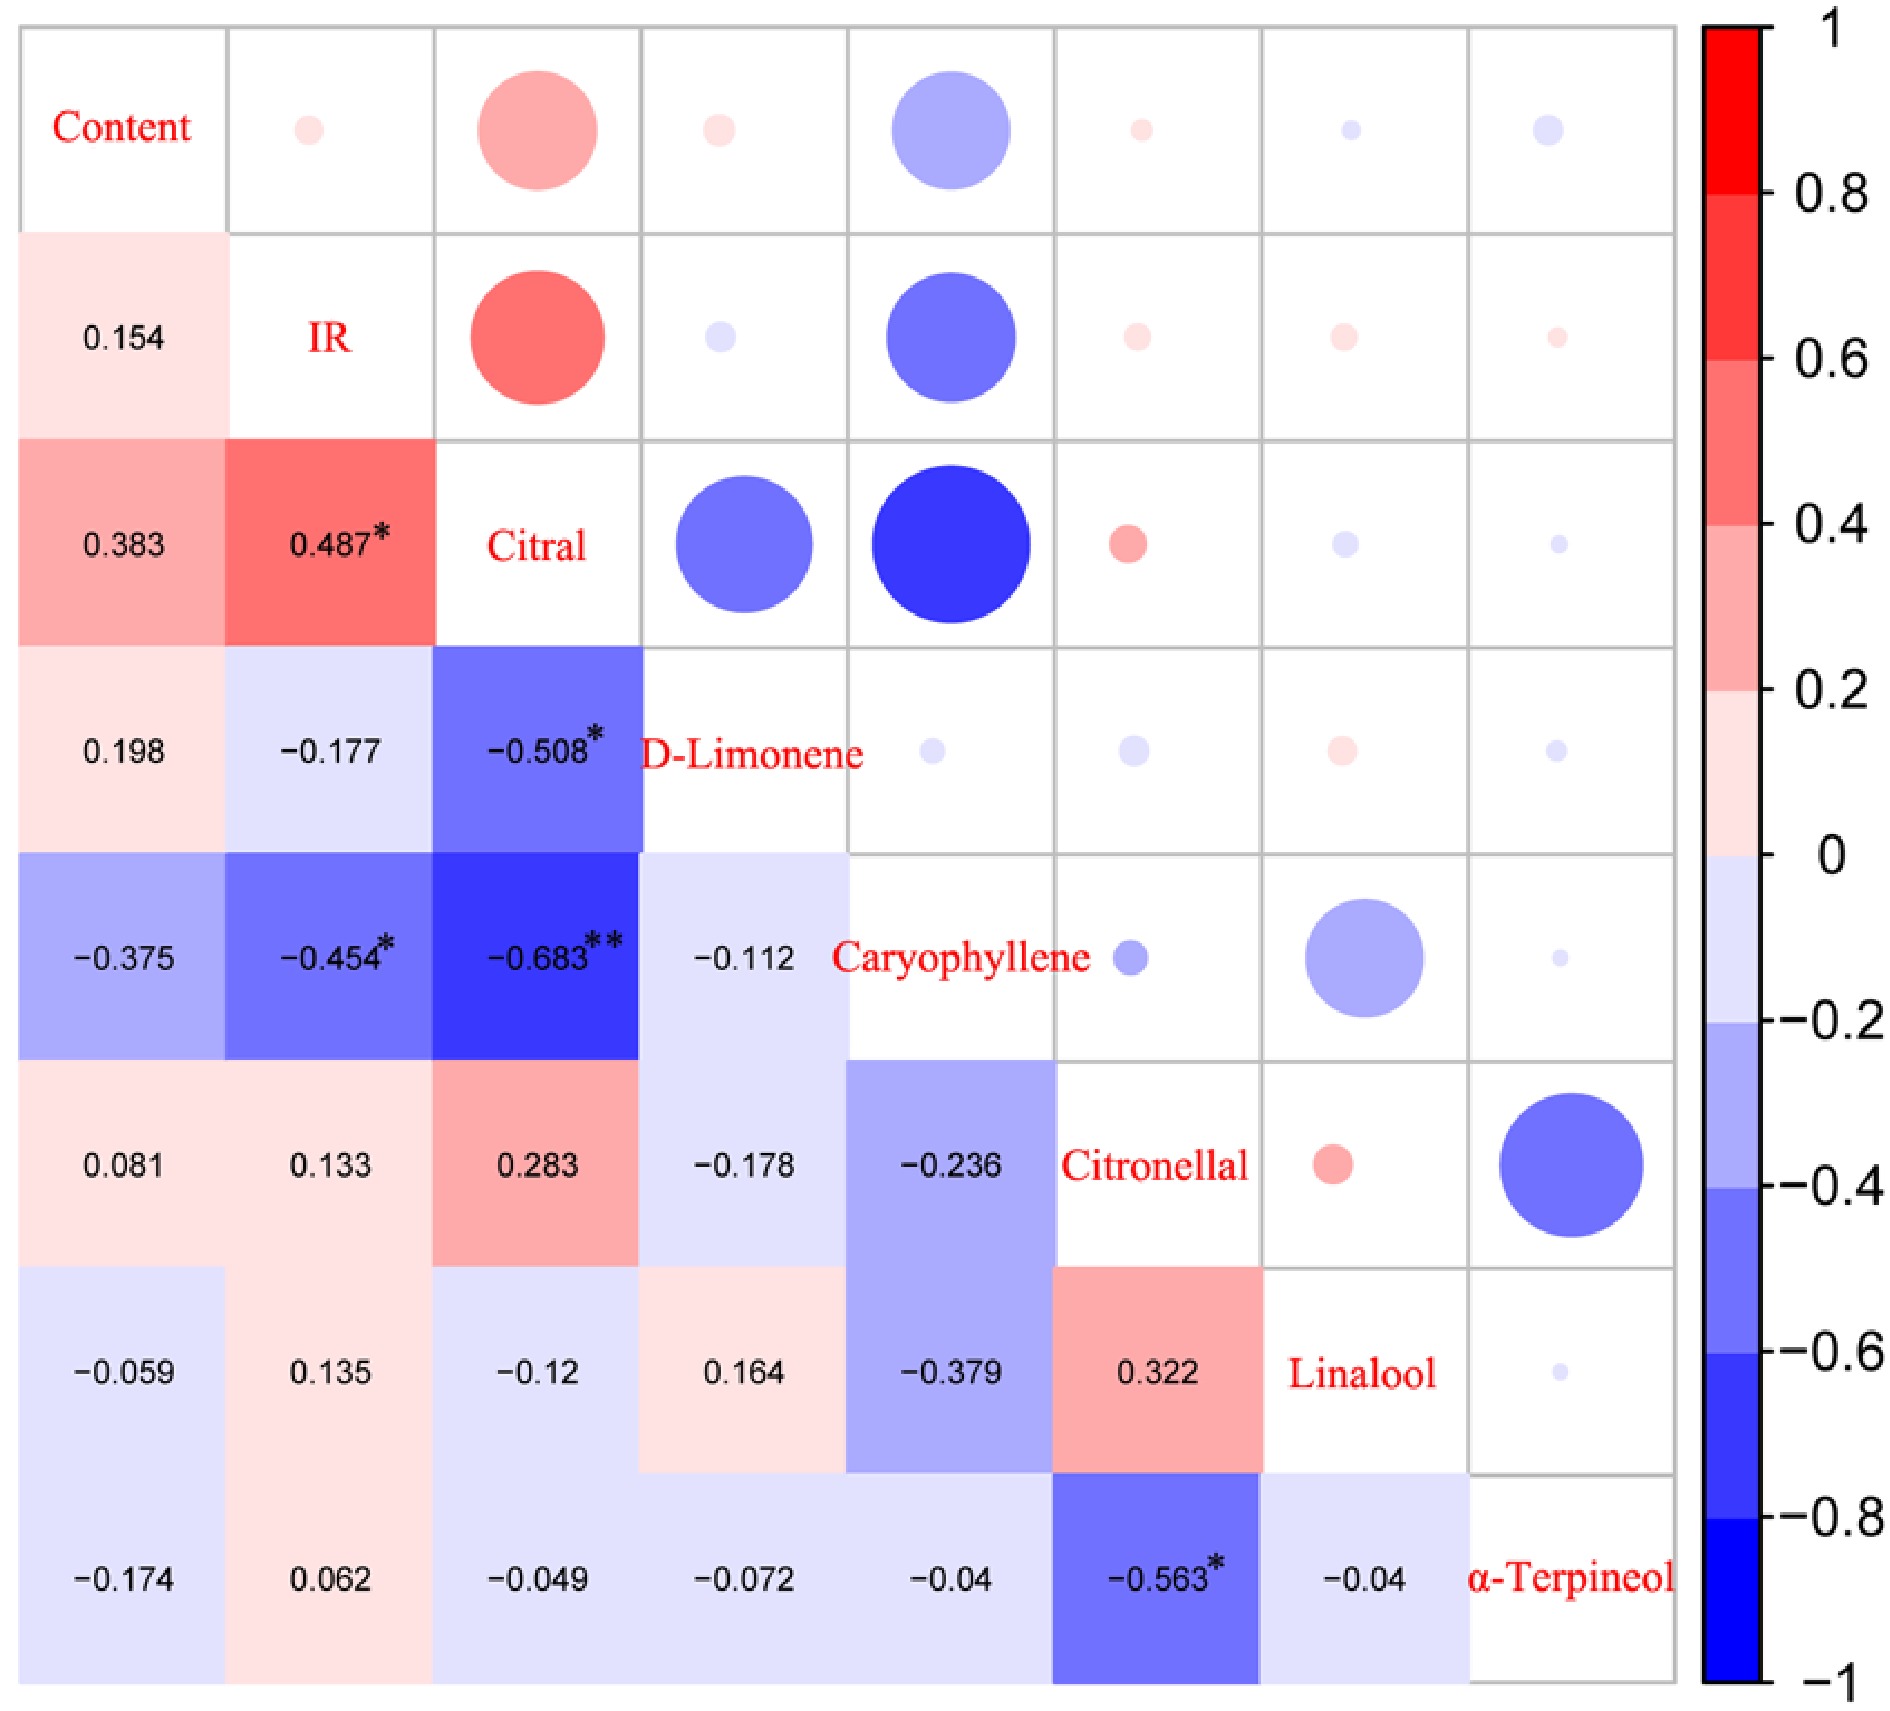
Figure 4.
Correlation analysis between the primary components and the inhibition rates of L. cubeba oils. The cells of the lower left triangle and the circles of the upper right triangle represent the same values. Red colors indicate positive correlation, while blue colors indicate negative correlation. The correlation factors are labeled on the diagonal. The symbol '*' indicates a significant correlation (significance level of 5%), and '**' indicates a highly significant correlation (significance level of 1%).
-
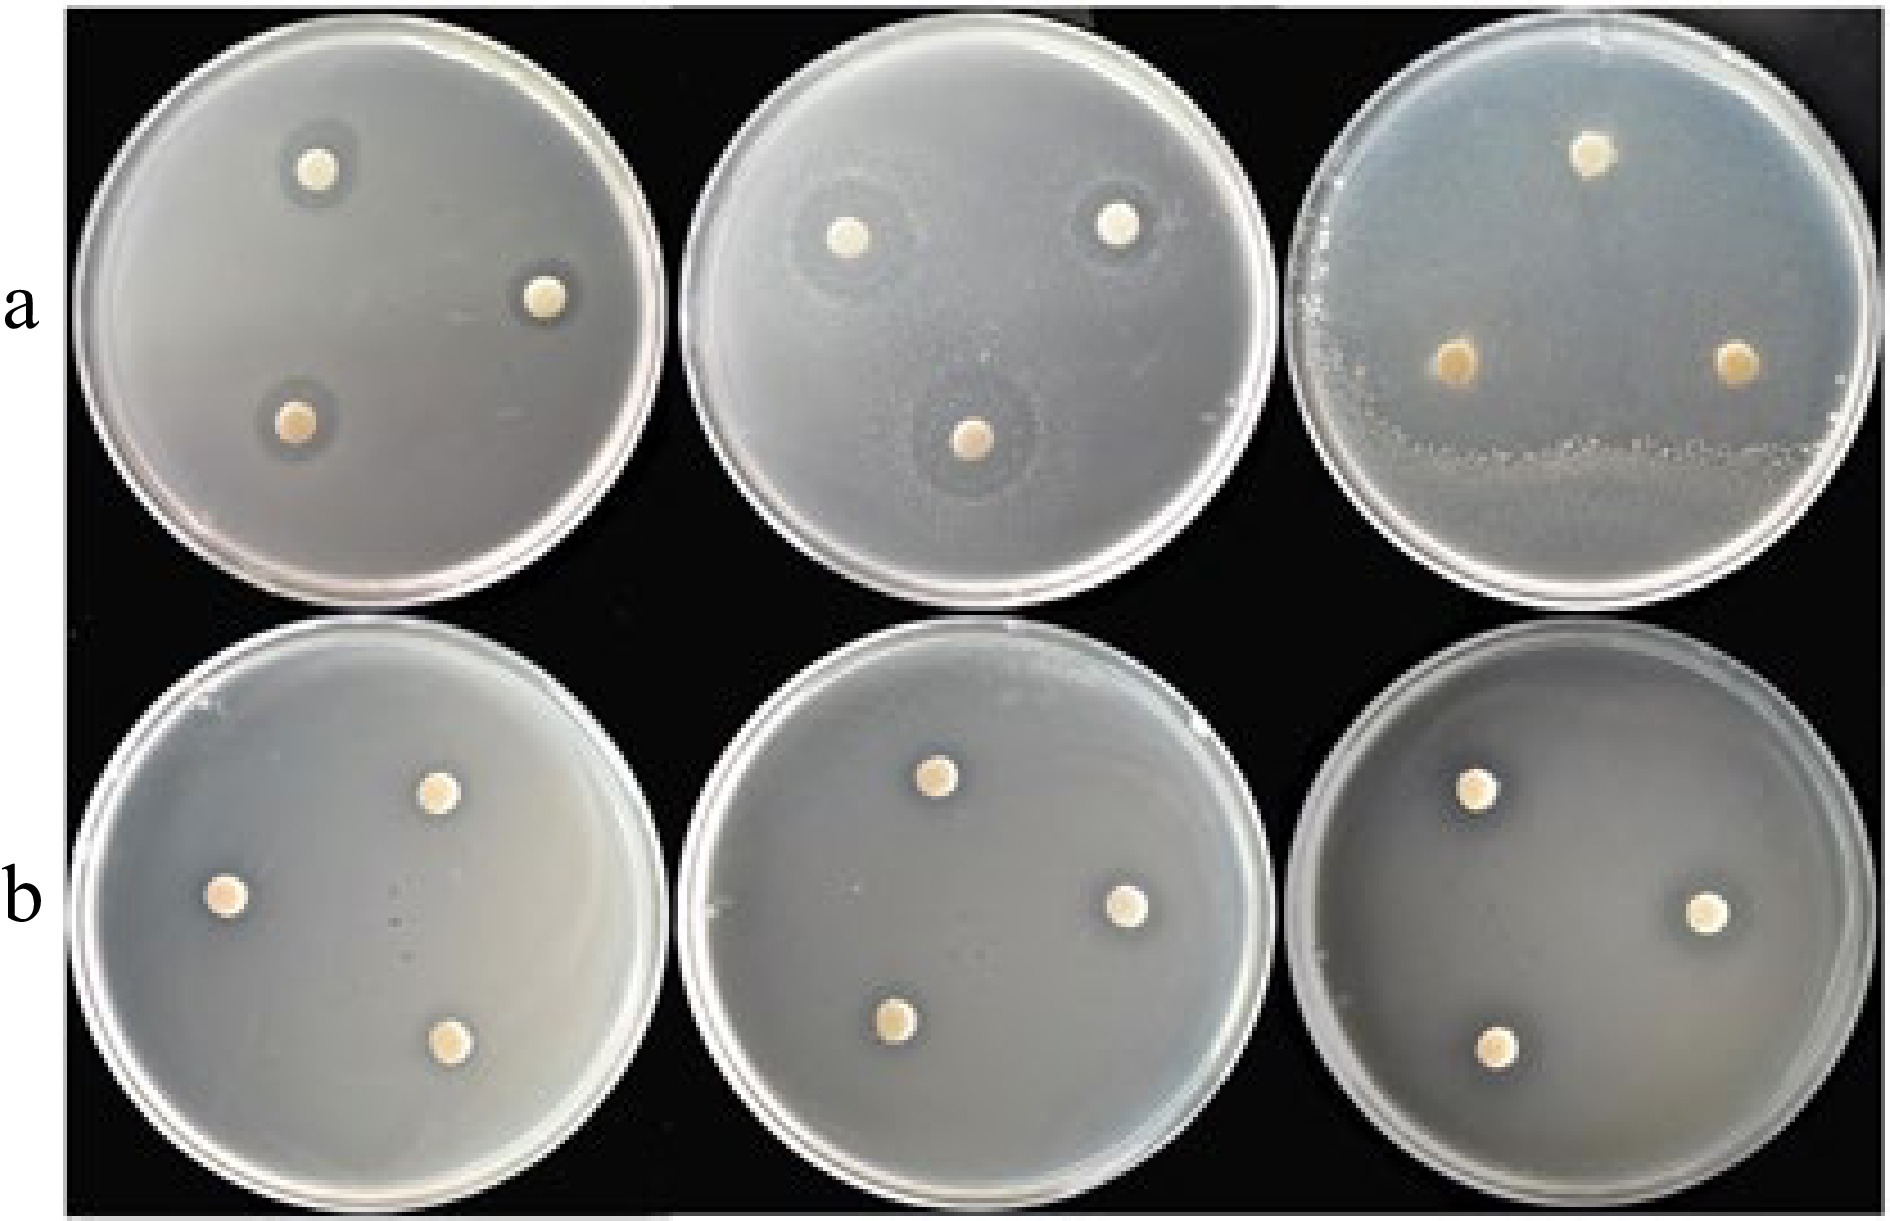
Figure 5.
The antibacterial activity of L. cubeba essential oil from the G3 family against E. coli and L. monocytogenes. (a) Antibacterial effects of essential oil from the G3 family on E. coli. (b) Antibacterial effects of essential oil from the G3 family on L. monocytogenes. Essential oil concentrations from left to right are 25, 50, and 100 μL/mL. Petri dishes with a diameter of 90 mm were used.
-
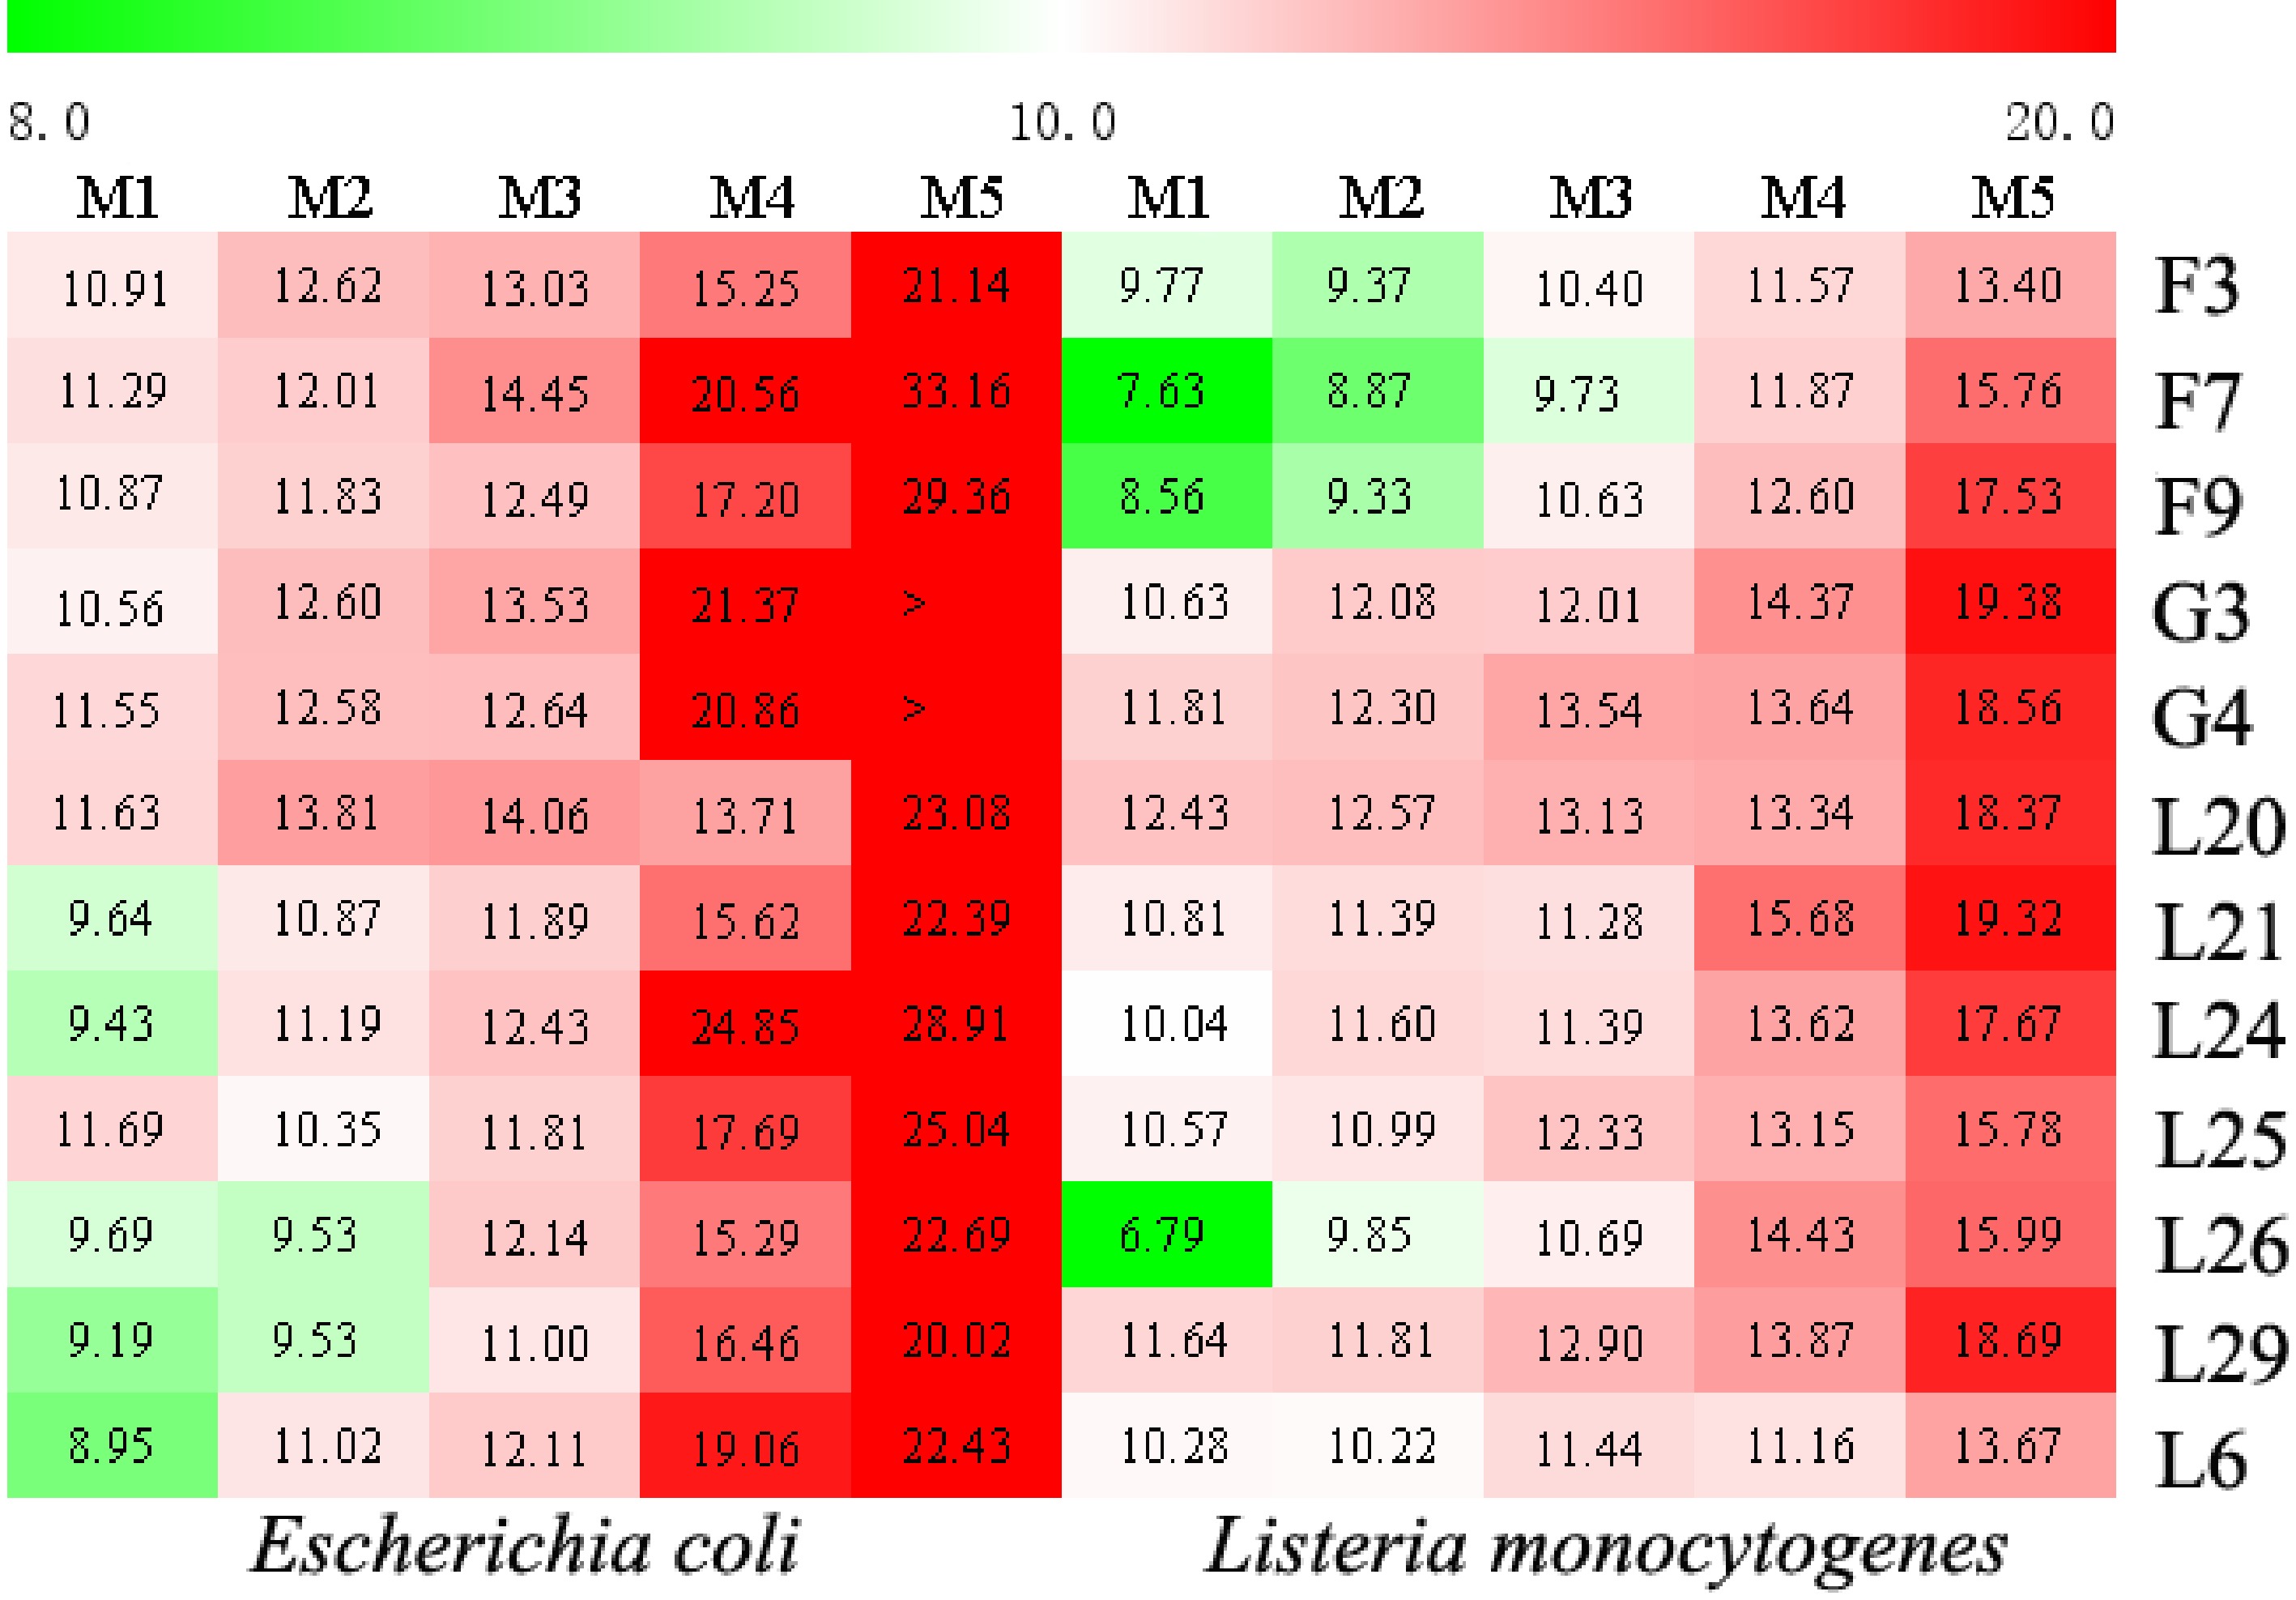
Figure 6.
The inhibition rate of L. cubeba essential oil from various families with gradient concentration against bacteria. The inhibition rates of L. cubeba essential oils were analyzed according to the size of the inhibition zone diameter, then utilized to construct a heat map using R (
www.r-project.org ). The red background represents strong inhibitory effects, the white background represents moderately inhibitory effects, and the green background indicates no inhibitory effect. M1 to M5 represent the different concentrations (6.25, 12.5, 25, 50, and 100 μL/mL) of essential oil from each family. The inhibition zone indicates the diameter of the filter paper disk (6 mm). -
Related age Yield per plant
(Coefficient)Oil content
(Coefficient)2014−2015 0.79** 0.69** 2014−2016 0.72** 0.77** 2014−2017 0.82** 0.47** 2015−2016 0.71** 0.77** 2015−2017 0.75** 0.56** 2016−2017 0.77* 0.49** * indicates a significant correlation (significance level of 5 %),
** indicates a highly significant correlation (significance level of 1 %).Table 1.
Correlation between yield per plant and oil content across different years.
-
Monoterpene
hydrocarbonsOxygenated
monoterpenesSesquiterpenes Diterpenes Others Numbers 24 40 10 1 29 Total
content0.03%−11.92% 79.78%−97.45% 0.21%−6.23% 0.05%−0.43% 0.34%−12.45% Table 2.
Classification and statistics of chemical constituents in oil extracted from 31 L. cubeba families.
-
Families Inhibition rate % Toxicity equation R2 MIC µL/L EC50 µL/L 62.5 µL/L 125 µL/L 250 µL/L 500 µL/L HY 60.76% 74.06% 81.95% 98.20% y = 0.401x + 0.2868 0.9616 600.6 34.0 PO −10.74% −2.37% 8.82% 22.25% y = 0.4856x − 0.5758 0.9920 17,581.6 1,642.1 F1 11.62% 28.98% 63.71% 96.57% y = 0.962x − 0.6978 0.9816 581.9 175.8 F11 −6.38% 10.06% 22.47% 64.21% y = 0.8761x − 0.8473 0.9423 1,284.0 345.0 F12 13.33% 29.10% 62.50% 97.41% y = 0.9489x − 0.6779 0.9750 586.5 174.3 F2 10.01% 33.98% 60.39% 97.84% y = 0.963x − 0.6957 0.9884 576.6 174.4 F20 10.78% 21.23% 66.18% 94.75% y = 0.9861x − 0.7477 0.9542 592.0 184.2 F21 9.30% 25.81% 65.33% 97.85% y = 1.0138x − 0.7688 0.9771 555.5 178.5 F24 26.42% 49.56% 70.58% 99.05% y = 0.7937x − 0.376 0.9959 541.6 127.0 F25 49.04% 59.73% 72.91% 92.36% y = 0.4755x + 0.092 0.9810 812.0 72.1 F3 49.57% 57.75% 65.10% 89.64% y = 0.4561x + 0.1105 0.9808 891.7 71.4 F4 7.16% 34.70% 83.53% 100.00% y = 1.2686x − 0.9736 0.9747 359.5 145.1 F5 53.85% 63.20% 75.36% 95.19% y = 0.4523x + 0.1548 0.9700 739.0 58.0 F6 9.39% 27.78% 71.21% 97.64% y = 1.0237x − 0.762 0.9784 526.3 170.9 F7 5.60% 62.46% 98.37% 100.00% y = 1.5408x − 1.1353 0.9833 243.1 115.2 F8 7.80% 25.73% 49.65% 91.58% y = 0.9143x − 0.7036 0.9616 729.9 207.2 F9 44.78% 67.54% 91.76% 100.00% y = 0.7803x − 0.1756 0.9997 321.1 73.4 G3 48.01% 76.79% 96.37% 100.00% y = 0.8031x − 0.1437 0.9881 265.5 63.3 G4 84.36% 86.54% 92.03% 98.23% y = 0.1565x + 0.7077 0.9621 737.4 0.5 L18 11.15% 38.14% 61.36% 90.77% y = 0.8743x − 0.5879 0.9954 654.9 175.5 L19 66.64% 71.21% 80.47% 94.55% y = 0.2992x + 0.4075 0.9719 955.6 20.4 L20 37.88% 58.00% 67.58% 95.56% y = 0.6066x − 0.1092 0.9668 673.8 101.0 L21 15.43% 38.87% 65.01% 85.97% y = 0.7091x − 0.3835 0.9862 893.4 176.2 L24 25.71% 44.99% 59.72% 91.41% y = 0.7037x − 0.3233 0.9732 759.4 147.9 L25 17.66% 31.70% 49.24% 79.43% y = 0.6738x − 0.3954 0.9674 1,177.4 213.2 L26 30.22% 39.81% 55.00% 71.96% y = 0.4664x − 0.0894 0.9857 2,166.5 183.5 L27 23.69% 42.85% 68.82% 90.26% y = 0.7497x − 0.3712 0.9970 674.5 145.2 L28 46.00% 58.72% 75.90% 88.69% y = 0.4825x + 0.0714 0.9963 840.5 77.3 L29 43.06% 53.56% 63.83% 98.84% y = 0.6369x − 0.111 0.9760 555.1 91.1 L30 38.83% 50.15% 71.76% 85.69% y = 0.5387x − 0.056 0.9866 912.6 107.7 L6 34.74% 56.89% 78.87% 100.00% y = 0.7234x − 0.2261 0.9999 495.4 100.9 L7 9.78% 28.95% 49.78% 87.46% y = 0.7777x − 0.5401 0.9757 955.7 217.5 L9 34.92% 53.04% 69.14% 97.84% y = 0.6805x − 0.2115 0.9819 603.0 111.1 Annotations: 'HY' and 'PO' represent hygromycin and polyoxin, respectively. Based on the toxicity equation, the MIC value was used as the 'x' value when the 'y' value was set as one. Similarly, EC50 value was used as the 'x' value when the 'y' value was set as 0.5. Lower values of MIC and EC50 indicate stronger antifungal effect. Table 3.
Assessment of antifungal activities of essential oils produced by different L. cubeba families.
-
Essential
oils numberInhibition rate % 5 % significance
level1% significance
level96 h 120 h 144 h Average F7 100.00% 100.00% 95.10% 98.37% ± 2.83% a A HY 100.00% 98.27% 96.32% 98.2% ± 1.84% a A G3 98.32% 96.54% 94.25% 96.37% ± 2.04% a AB G4 91.41% 92.06% 92.64% 92.03% ± 0.62% ab ABC F9 95.93% 90.60% 88.75% 91.76% ± 3.73% ab ABC F4 87.17% 84.77% 78.67% 83.53% ± 4.38% bc BCD L19 83.67% 82.11% 75.62% 80.47% ± 4.27% cd CDE L6 78.30% 79.28% 79.02% 78.87% ± 0.5% cde CDEF L28 79.14% 76.47% 72.09% 75.9% ± 3.56% cdef DEFG F5 77.31% 76.56% 72.21% 75.36% ± 2.76% cdefg DEFGH F25 77.98% 75.36% 65.39% 72.91% ± 6.64% cdefgh DEFGHI L30 76.36% 71.74% 67.17% 71.76% ± 4.59% defghi DEFGHI F6 82.90% 71.05% 59.70% 71.21% ± 11.6% defghi DEFGHI F24 77.00% 72.08% 62.65% 70.58% ± 7.29% defghij DEFGHI L9 72.97% 69.93% 64.54% 69.14% ± 4.27% efghijk EFGHIJ L27 72.18% 72.55% 61.72% 68.82% ± 6.15% efghijk EFGHIJ L20 67.54% 67.62% 67.59% 67.58% ± 0.04% fghijk EFGHIJ F20 77.05% 66.33% 55.15% 66.18% ± 10.95% fghijk FGHIJ F21 74.68% 65.94% 55.37% 65.33% ± 9.67% fghijkl FGHIJ F3 67.07% 66.17% 62.07% 65.1% ± 2.66% ghijkl FGHIJ L21 69.00% 65.53% 60.49% 65.01% ± 4.28% ghijkl FGHIJ F1 75.99% 62.92% 52.23% 63.71% ± 11.9% hijkl GHIJK F12 76.73% 61.25% 49.52% 62.5% ± 13.65% hijkl GHIJKL L18 70.48% 63.05% 50.56% 61.36% ± 10.07% ijkl HIJKL L29 60.03% 63.83% 59.34% 61.07% ± 2.42% ijkl IJKL F2 69.46% 61.51% 50.20% 60.39% ± 9.68% jklm IJKL L24 63.32% 60.78% 55.04% 59.72% ± 4.24% klmn IJKL L26 60.22% 55.95% 48.82% 55% ± 5.76% lmn JKL L7 61.38% 49.18% 38.79% 49.78% ± 11.31% mn KL F8 43.13% 52.20% 53.60% 49.65% ± 5.68% n KL L25 51.96% 49.31% 46.47% 49.24% ± 2.75% n L F11 20.25% 22.55% 24.61% 22.47% ± 2.18% o M PO 15.79% 24.24% 26.73% 22.25% ± 5.73% o M LSD tests were used for analysis of variance (ANOVA). Lowercase letters indicate 5% significance, while uppercase letters indicate 1% significance. Identical letters for treatments indicate that they were not significantly different when compared. Two letters, such as 'cd', indicate that there are significant differences among all treatments that contain neither 'c' or 'd'. The symbol '±' indicates the average value of the standard deviation among comparisons. Table 4.
The significance tests of L. cubeba essential oils at a concentration of 250 µL/L.
-
Families Essential oil content % Provenance Families Oil yield % Provenance G3 4.48% Dushan, Guizhou province F9 3.09% Jianyang, Fujian province G4 6.56% Dushan, Guizhou province L6 12.05% Bijie, Guizhou province F21 2.39% Anhui province L7 6.44% Bijie, Guizhou province F1 5.00% Fenyi, Jiangxi province L9 5.41% Bijie, Guizhou province F2 4.30% Fenyi, Jiangxi province L30 2.35% Fuyang, Zhejiang province F3 3.22% Fenyi, Jiangxi province L24 5.57% Jianou, Fujian province F4 2.44% Fenyi, Jiangxi province L25 5.46% Jianou, Fujian province F12 2.98% Fuyang, Zhejiang province L26 4.80% Jianou, Fujian province F24 4.00% Guangxi Zhuang Autonomous region L27 1.96% Jianou, Fujian province F20 3.18% Huangshan, Anhui province L28 4.45% Jianou, Fujian province F25 2.44% Jiangle, Fujian province L29 5.09% Jianou, Fujian province F11 1.85% Jianyang, Fujian province L18 1.88% Yuexi, Anhui province F5 2.76% Jianyang, Fujian province L19 3.94% Yuexi, Anhui province F6 3.76% Jianyang, Fujian province L20 3.86% Yuexi, Anhui province F7 2.46% Jianyang, Fujian province L21 3.83% Yuexi, Anhui province F8 1.82% Jianyang, Fujian province Table 5.
The oil contents of 31 families from five provenances in a field experimental trial in Liping county, Guizhou Province.
Figures
(6)
Tables
(5)