-
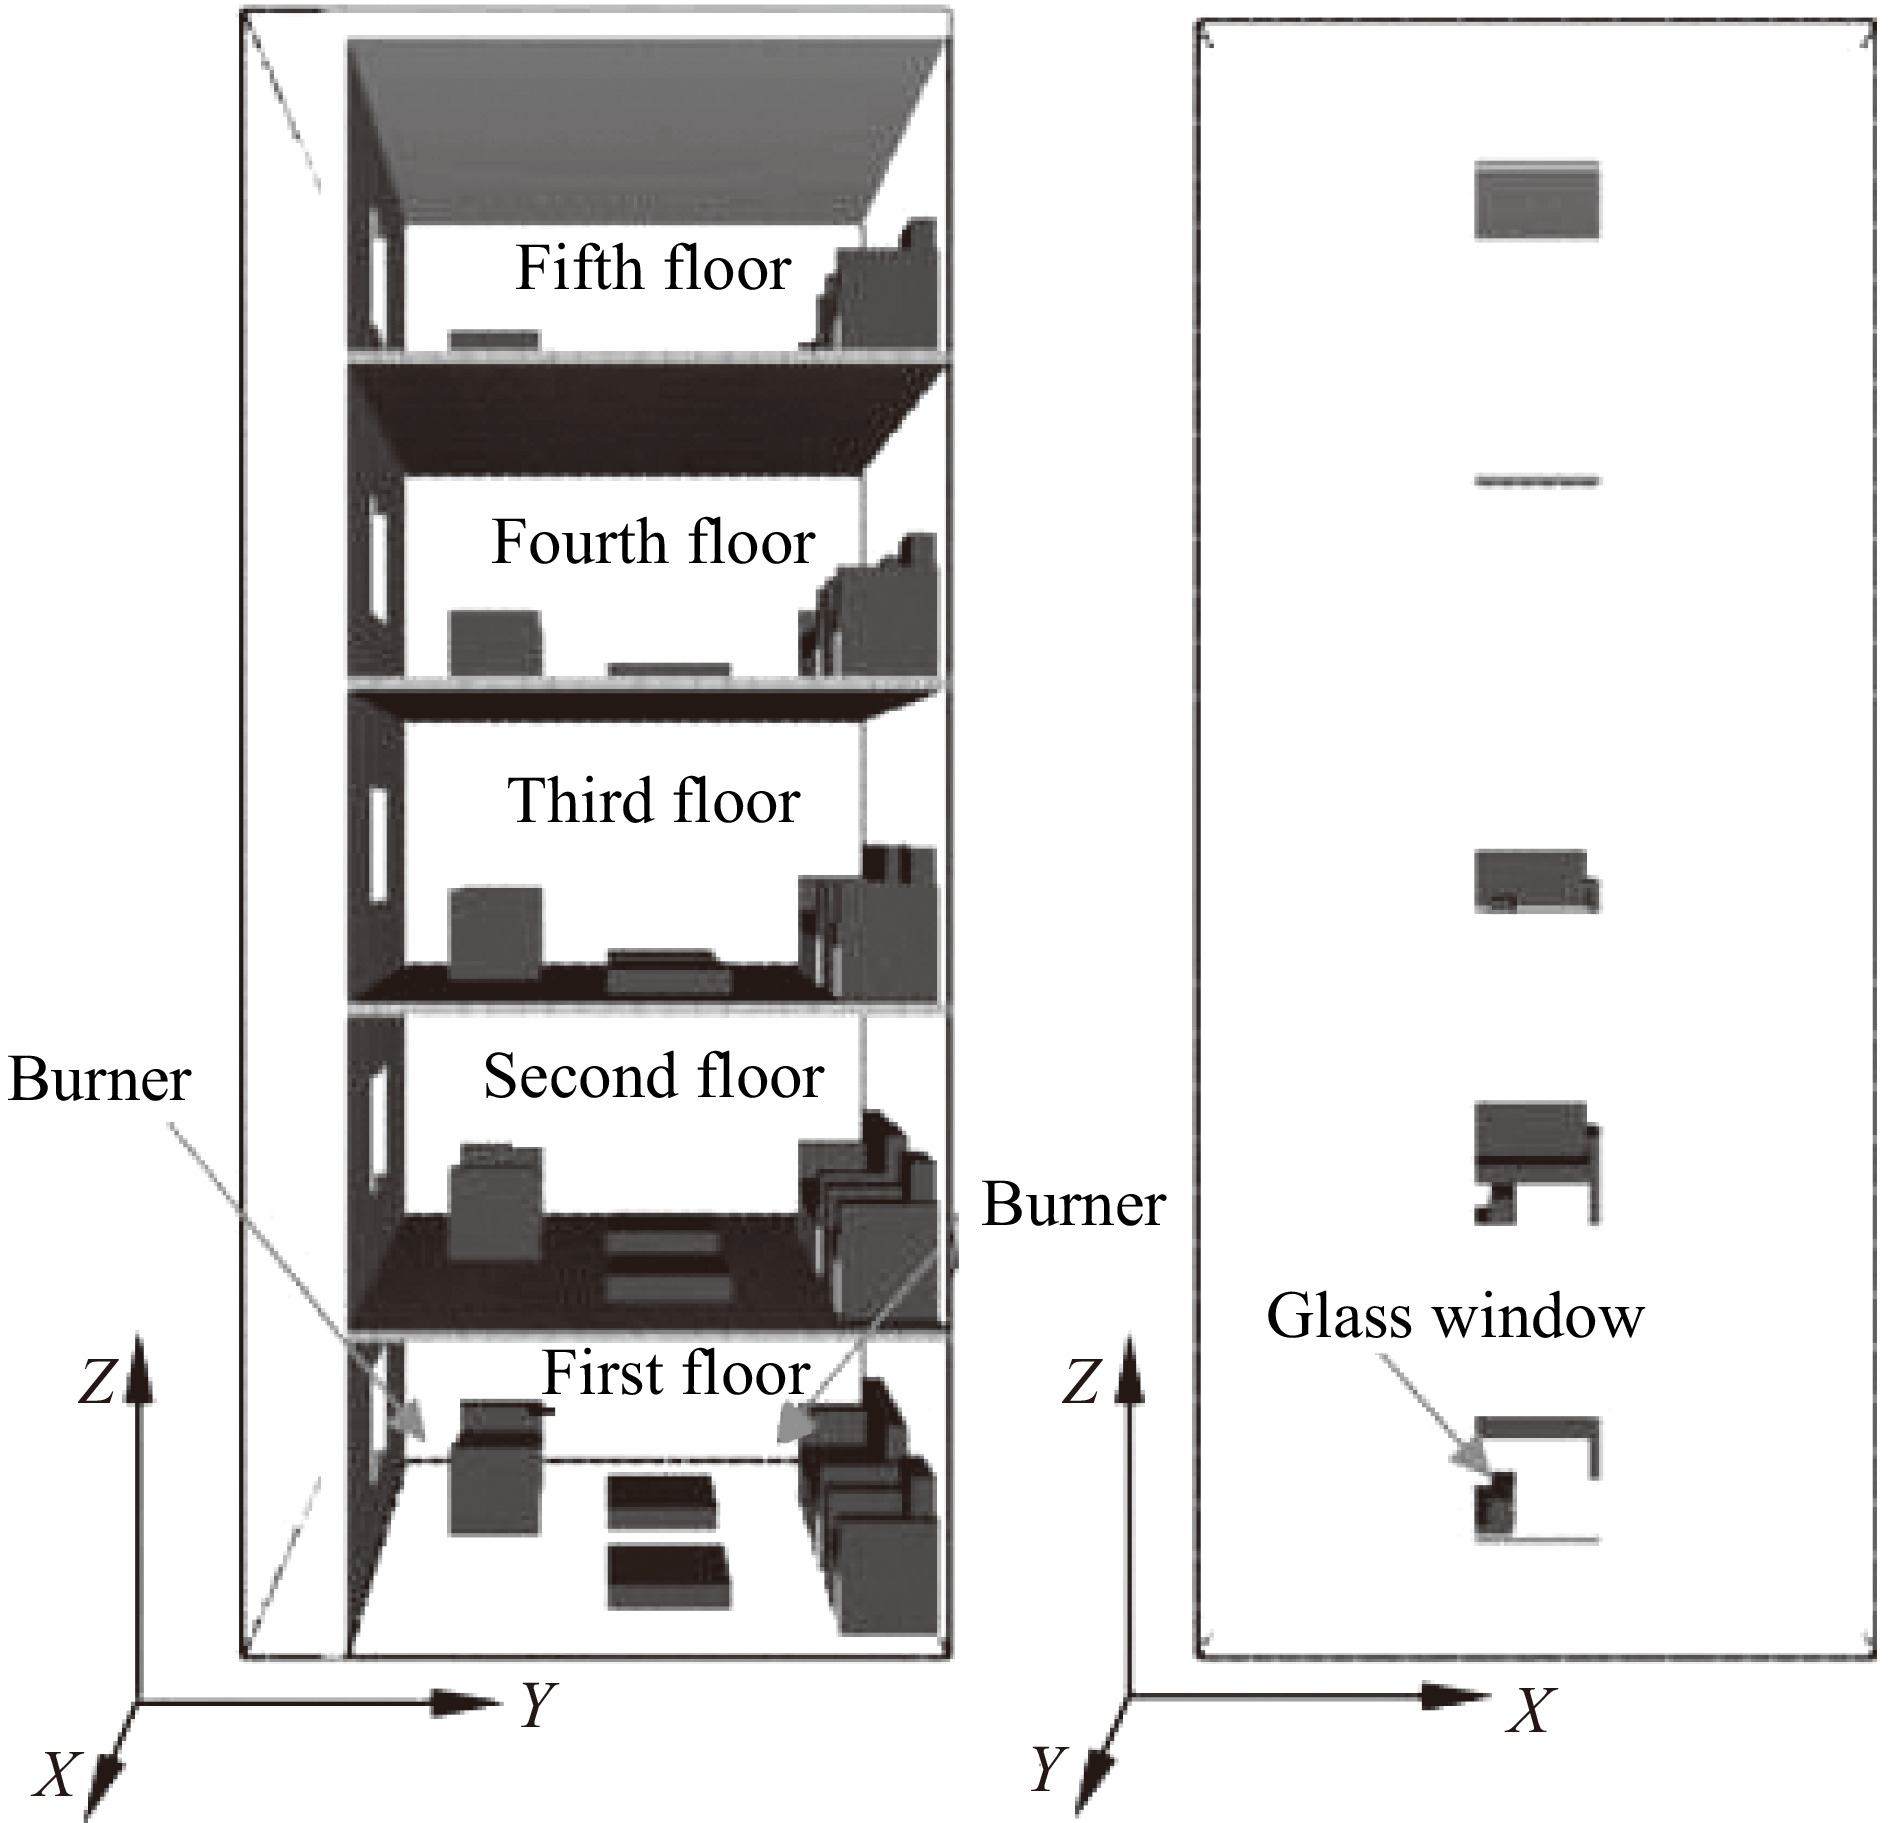
Figure 1.
Elevation view and side view of the five-storey building model. (a) Front view of five-storey building model, (b) side view of the five-storey building model.
-
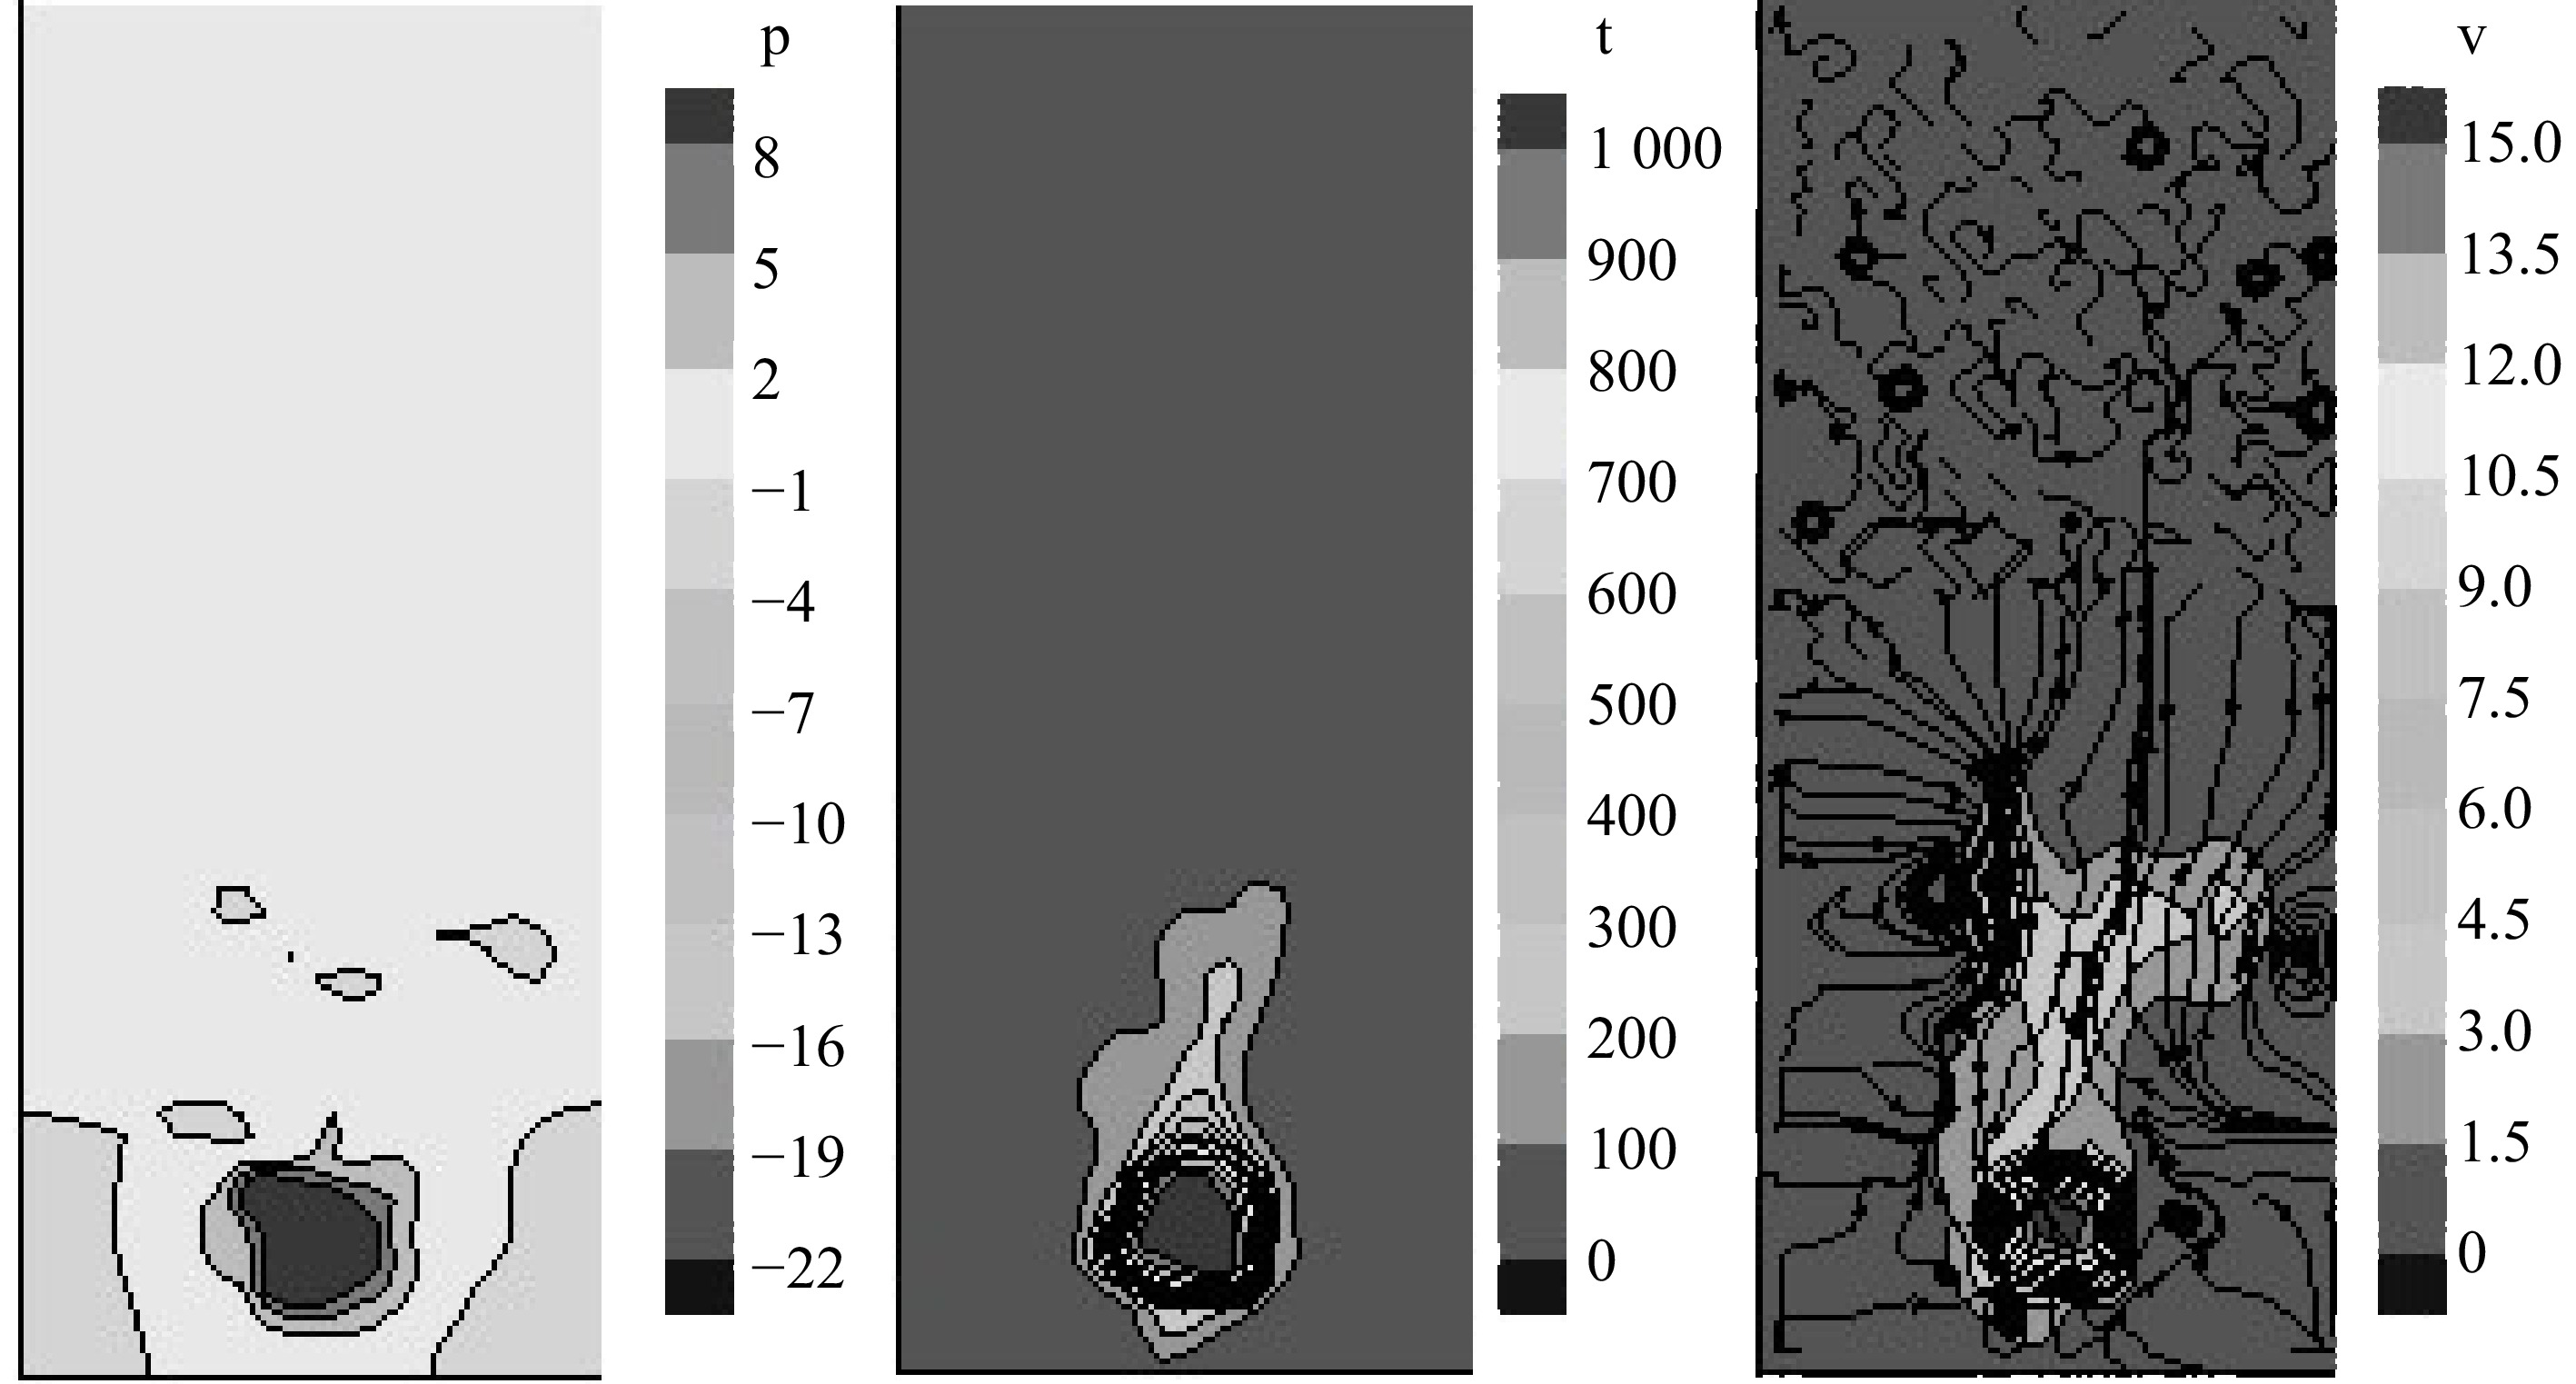
Figure 2.
Cloud map of the outer wall at y = −0.2 m perpendicular to the direction of the wall at t = 5.6 s. (a) Pressure cloud map, (b) temperature cloud map, (c) velocity cloud map.
-

Figure 3.
y = −0.2 m of the outer wall perpendicular to the direction of the wall at t = 45.2 s. (a) Temperature cloud map, (b) velocity cloud map, (c) one-dimensional temperature cloud image at Z = 1.15 m.
-

Figure 4.
The pressure at y = −0.2 m on the outside wall and the temperature at x = 2.6 m on the parallel wall when t = 58.5 s. (a) Pressure cloud map, (b) parallel to the wall temperature cloud map.
-
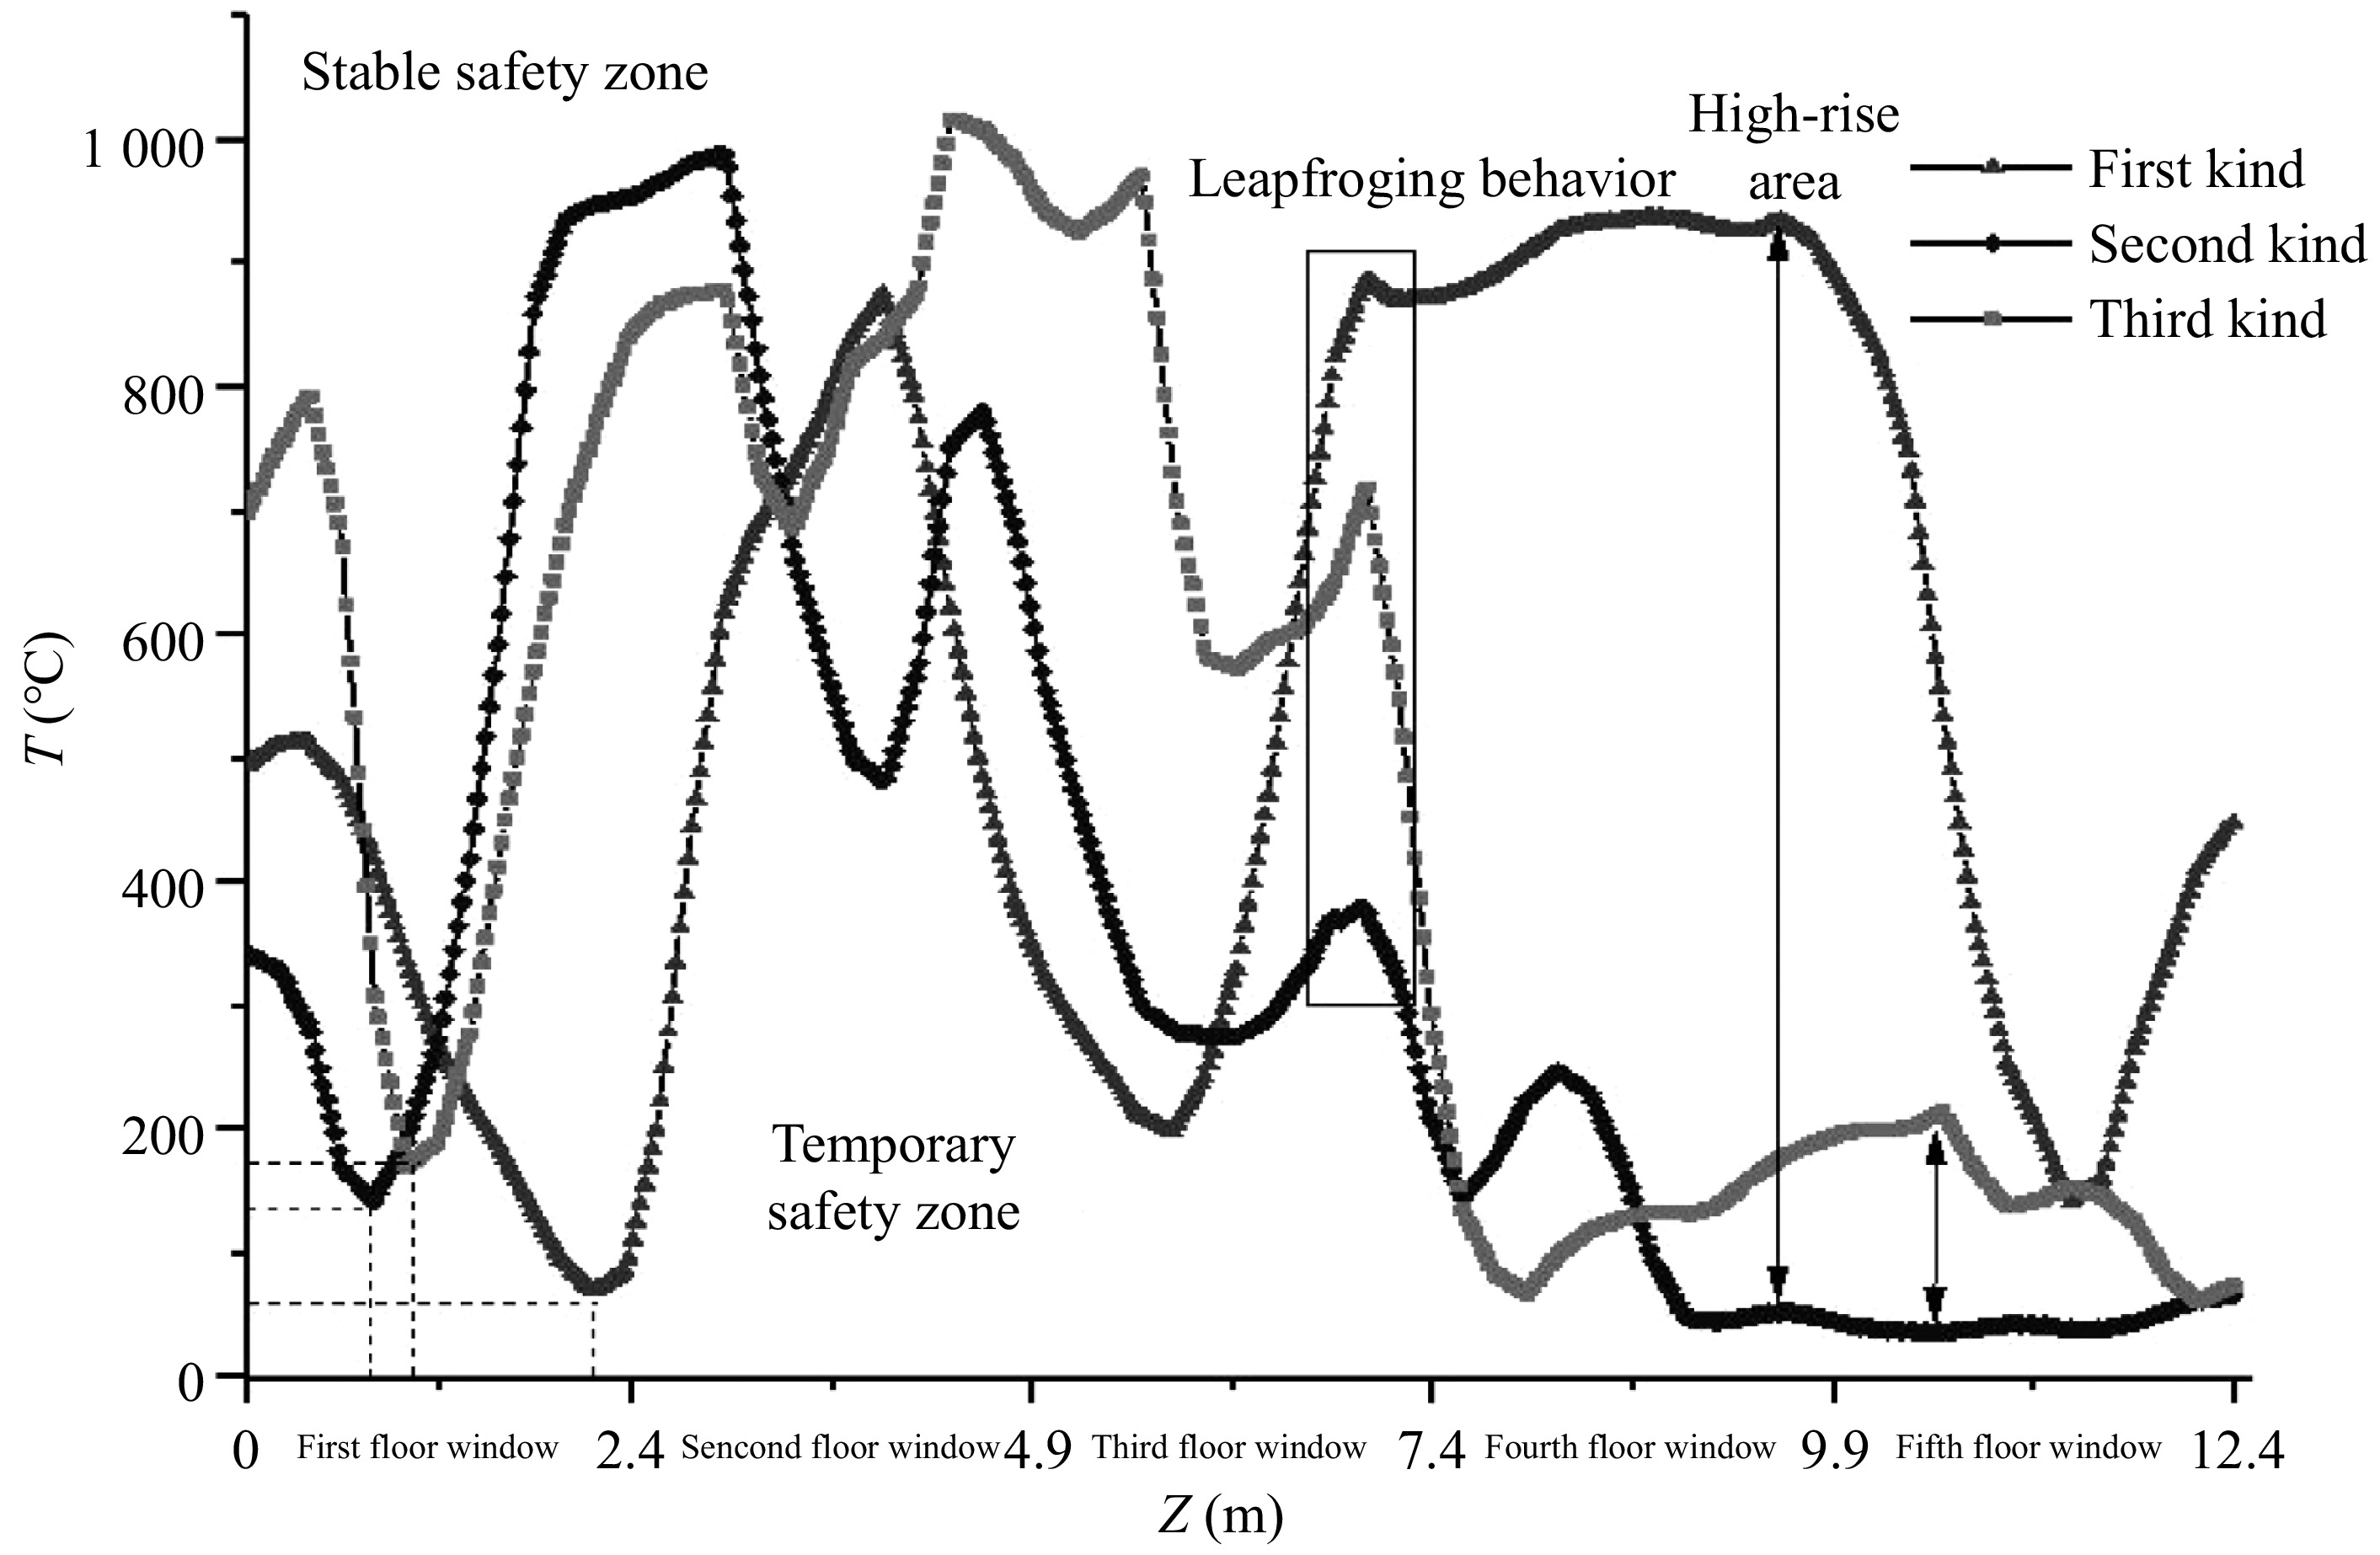
Figure 5.
Temperature change curves of three glass window opening sequences at y = −0.2 m and x = 2.6 m on the outside wall.
-

Figure 6.
Flow velocity maps at y = 0.2 m and y = −0.2 m of the inner and outer walls in the opening sequence of the second and third case at t = 47.4 m. (a) Velocity cloud map at y = 0.2 m for Case 2, (b) velocity cloud map at y = −0.2 m for Case 2, (c) velocity cloud map at y = 0.2 m for Case 3, (d) velocity cloud map at y = −0.2 m for Case 3.
-
Rupture mode Average area
(m2)Average width
(m)Average length
(m)Case 1 10.430 2.563 5.403 Case 2 10.970 3.688 5.062 Case 3 10.350 2.719 5.091 Table 1.
Flame characteristics of the three window opening sequences.
Figures
(6)
Tables
(1)