-
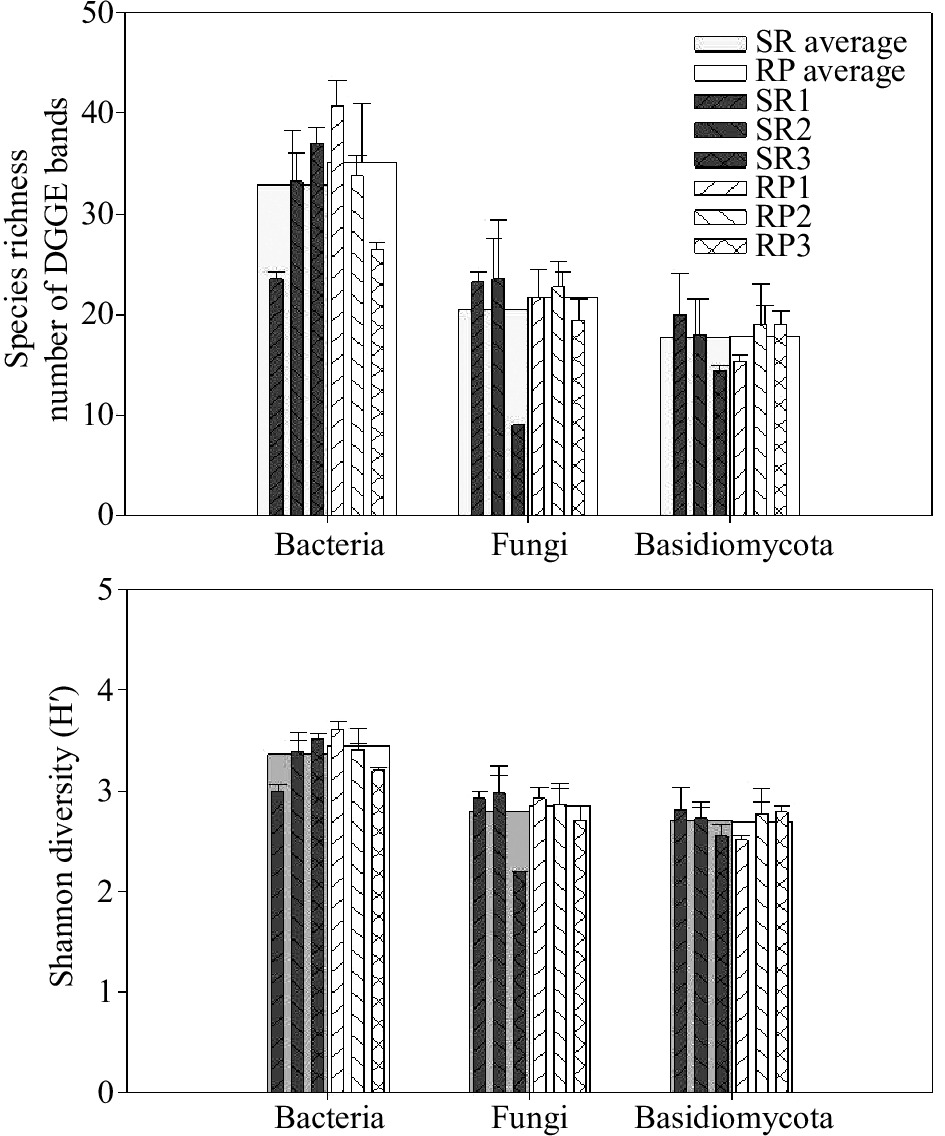
Figure 1.
Richness and diversity index calculated from DGGE.
-
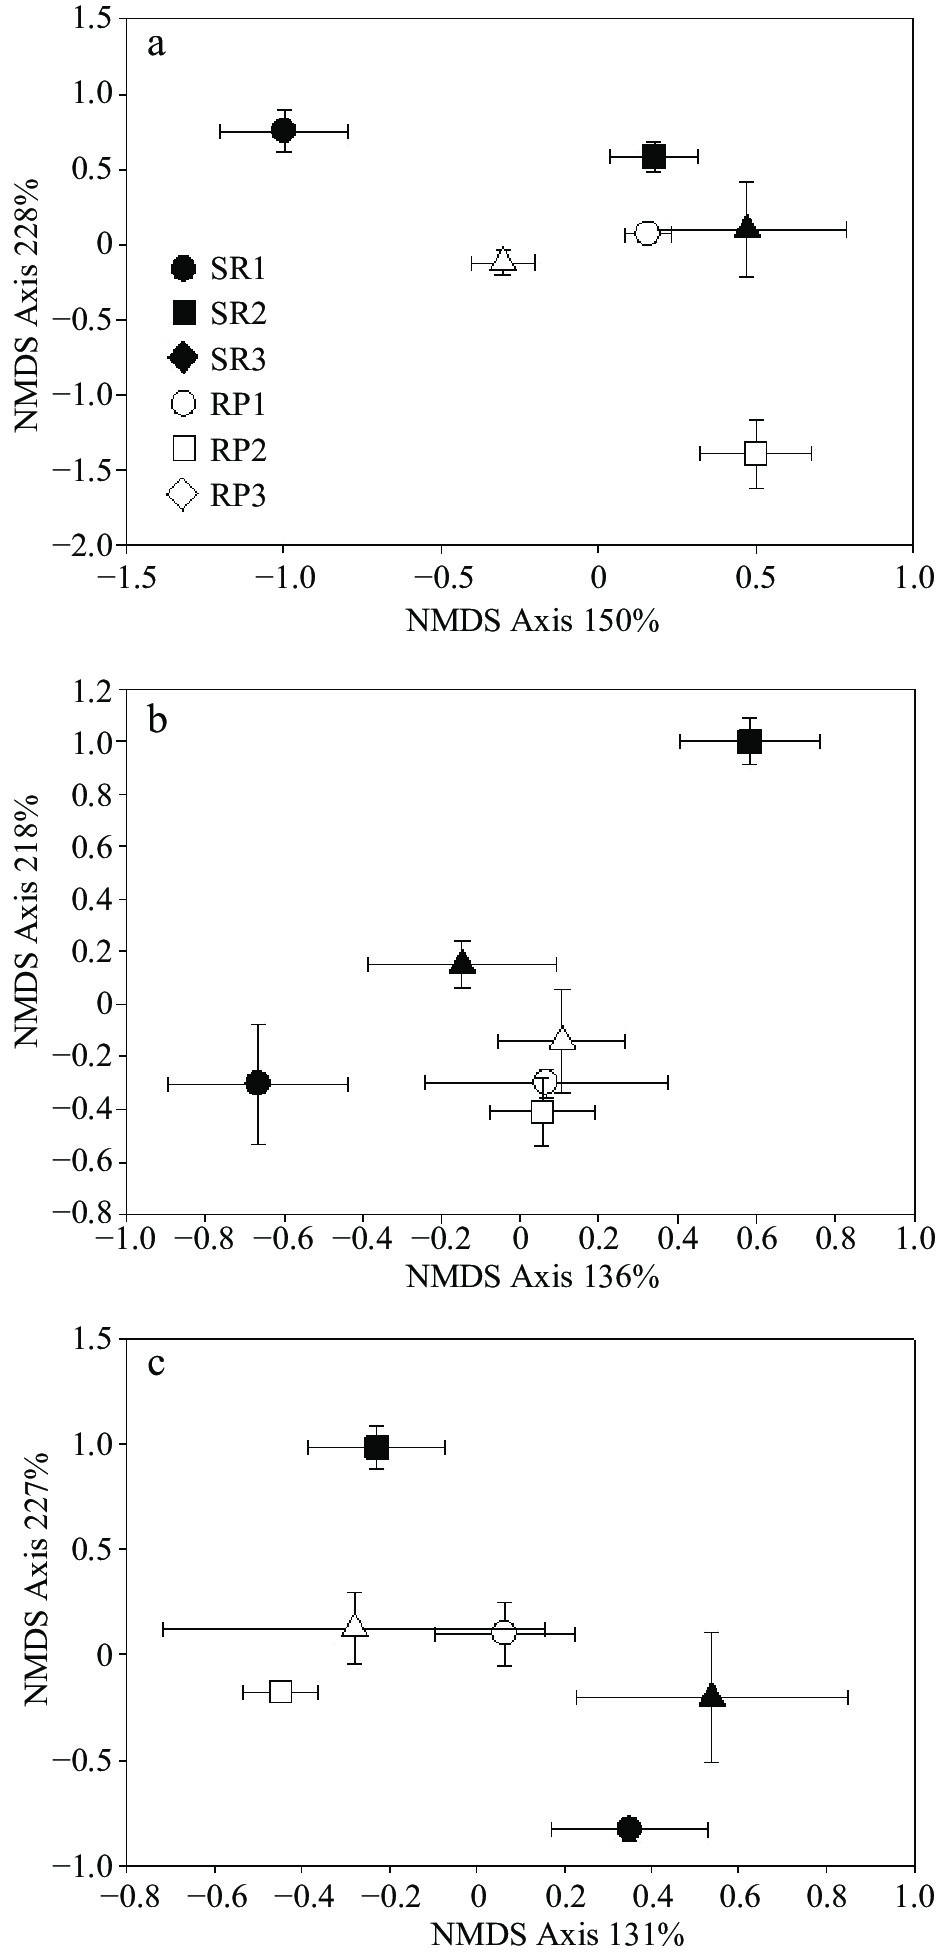
Figure 2.
NMDS analysis of (a) bacterial, (b) fungal and (c) Basidiomycota community. The empty and solid points indicate rubber plantation and rainforest samples. Circle, square and triangle indicate paired rubber plantation vs. rainforest (replicated locations 1, 2, 3).
-
SR RP Organic C (g kg−1) 26.4 ± 1.2* 19.9 ± 1.5 Organic N (g kg−1) 2.4 ± 0.1 1.6 ± 0.1 Inorganic N (mg kg−1) 9.1 ± 0.6 7.1 ± 0.7 C/N 11.0 ± 0.3 12.4 ± 0.3* PH 5.8 ± 0.1* 4.7 ± 0.1 Soil aggregate
distribution> 2 mm 59.0 64.2* 0.25−2 mm 12.3* 6.8 0.25−0.053 mm 11.9* 7.0 < 0.053 mm 16.7 22.0* LOC (g kg−1) 1.4 ± 0.1* 0.9 ± 0.1 MBC (g kg−1) 0.9 ± 0.1* 0.6 ± 0.1 Litter dry weight (kg ha−1) 3,000−5,000 5,000−7,000 * indicated p < 0.05. Table 1.
The soil characteristics of seasonal rainforests (SR) and rubber plantations (RP) of Southwest China.
-
Bacteria Fungi Basidiomycota SR1 vs. RP1 * ** NS. SR2 vs. RP2 ** ** NS. SR3 vs. RP3 * NS. ** SR1 vs. RP2 * ** ** SR1 vs. RP3 NS. * * SR2 vs. RP1 ** * NS. SR2 vs. RP3 * * * SR3 vs. RP1 * * NS. SR3 vs. RP2 NS. * NS. SR1 vs. SR2 * NS. NS. SR2 vs. SR3 * * * SR3 vs. SR1 * NS. * RP1 vs. RP2 * * NS. RP1 vs. RP3 * * ** RP2 vs. RP3 * * * * Indicated p < 0.1; ** indicated p < 0.5; *** indicated p < 0.01. Table 2.
Pairwise comparison of microbial communities between seasonal rain forest (SR) and rubber plantation (RP), or among the sample forest type.
-
Bacteria Fungi Basidiomycota Effect of SR-to-RP 1.917** 1.882** 0.930 Effect of Site 2.918** 1.744** 1.425 Effect of SR-to-RP* site 2.640** 1.922** 1.111 * Indicated p < 0.1; ** indicated p < 0.5; *** indicated p < 0.01. Table 3.
CCA analysis of microbial communities between seasonal rain forest (SR) and rubber plantation (RP), or among the sample forest type.
Figures
(2)
Tables
(3)