-
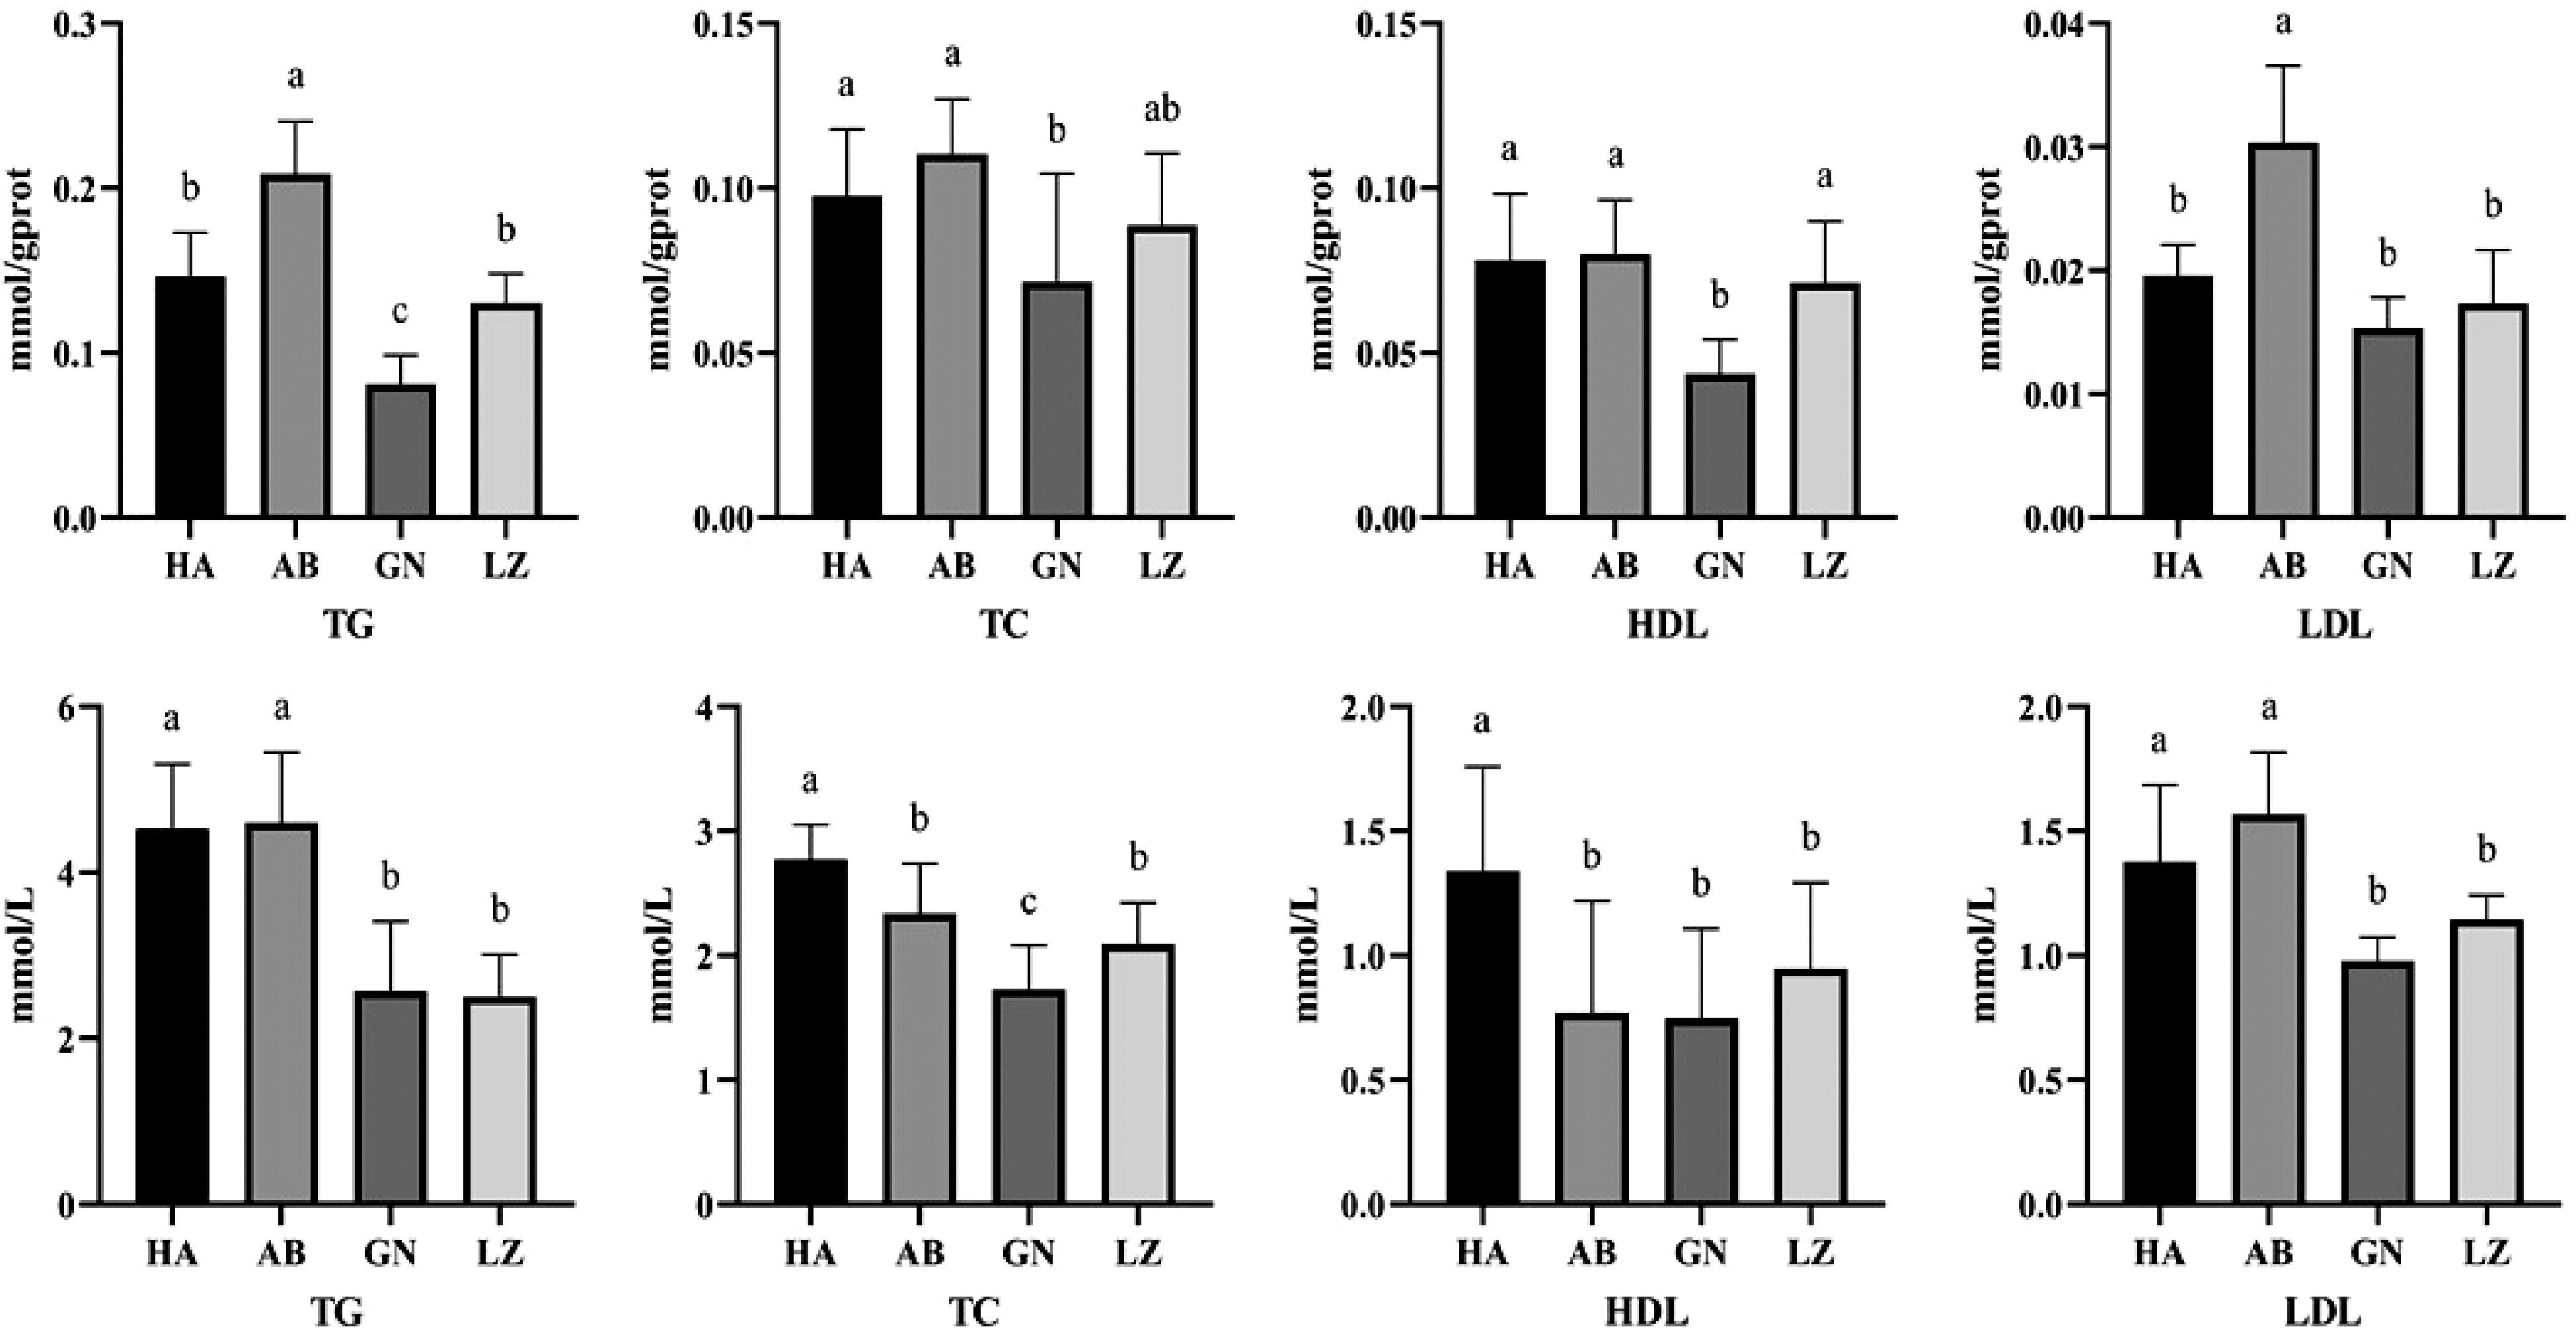
Figure 1.
Differences of liver (up) and serum (down) lipid metabolism between Duroc × Landrace × Yorkshire and Tibetan pigs. GN: Gannan Tibetan pigs; AB: Aba Tibetan pigs; LZ: Nyingchi Tibetan pigs; HA: Duroc × Landrace × Yorkshire pigs. Data are expressed as means ± SD. a, b and c indicate significant differences between different kinds of pigs (P < 0.05).
-
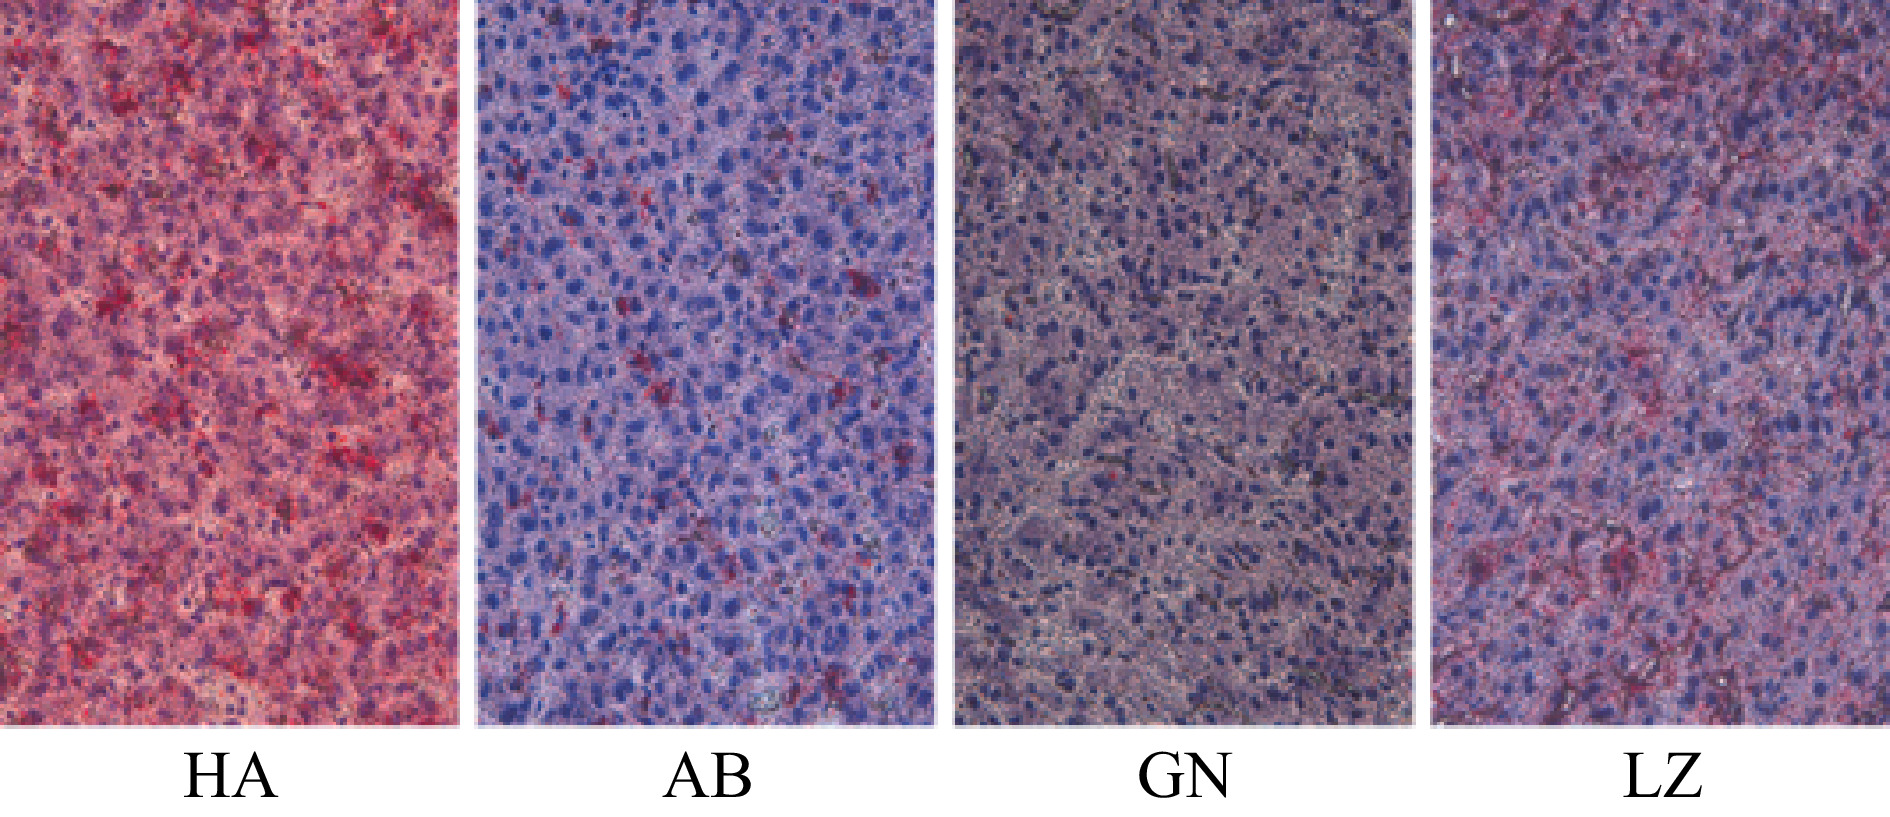
Figure 2.
Comparison of liver fat distribution of pigs from different regions. To observe slices under a light microscope, the multiple of the eyepiece is 10× and the multiple of the objective lens is 40×. The fat is stained bright red and the nucleus is stained dark blue. GN: Gannan Tibetan pigs; AB: Aba Tibetan pigs; LZ: Nyingchi Tibetan pigs; HA: Duroc × Landrace × Yorkshire pigs.
-
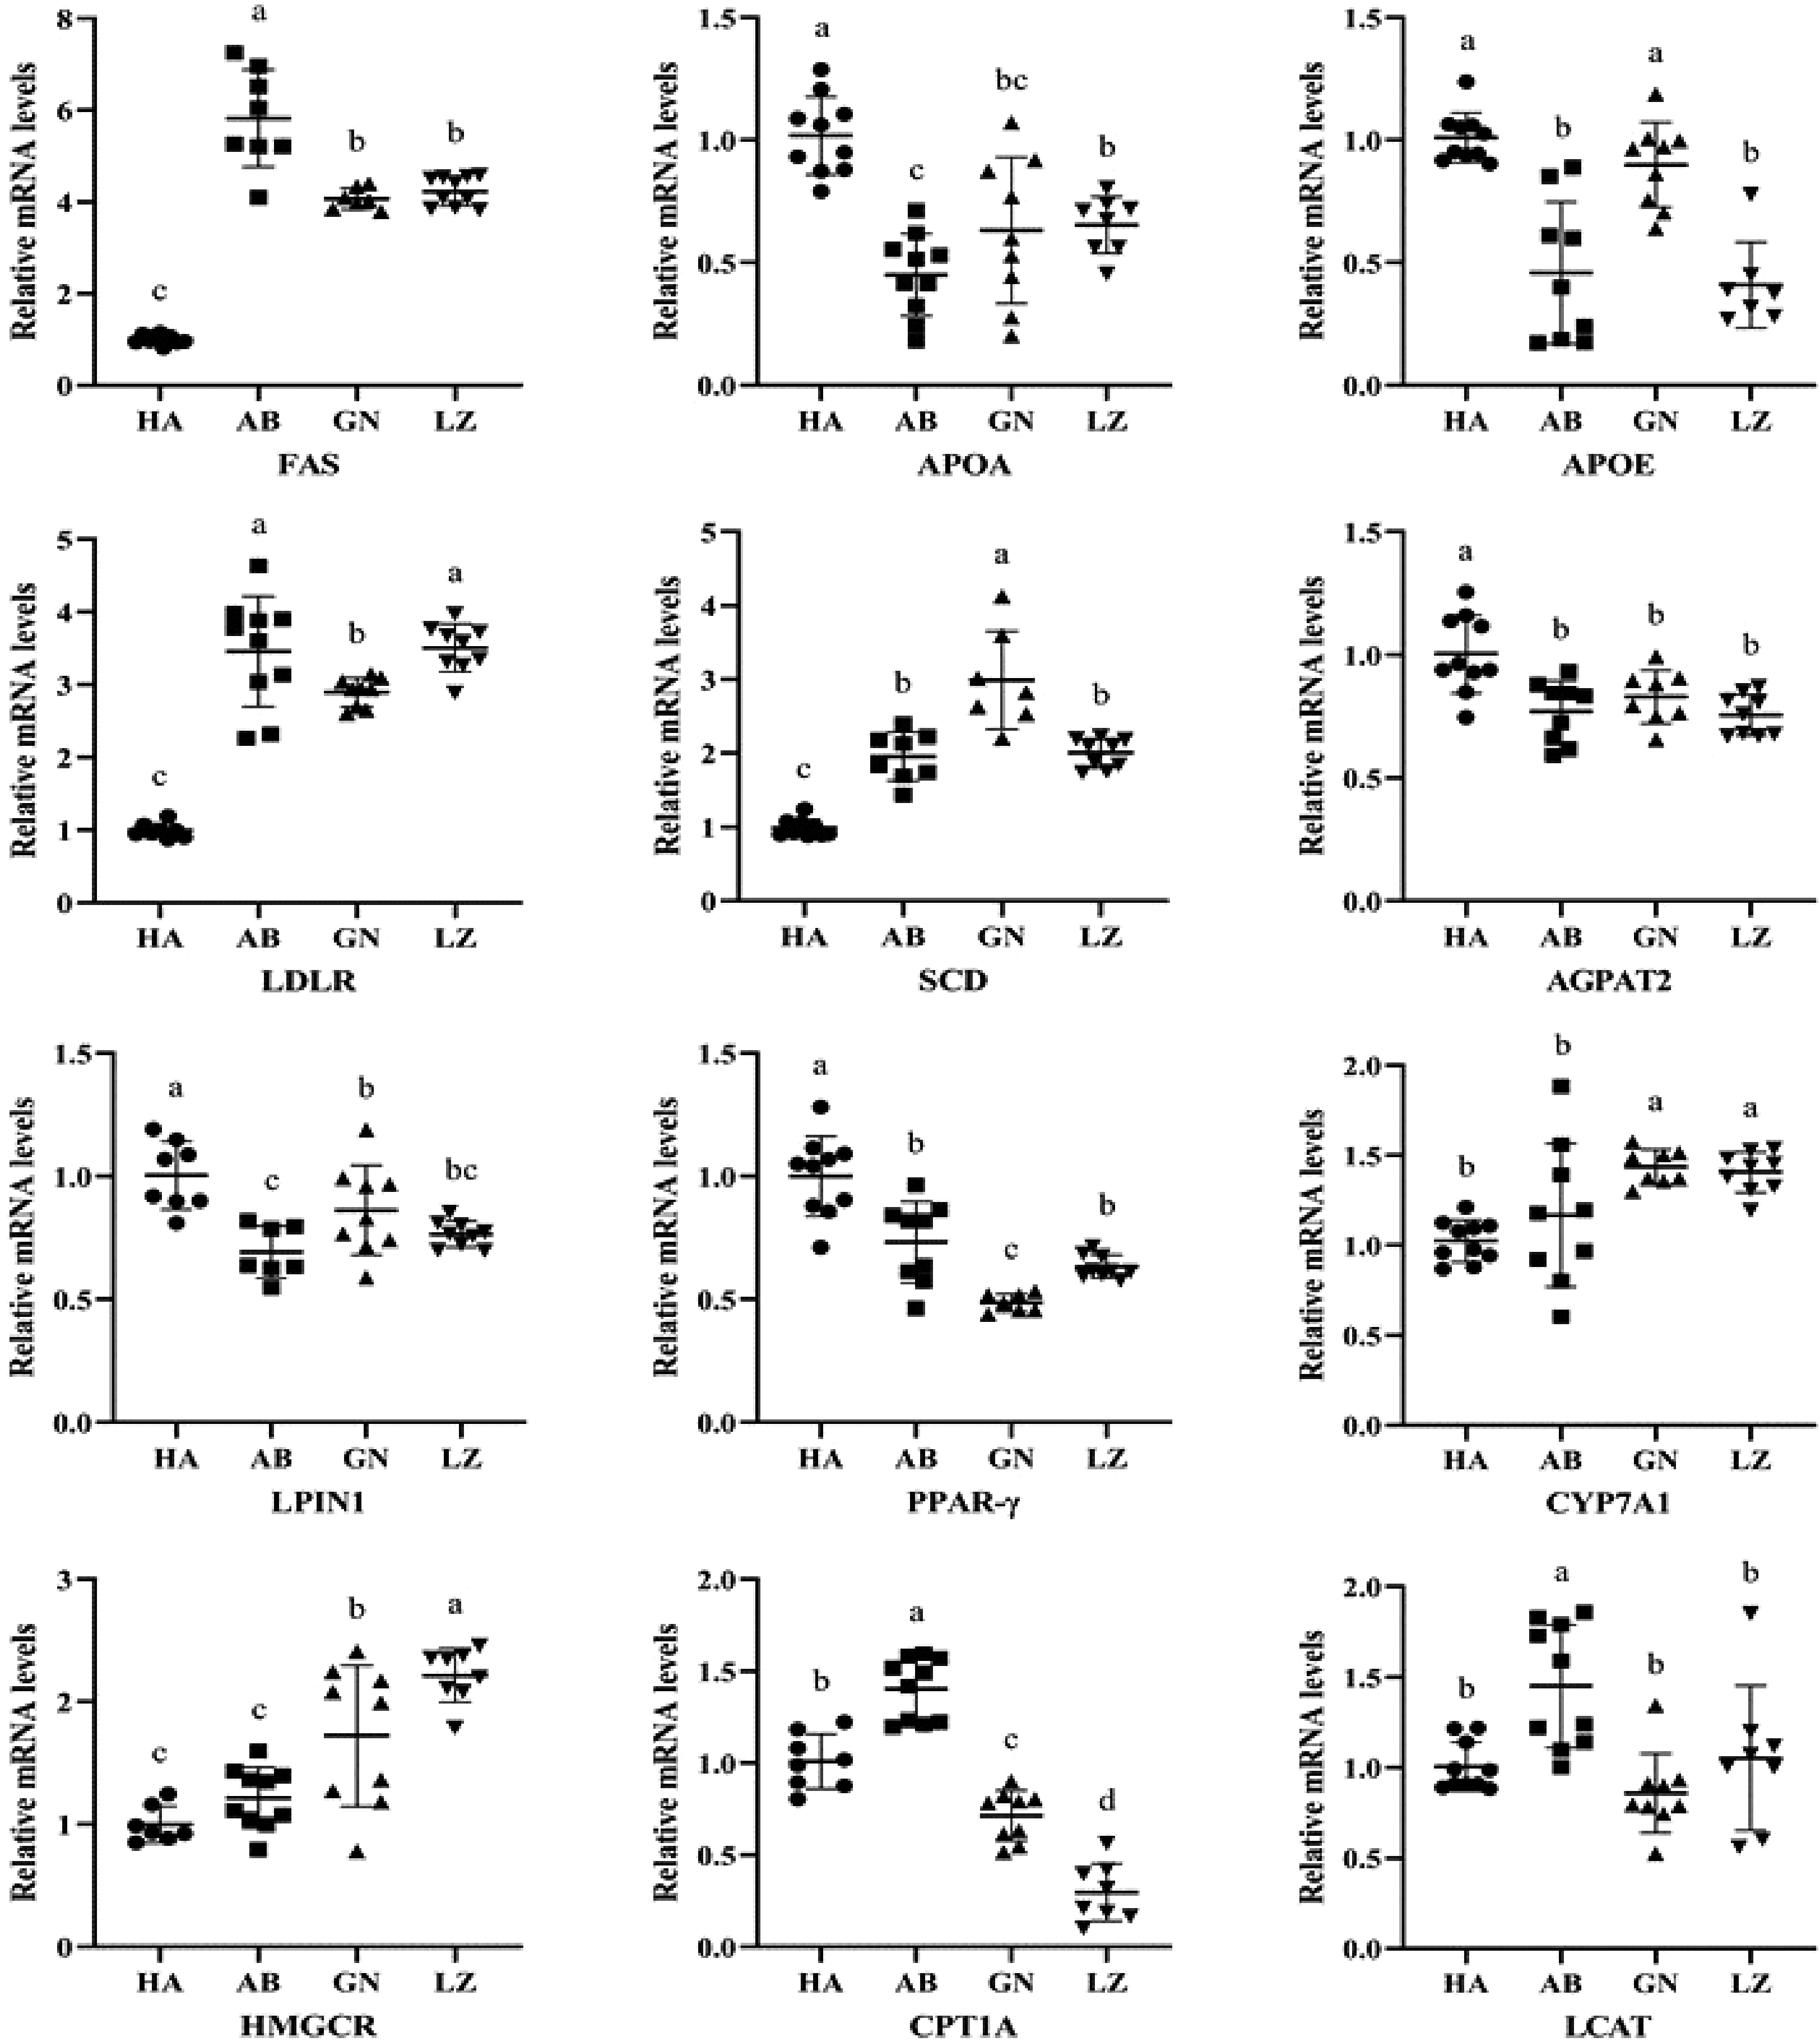
Figure 3.
Lipid metabolites mRNA expression related genes in liver of Tibetan and Duroc × Landrace × Yorkshire pigs. GN: Gannan Tibetan pigs; AB: Aba Tibetan pigs; LZ: Nyingchi Tibetan pigs; HA: Duroc × Landrace × Yorkshire pigs. Data were presented as the fold change in gene expression normalized to GADPH and relative to HA groups. Data are expressed as means ± SD. a, b and c indicate significant differences between different kinds of pigs (P < 0.05).
-
Gene Forward primer Reverse primer FAS 5'> TGGGCATGGTGAACTGTCTC<3' 5'>GTCACTGCACCACTTGAGTC<3' APOE 5'>CCAATCGCAAGCCAGAAGAT<3' 5'>CATCCTGCGAGGAGGGTTAC<3' APOA1 5'>CTGGGATCGGGTGAAGGATT<3' 5'>AAAGCGGAGGCTTCAAACTG<3' LDLR 5'>CCGGCAGGAAGAACACTTTC<3' 5'>CTGACAGACAAGCAGATGGC<3' SCD 5'>CCAGCACTAGTCTACGCTCA<3' 5'>CCCAGGGATGAGACTTCAGG<3' AGPAT2 5'>GAACGGTGGAGAACATGAGC<3' 5'>ATGCTCTGGTGGTTGGAGAT<3' LPIN1 5'>GGGAGACAATGGAGAGGCAT<3' 5'>CCGATCCAGGGAGTTCCTTT<3' PPAR-γ 5'>CCTGAGAAAGCCCTTTGGTG<3' 5'>GGCGGTCTCCACTGAGAATA<3' CYP7A1 5'>TGTTCAAGACGGGCCACTAT<3' 5'>GAGCGACTTGGCTTTCTCTG<3' HMGCR 5'>AAACCCTTGGTGGCAGAAAC<3' 5'>TTCTTCATTAGGCCGAGGCT<3' CPT1A 5'>TGCAGGATACAGCTCCTCTG<3' 5'>CCAGCACATCTGCACTCAAA<3' LCAT 5'>GAGCTCAGTAACCACACACG<3' 5'>GCTTGGCTTCCAGCTGATTC<3' GAPDH 5'>TGGAAAGGCCATCACCATCT<3' 5'>ATGGTCGTGAAGACACCAGT<3' Table 1.
Primer sequences used in quantitative RT-qPCR analyses.
-
Duroc × Landrace × Yorkshire pigs Aba Tibetan pigs Gannan Tibetan pigs Nyingchi Tibetan pigs SOD (U/mgprot) 197.8 ± 4.47a 198.7 ± 6.82a 202.5 ± 6.23a 206.0 ± 8.19a T-AOC (mmol/gprot) 0.587 ± 0.04a 0.529 ± 0.07ab 0.537 ± 0.06ab 0.488 ± 0.06b MDA (nmol/mg) 2.01 ± 0.15c 2.45 ± 0.21a 2.18 ± 0.17b 2.22 ± 0.19b CAT (U/mgprot) 198.0 ± 11.22b 221.9 ± 7.66a 211.3 ± 10.53ab 225.6 ± 6.07a Notes: The data are presented as means ± SD. The significance level is set at 0.05. a, b and c superscripts indicate significant differences between the different kinds of pigs in the same row (P < 0.05). SOD: superoxide dismutase; T-AOC: total antioxidant capacity; MDA: malondialdehyde; CAT: catalase. Table 2.
Liver antioxidant status in different kinds of pigs.
-
Duroc × Landrace × Yorkshire pigs Aba Tibetan pigs Gannan Tibetan pigs Nyingchi Tibetan pigs IMF/% 0.97 ± 0.56b 2.83 ± 0.80a 2.79 ± 0.87a 2.15 ± 0.79a liver fat/% 2.03 ± 0.35a 2.21 ± 0.33a 1.49 ± 0.29b 2.19 ± 0.33a Notes: The data are presented as means ± SD. The significance level is set at 0.05. a and b superscripts indicate significant differences between the different kinds of pigs in the same row (P < 0.05). IMF: intramuscular fat. Table 3.
Comparison of IMF and liver fat content in pigs from different regions.
-
Fatty acid composition Duroc × Landrace × Yorkshire pigs Aba Tibetan pigs Gannan Tibetan pigs Nyingchi Tibetan pigs Octanoic acids C8:0 0.01 ± 0.00b 0.12 ± 0.07a 0.02 ± 0.01b − Decanoic acid C10:0 0.12 ± 0.02a 0.12 ± 0.02a 0.07 ± 0.01b 0.10 ± 0.01ab Lauric acid C12:0 0.10 ± 0.01a 0.08 ± 0.01a 0.09 ± 0.02a 0.09 ± 0.01a Myristic acid C14:0 1.57 ± 0.03a 1.36 ± 0.05a 1.36 ± 0.29a 1.55 ± 0.22a Pentadecanoic acid C15:0 0.04 ± 0.01b 0.04 ± 0.01b 0.11 ± 0.06a 0.07 ± 0.02b Palmitic acid C16:0 26.67 ± 0.48a 24.96 ± 1.39a 22.46 ± 2.21b 25.36 ± 1.49a Heptadecanoic acid C17:0 0.20 ± 0.01b 0.23 ± 0.03b 0.40 ± 0.15a 0.32 ± 0.07ab Stearic acid C18:0 13.94 ± 0.10a 11.72 ± 0.25b 12.14 ± 0.37b 11.99 ± 0.84b Arachidic acid C20:0 0.21 ± 0.02b 0.21 ± 0.02b 0.31 ± 0.05a 0.25 ± 0.04b Behenic acid C22:0 0.02 ± 0.00b 0.12 ± 0.07a 0.08 ± 0.01ab − Tetracosanoic acid C24:0 − − 0.17 ± 0.09b 0.42 ± 0.14a Saturated Fatty acid (SFA) 42.87 ± 0.51a 38.96 ± 1.22b 37.20 ± 3.19b 40.13 ± 1.89ab 9-Tetradecenoic acid C14:1 0.02 ± 0.01a 0.03 ± 0.01a 0.03 ± 0.00a 0.03 ± 0.01a 15-Tetracosenoic acid C16:1 2.45 ± 0.31b 3.85 ± 0.44a 2.10 ± 0.60b 3.75 ± 0.64a 10-Heptadecenoic acid C17:1 0.30 ± 0.18a 0.36 ± 0.18a 0.46 ± 0.15a 0.50 ± 0.21a Elaidic acid C18:1n9t − 0.20 ± 0.07b 1.20 ± 0.09a 1.36 ± 0.71a Oleic acid C18:1n9c 35.48 ± 0.13b 41.33 ± 1.72a 35.50 ± 2.70b 38.76 ± 3.82ab Eicosanoic acid C20:1 0.64 ± 0.01b 0.81 ± 0.04b 1.25 ± 0.21a 0.66 ± 0.13b Erucic acid C22:1n9 − − 0.18 ± 0.09 − Monounsaturated Fatty Acids (MUFA) 38.89 ± 0.75b 46.58 ± 1.47a 40.73 ± 2.37b 45.08 ± 3.78a Linoelaidic acid C18:2n6t 0.05 ± 0.01 − − − Linoleic acid C18:2n6c 15.27 ± 1.01a 11.13 ± 0.89b 17.06 ± 2.25a 10.93 ± 3.09b 11,14-Eicosadienoicacid C20:2 0.59 ± 0.06b 0.41 ± 0.03b 0.58 ± 0.11b 0.30 ± 0.08b Linolenic acid C18:3n3 0.90 ± 0.18b 0.57 ± 0.23b 2.21 ± 0.47a 1.94 ± 0.40a 11,14,17-Eicosatrienoicacid C20:3n6 0.16 ± 0.06a 0.24 ± 0.05a 0.23 ± 0.05a 0.20 ± 0.07a 8,11,14-Eicosatrienoicacid C20:3n3 0.11 ± 0.02b − 0.27 ± 0.05a 0.22 ± 0.04a Arachidonic acid C20:4n6AA 1.06 ± 0.45a 2.01 ± 0.35a 1.60 ± 0.59a 1.30 ± 0.64a 4,7,10,13,16,19-Docosahexaenoicacid C22:6n3DHA 0.02 ± 0.00c 0.17 ± 0.03a 0.17 ± 0.08a 0.09 ± 0.04b Polyunsaturated Fatty acids (PUFA) 18.19 ± 1.15ab 14.53 ± 0.76b 22.12 ± 2.68a 14.98 ± 4.22b SFA/UFA 0.75 ± 0.01a 0.64 ± 0.03b 0.59 ± 0.08b 0.67 ± 0.05ab PUFA/SFA 0.42 ± 0.03b 0.37 ± 0.02b 0.60 ± 0.11a 0.38 ± 0.12b Notes: The data are presented as means ± SD. The significance level is set at 0.05. a and b superscripts indicate significant differences between pork from different regions in the same row (P < 0.05). Table 4.
Fatty acid composition of longissimus dorsimuscle in different kinds of pigs.
Figures
(3)
Tables
(4)