-
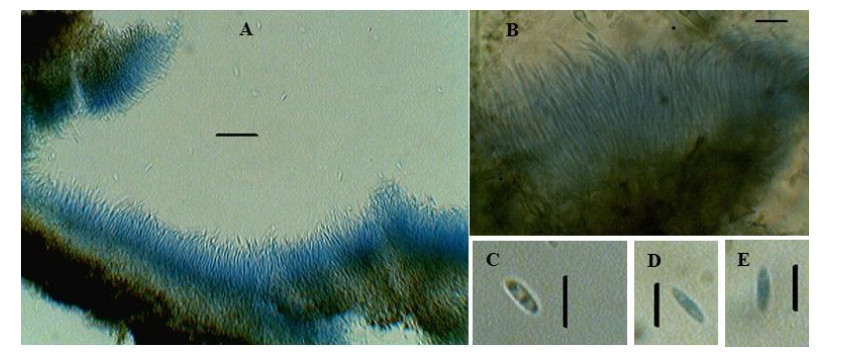
Figure 1. Diaporthe phaseolorum. A, B Conidiophore bearing conidia. C, D, E Conidia. Scale Bars: A–B = 20 μm, C–D = 10 μm.
-
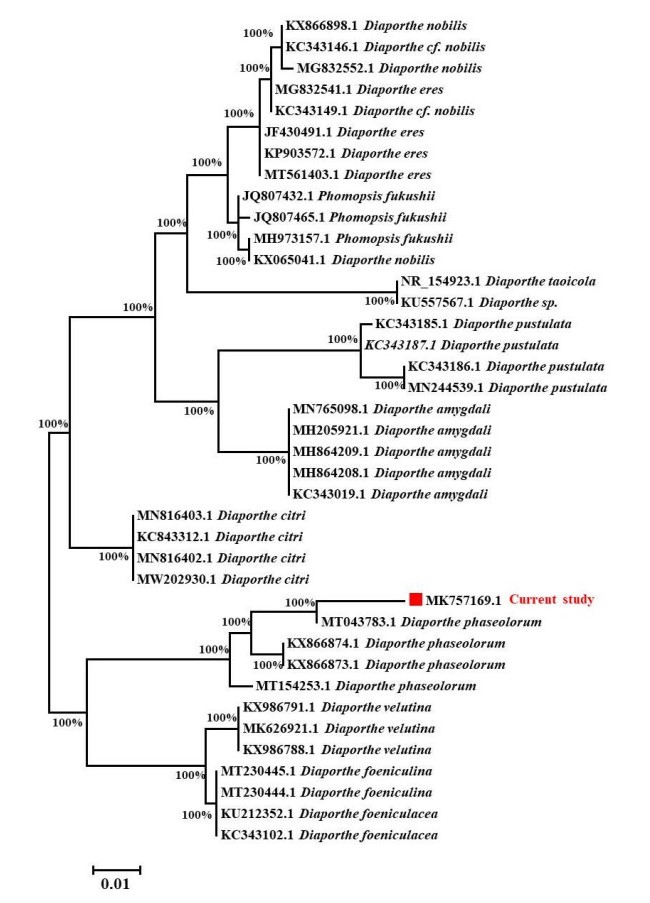
Figure 2. Phytogenic analysis of isolated fungus with its related species by comparing ITS gene sequences obtained from NCBI GenBank. The evolutionary history was deduced using the TamuraNei model and the Neighbor-Joining method with 1000 replications bootstrap. It is shown the Tree shows highest log likelihood (-1382.58). The branch lengths are measured in the number of substitutions per site, and the tree is depicted to scale. A total of 39 nucleotide sequences were examined. 1st+2nd+3rd+Noncoding codon locations were included. Gaps and missing data were removed from all positions. MEGA7 was used to conduct evolutionary analysis with bootstrap values higher than 50% is given in each branch.
-
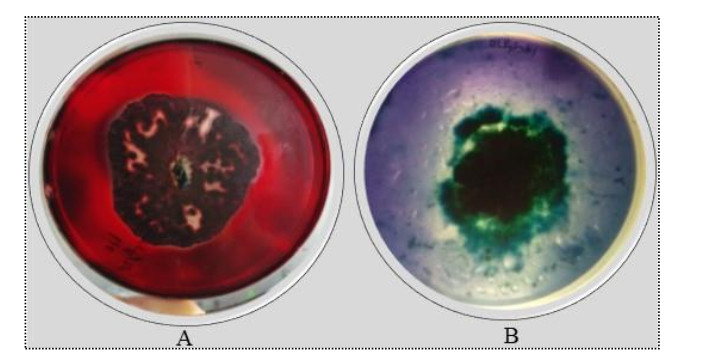
Figure 3. Qualitative screening of Diapothe phaseolorum for cellulolytic and ligninolytic enzymes. A cellulase activity. B ligninolytic enzymes activity.
-
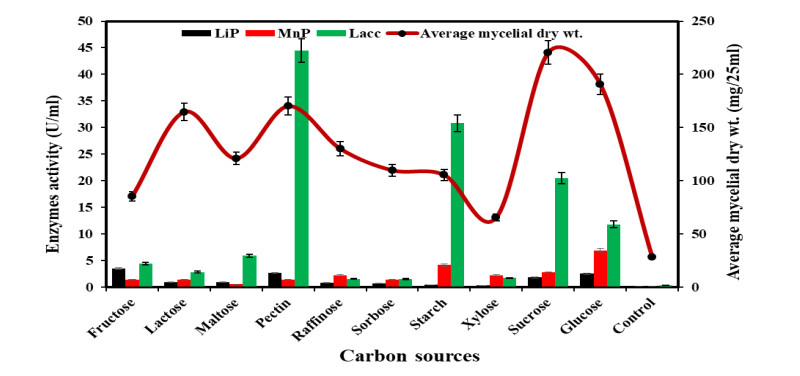
Figure 4. Growth and ligninolytic enzyme production by Diaporthe phaseolorum in different carbon compounds.
-
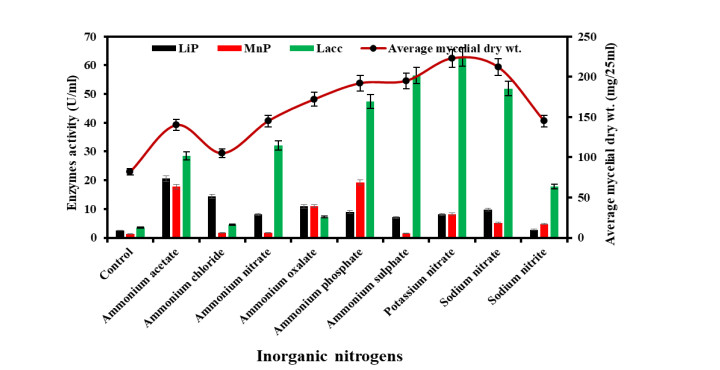
Figure 5. Growth and ligninolytic enzyme production by Diaporthe phaseolorum in different inorganic nitrogen compounds.
-
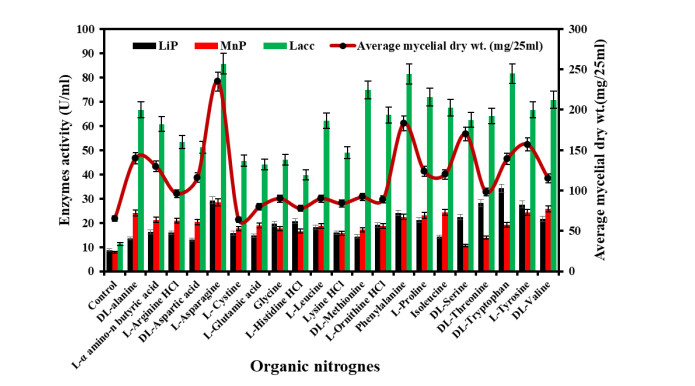
Figure 6. Growth and ligninolytic enzyme production by Diaporthe phaseolorum in different organic nitrogen compounds.
Figures
(6)
Tables
(0)