-

Figure 1.
Diversity profile curves constructed with observed data for both years of study. The Order q value of 0 is associated with species richness, a value of 1 indicates typical abundances and a value of 2 is related with dominant species.
-
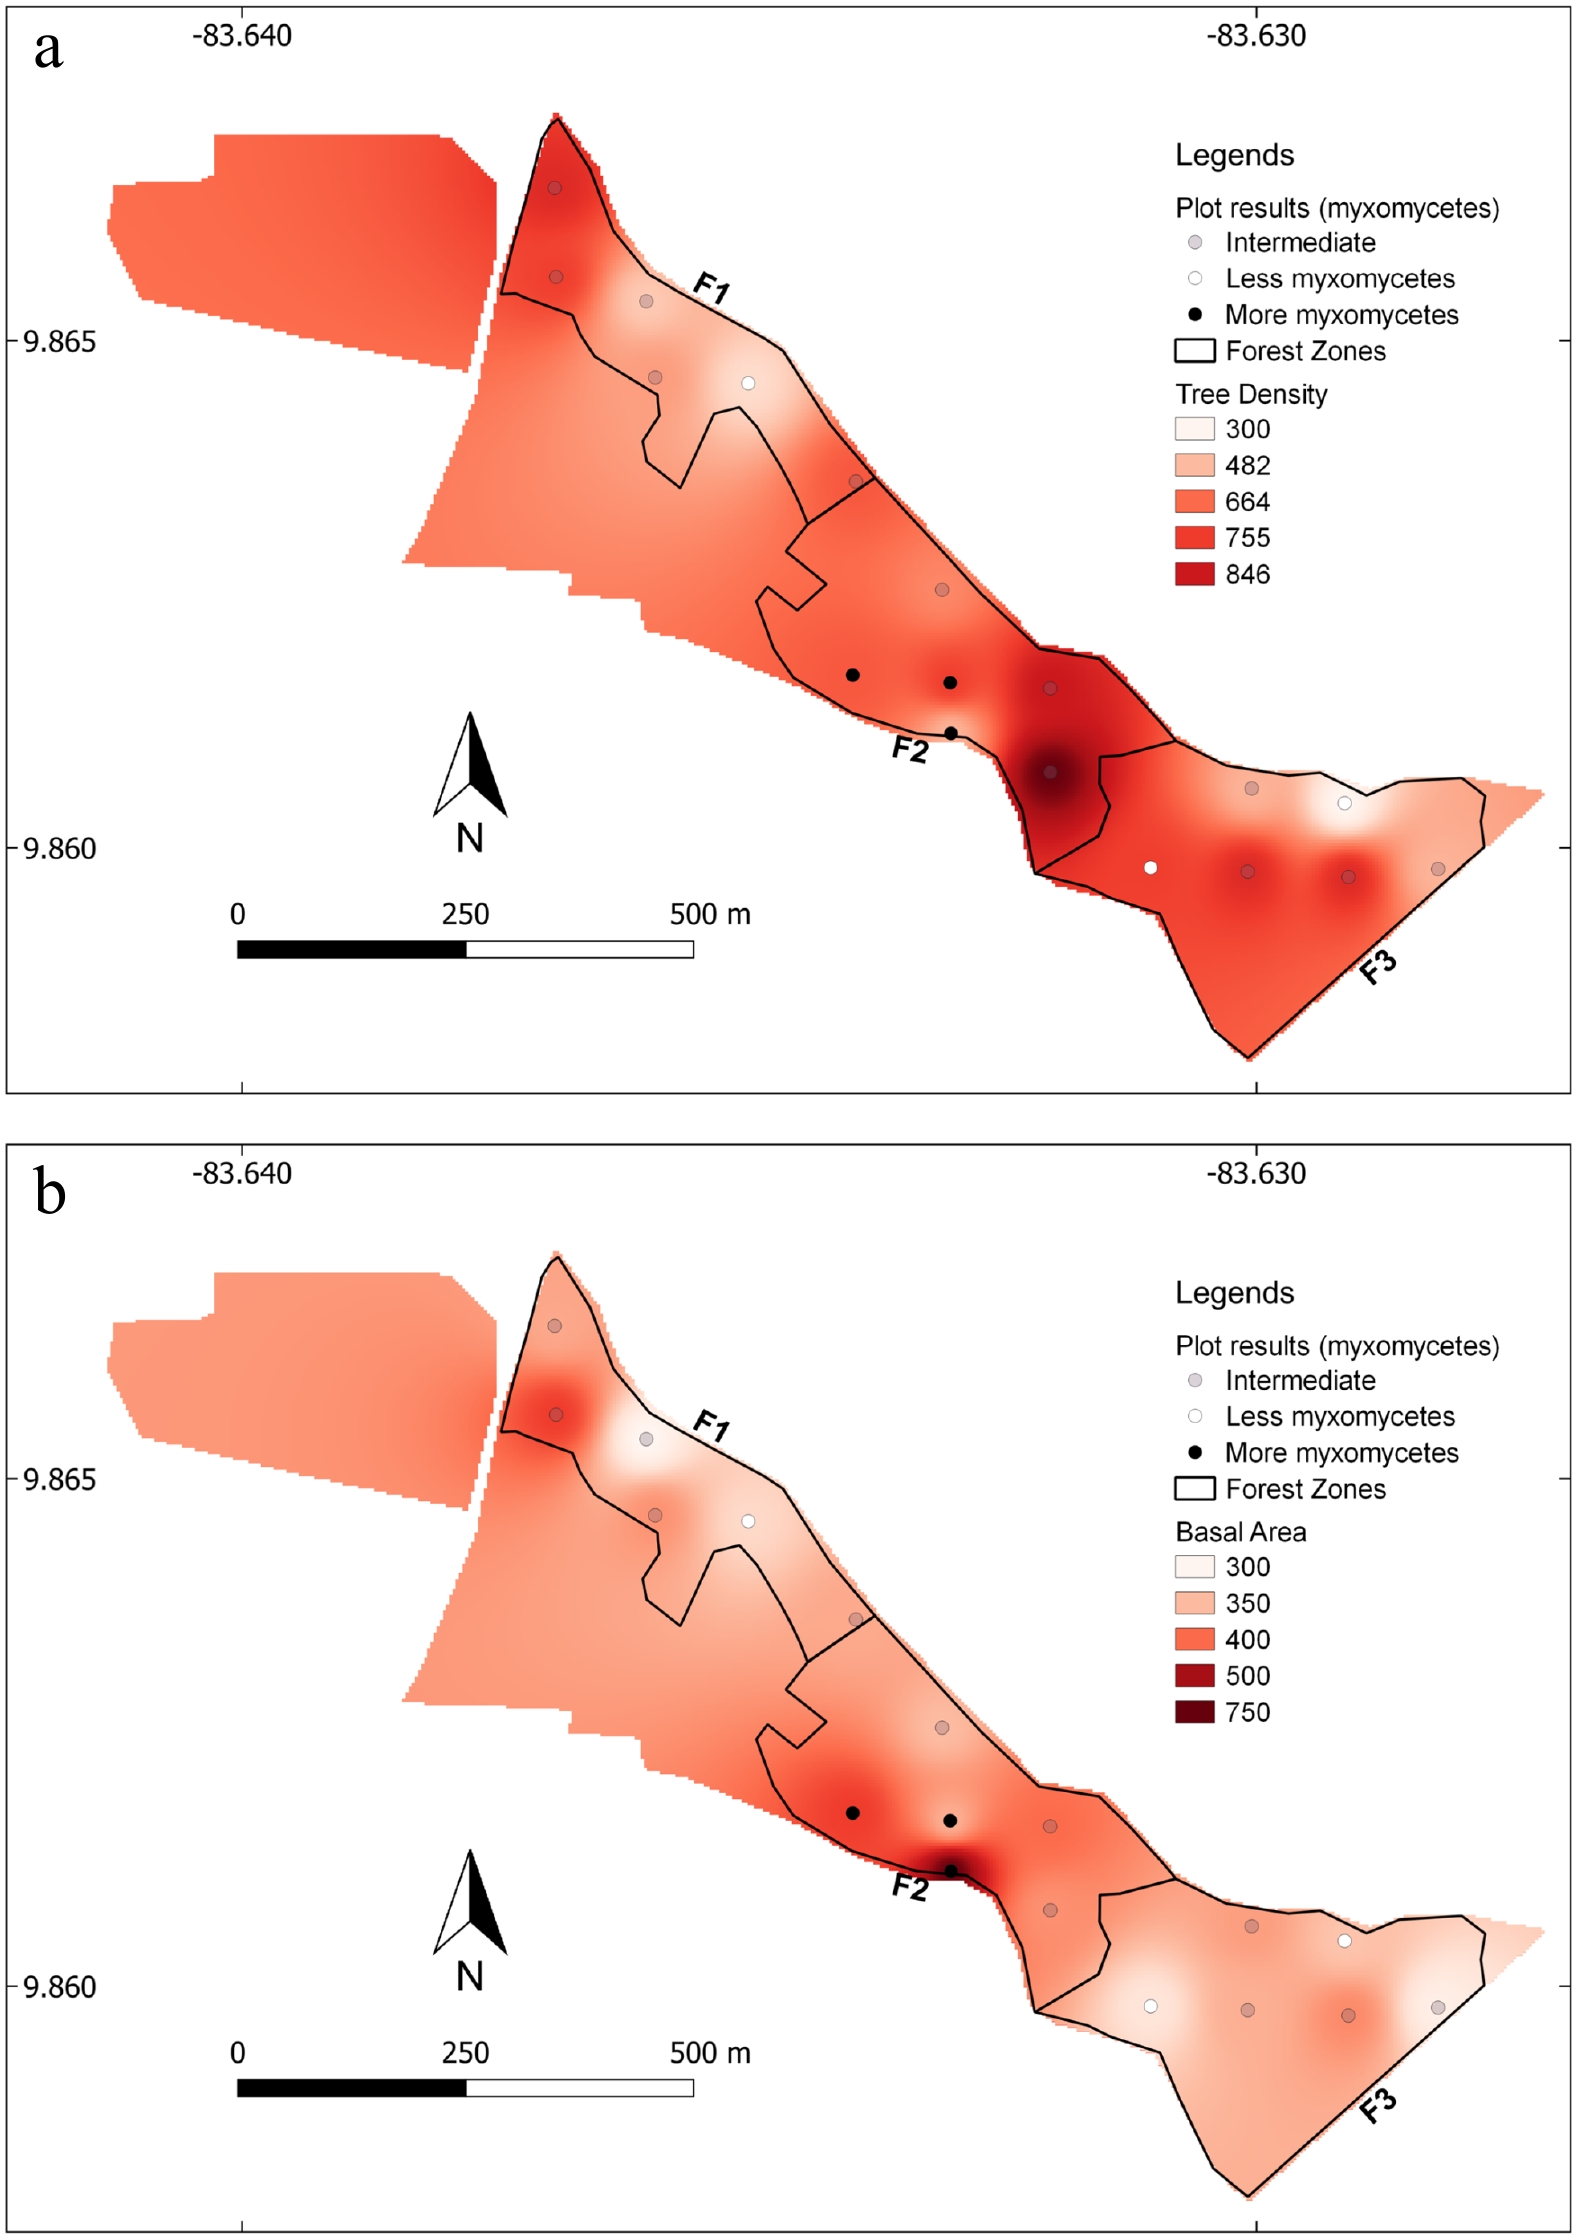
Figure 2.
Image of the studied forest sections showing the differences in tree density (a) count per hectare, and basal area (b) in m2 per hectare for the entire forest patch and the position of the studied locations arranged in terms of integrated results from both years of study (both species richness and diversity).
-

Figure 3.
Arrangement of studied locations based on the most important functional characteristics of the forest. (a) Scatterplot based on the two most important principal components showing the richest (red diamonds) and poorest (green diamonds) locations during the first year. (b) Scatterplot of the locations studied during both years based on tree diameter and the normalized number of records. (c) Scatterplot based on leaf litter depth and normalized effort.
-
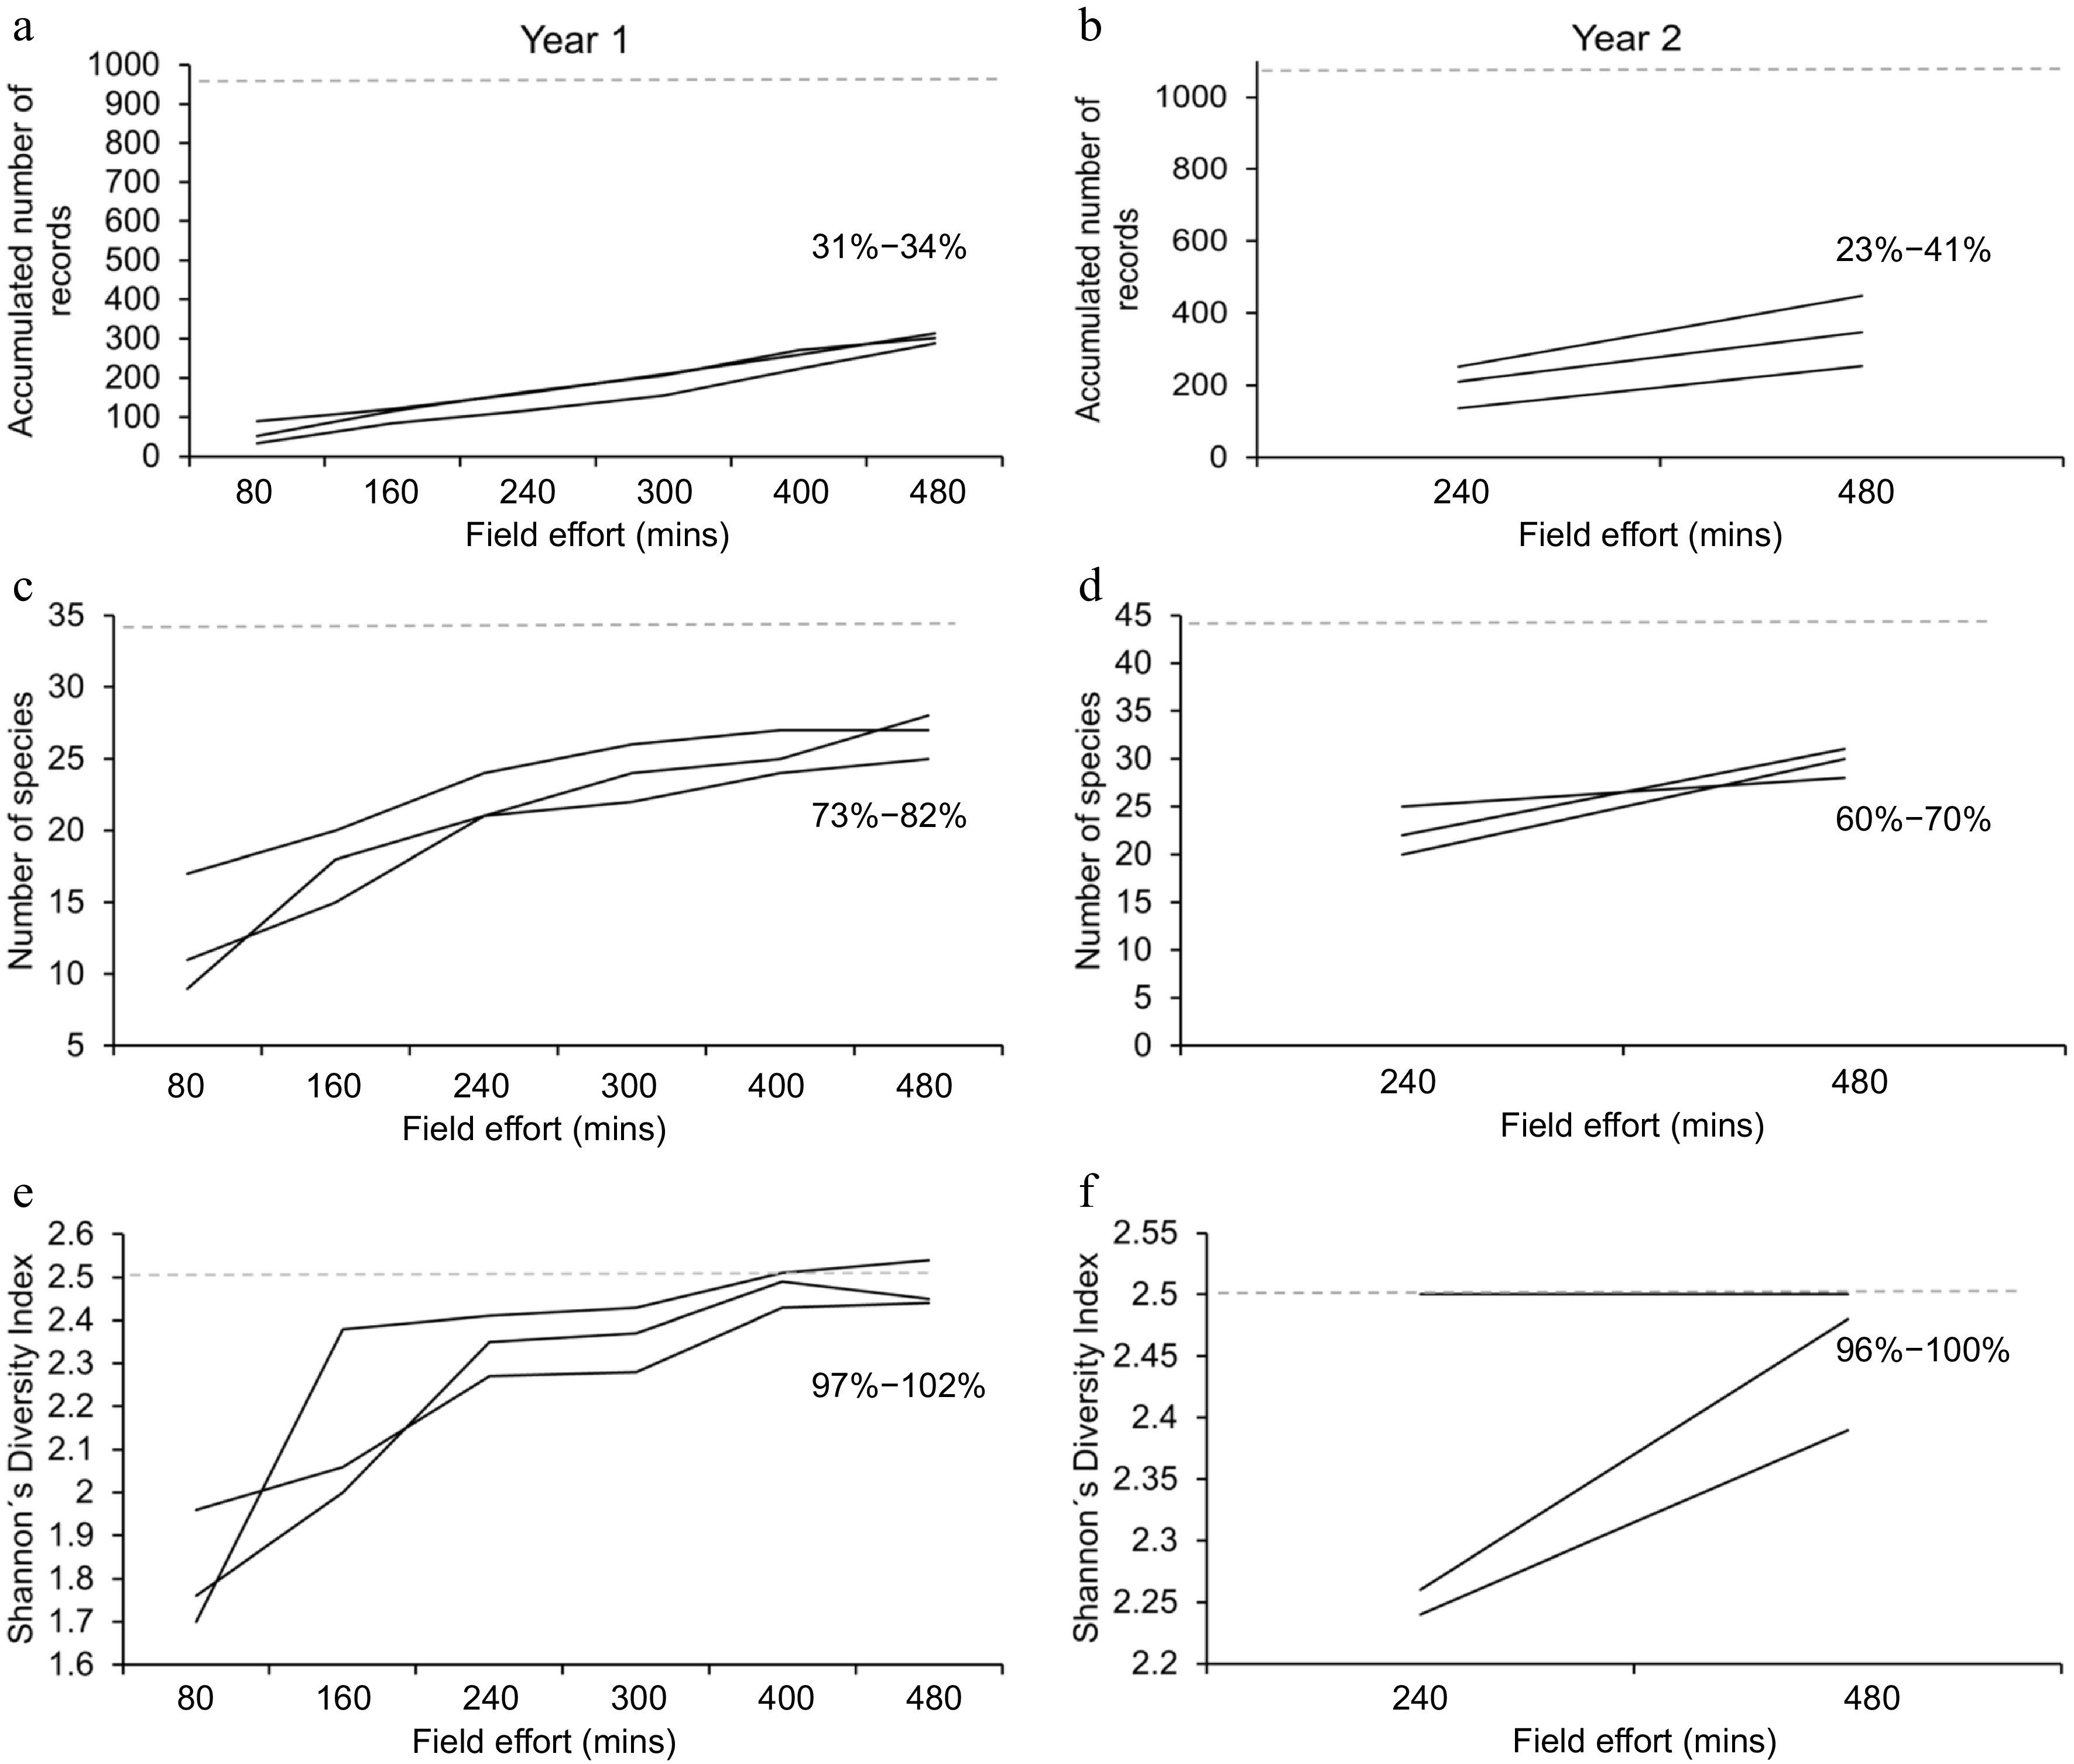
Figure 4.
Results of the simulations carried out with data from one third of the yearly effort. (a), (c) and (e) show the accumulated number of records, the number of species and the Shannon's Diversity Index for the first year, where location rotation took place. (b), (d) and (f) show the same results for the second year, where locations were sampled systematically. In each case, the three black lines represent each one of the three simulations and the dotted line represents the value observed at the end of one complete year of field work. The range of completeness for the set of simulations is shown in percentages.
-
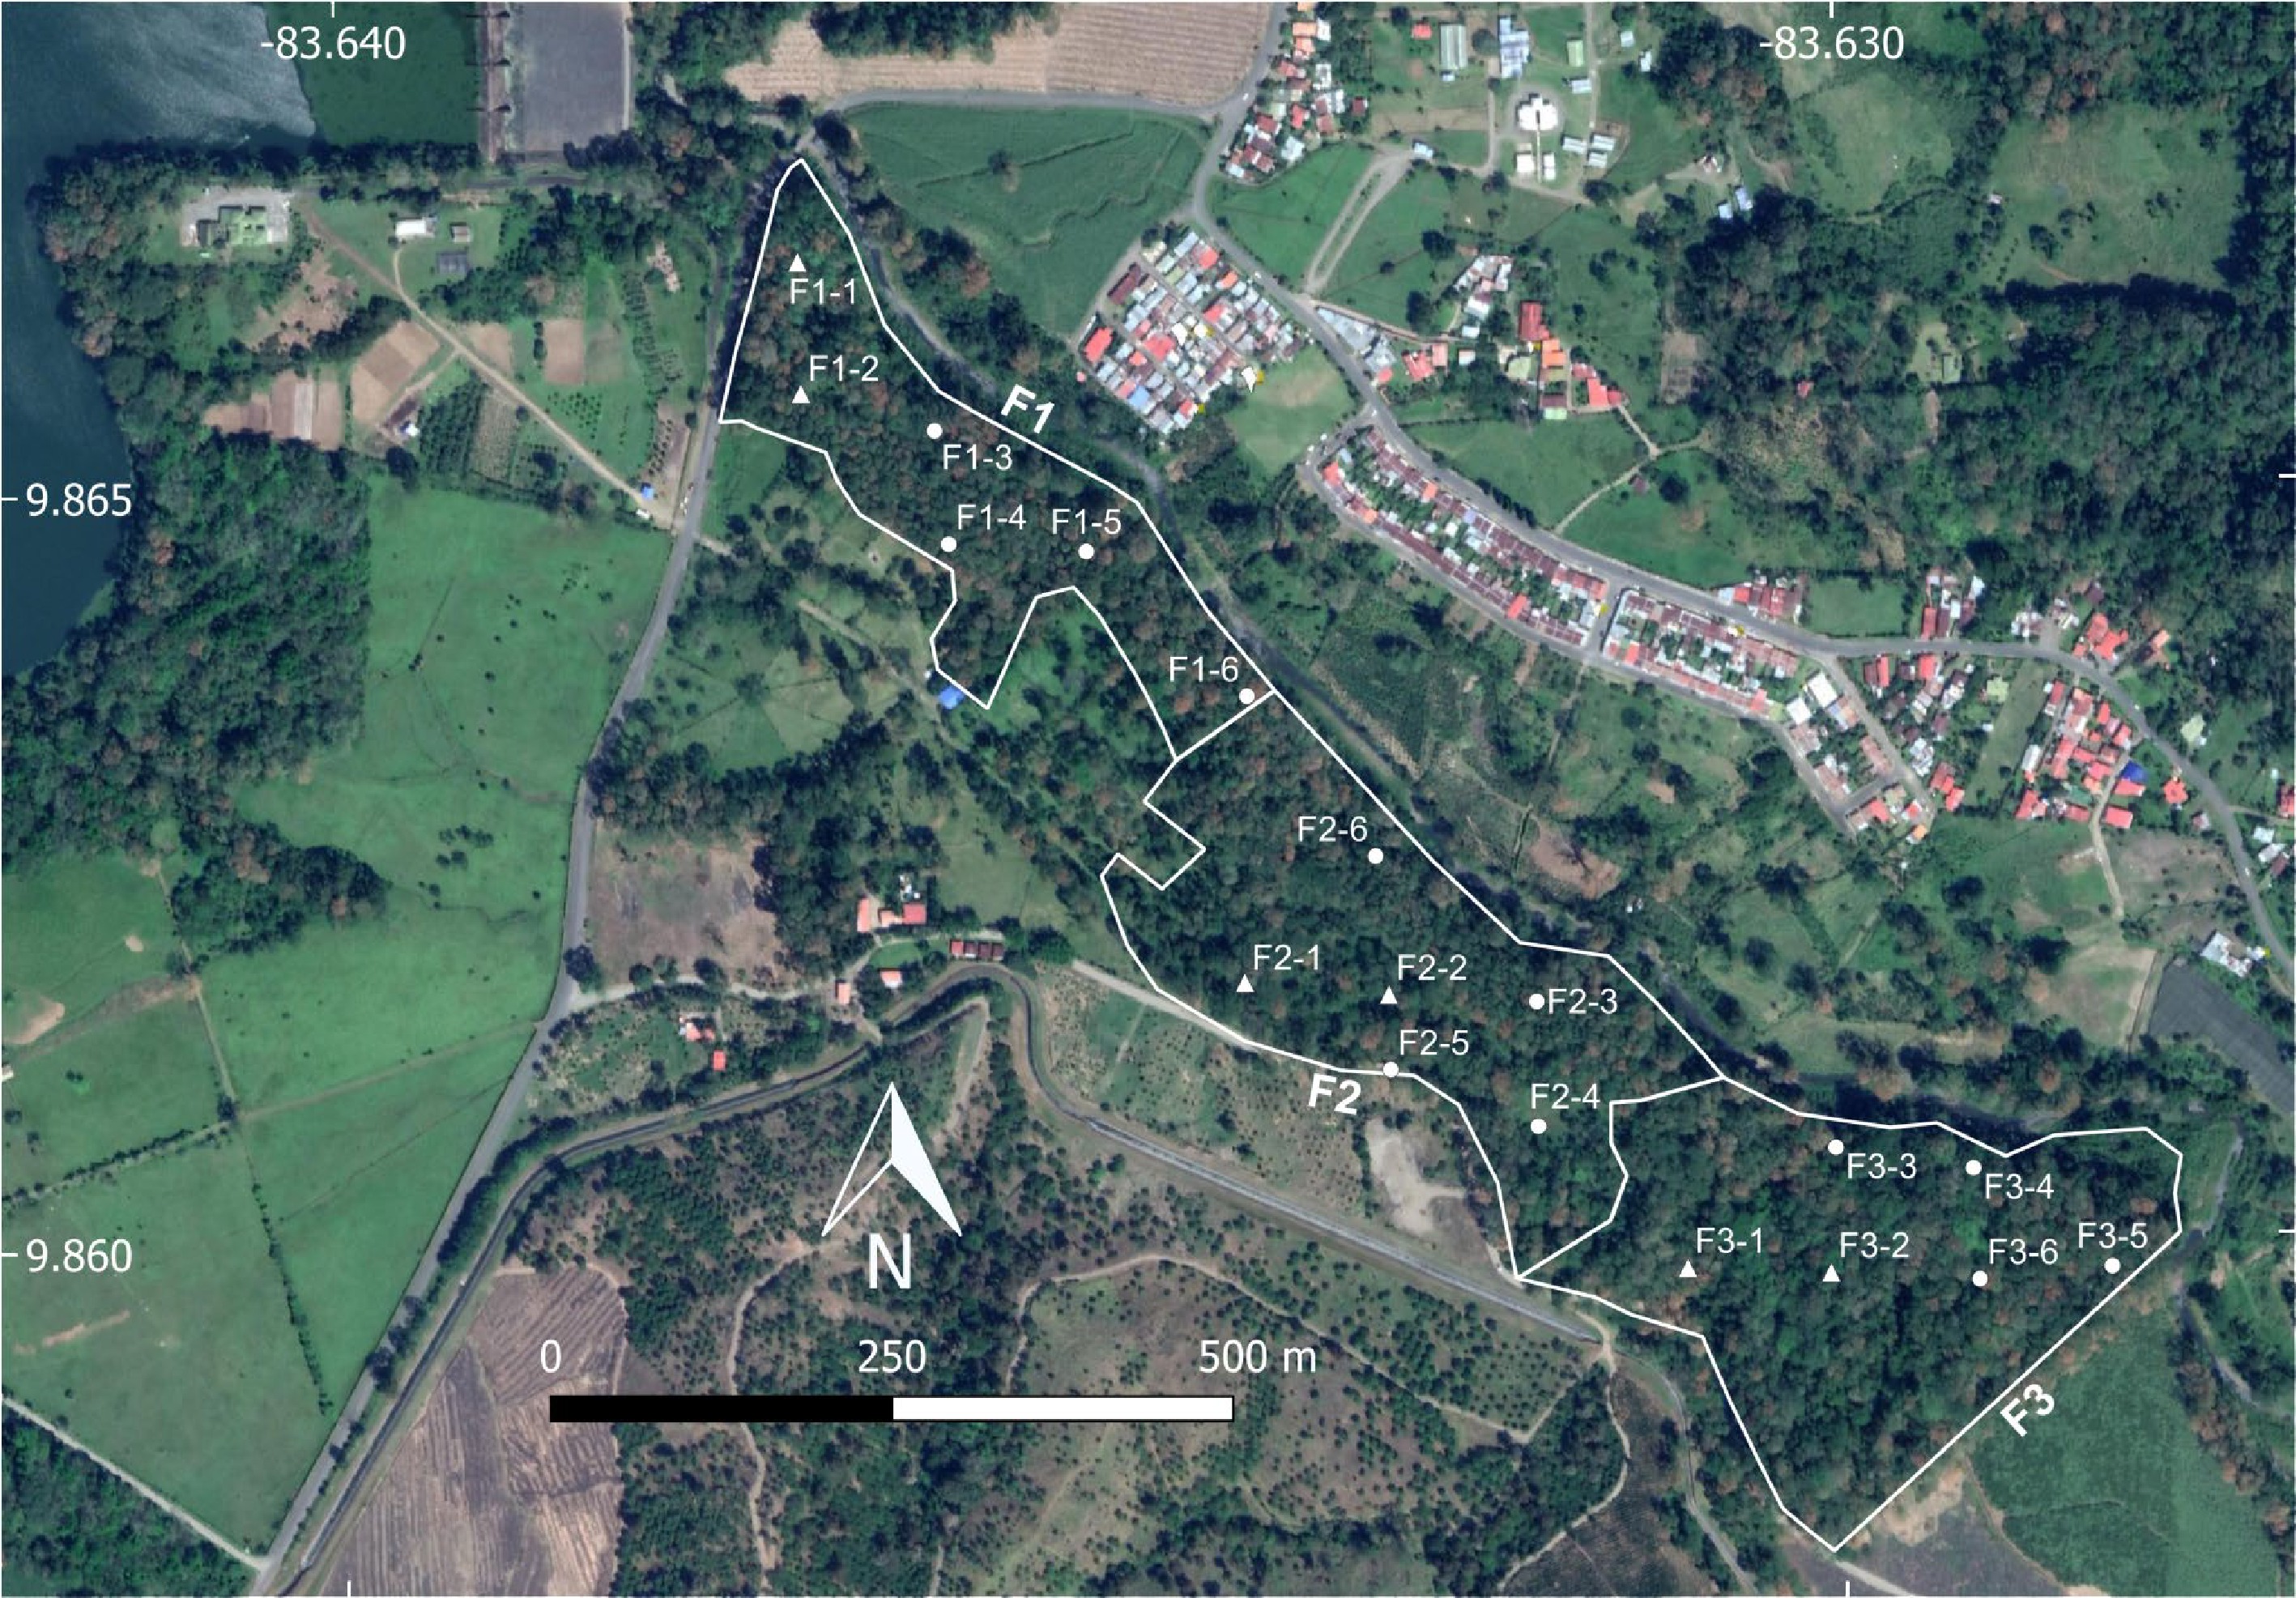
Figure 5.
Aerial view of the studied forested patch divided into the three sections mentioned in the section 'Materials and Methods' (F1, F2 and F3) showing the 18 collection locations used during the first year of study (triangles and circles) and the six used during the second year (triangles only) with their respective codes for identification. The rotation of locations carried out during the first year took place within each forest section.
-
Species / ecological indicators First year (rotating locations) Second year (fixed locations) Total F1 F2 F3 F1 F2 F3 Arcyria cinerea (Bull.) Pers. 30 46 23 22 33 32 186 Arcyria denudata (L.) Wettst. 7 11 14 19 30 24 105 Arcyria incarnata (Pers. ex J.F. Gmel.) Pers. 1 1 Arcyria insignis Kalchbr. & Cooke 1 2 3 Ceratiomyxa fruticulosa (O.F. Müll.) T. Macbr. 25 20 15 66 60 30 216 Clastoderma debaryanum A. Blytt 1 1 Comatricha nigra (Pers. ex J.F. Gmel.) J. Schröt. 1 1 3 5 Comatricha tenerrima (M.A. Curtis) G. Lister 2 4 2 5 1 1 15 Craterium aureum (Schumach.) Rostaf. 1 1 Craterium leucocephalum (Pers. ex J.F. Gmel.) Ditmar 2 2 Cribraria cancellata (Batsch) Nann.-Bremek. 1 6 1 5 5 7 25 Cribraria intricata Schrad. 7 2 1 8 3 8 29 Cribraria tenella Schrad. 5 2 3 5 9 3 27 Cribraria vulgaris Schrad. 1 1 Diderma hemisphaericum (Bull.) Hornem. 5 1 2 8 Didymium bahiense Gottsb. 9 8 10 9 6 9 51 Didymium clavus (Alb. & Schwein.) Rabenh. 2 6 2 1 11 Didymium difforme (Pers.) Gray 3 3 Didymium dubium Rostaf. 1 1 Didymium minus (Lister) Morgan 4 2 1 7 Didymium squamulosum (Alb. & Schwein.) Fr. & Palmquist 2 6 10 17 5 2 42 Fuligo septica (L.) F.H. Wigg. 1 1 Hemitrichia calyculata (Speg.) M.L. Farr 70 70 98 100 113 140 591 Hemitrichia serpula (Scop.) Rostaf. ex Lister 5 1 4 1 11 Lamproderma scintillans (Berk. & Broome) Morgan 1 3 1 5 5 15 Lycogala conicum Pers. 2 2 Lycogala epidendrum (L.) Fr. 3 4 5 22 24 14 72 Lycogala exiguum Morgan 1 1 2 Metatrichia vesparia (Batsch) Nann.-Bremek. ex G.W. Martin & Alexop. 3 3 Perichaena depressa Lib. 1 1 Physarella oblonga (Berk. & M.A. Curtis) Morgan 1 1 Physarum album (Bull.) Chevall. 3 19 2 6 10 3 43 Physarum bogoriense Racib. 1 3 4 Physarum compressum Alb. & Schwein. 15 13 12 20 7 55 122 Physarum didermoides (Pers.) Rostaf. 12 8 4 4 9 8 45 Physarum galbeum Wingate 2 2 Physarum globuliferum (Bull.) Pers. 1 1 Physarum javanicum Racib. 1 7 5 13 Physarum melleum (Berk. & Broome) Massee 2 1 3 Physarum pusillum (Berk. & M.A. Curtis) G. Lister 2 3 1 1 1 8 Physarum stellatum (Massee) G.W. Martin 1 1 Physarum tenerum Rex 3 3 Physarum viride (Bull.) Pers. 2 6 6 1 4 19 Stemonitis axifera (Bull.) T. Macbr. 3 2 5 3 1 14 Stemonitis fusca Roth 8 10 2 13 16 7 56 Stemonitis splendens Rostaf. 1 1 Stemonitopsis aequalis (Peck) Y. Yamam. 57 84 62 2 2 2 209 Stemonitopsis hyperopta (Meyl.) Nann.-Bremek. 3 3 Tubifera microsperma (Berk. & M.A. Curtis) G.W. Martin 13 13 Trichia decipiens (Pers.) T. Macbr. 2 2 Trichia favoginea (Batsch) Pers. 1 1 Number of records 272 358 286 347 269 370 2002 Number of species 24 30 26 30 28 27 51 Simpson Diversity Index 0.85 0.87 0.81 0.87 0.88 0.85 0.87 Shannon Diversity Index 2.38 2.6 2.24 2.61 2.55 2.43 2.53 Chao 1 Maximum number of species 25 33 29 50 28 29 62 Table 1.
Complete list of myxomycetes species recorded in the present study arranged by year/ methodological approach and forest section as described in the section 'Materials and Methods'. Ecological summary metrics are provided at the bottom.
-
Location code Visits/year Average number of records/visit Total number of recorded species* Simpson's
Diversity IndexShannon's
Diversity IndexShannon's
Evenness IndexF1-1 Four (first year) 8.3 11 0.80 1.91 0.62 F1-2 Four (first year) 13.8 10 0.81 1.86 0.64 F1-3 Four (first year) 16.3 19 0.88 2.55 0.67 F1-4 Four (first year) 11.8 12 0.82 1.99 0.61 F1-5 Four (first year) 6.3 8 0.72 1.62 0.63 F1-6 Four (first year) 11.8 10 0.76 1.78 0.60 F2-1 Four (first year) 19.0 17 0.86 2.33 0.60 F2-2 Four (first year) 17.0 19 0.87 2.43 0.60 F2-3 Four (first year) 9.0 10 0.82 1.95 0.70 F2-4 Four (first year) 12.5 15 0.87 2.39 0.73 F2-5 Four (first year) 22.5 17 0.78 1.97 0.42 F2-6 Four (first year) 9.5 12 0.81 2.02 0.63 F3-1 Four (first year) 16.3 17 0.85 2.22 0.54 F3-2 Four (first year) 13.3 11 0.76 1.77 0.53 F3-3 Four (first year) 8.5 9 0.75 1.71 0.61 F3-4 Four (first year) 7.8 8 0.70 1.53 0.58 F3-5 Four (first year) 15.5 11 0.78 1.87 0.59 F3-6 Four (first year) 10.3 12 0.85 2.14 0.71 F1-1 Twelve (second year) 18.9 25 0.93 2.96 0.77 F1-2 Twelve (second year) 21.3 20 0.88 2.51 0.61 F2-1 Twelve (second year) 26.2 22 0.89 2.53 0.57 F2-2 Twelve (second year) 15.0 21 0.90 2.74 0.74 F3-1 Twelve (second year) 19.7 19 0.88 2.49 0.64 F3-2 Twelve (second year) 21.7 24 0.88 2.66 0.59 * This metric considered all species recorded in each location, independent of survey effort. Since the effort for the fixed locations during the second year represented three times the effort in the same locations during the first year, a higher number of species was naturally expected. As such, the values are comparable within each year, but not necessarily between years. Table 2.
Results of the surveys carried out in the present study arranged by location and methodological strategies used during the two years of investigation. The highest three values for each column are shown in bold.
-
Functional variable Forest section F1 F2 F3 Average tree diameter (cm) 125.2 123.1 101.9 Canopy height (m) 19.6 17.6 21.2 Canopy openness (%) 20.7 17.1 8.0 Tree horizontal distance (m) 7.1 4.6 6.9 Total basal area (m2/hectare) 522 765 449 Number of trees/hectare 608 733 608 Biomass (tons per hectare) 48.9 49.8 32.9 Soil carbon (tons per hectare) 24.0 24.4 16.1 Leaf litter depth (cm) 2.6 3.2 2.9 Number of records 619 727 656 Number of species 33 38 32 Simpson's Diversity Index 0.87 0.89 0.83 Shannon's Diversity Index 2.57 2.69 2.38 Table 3.
Quantification of the functional variables studied herein arranged by forest section and associated ecological metrics of the myxomycete assemblages recorded in them.
Figures
(5)
Tables
(3)