-
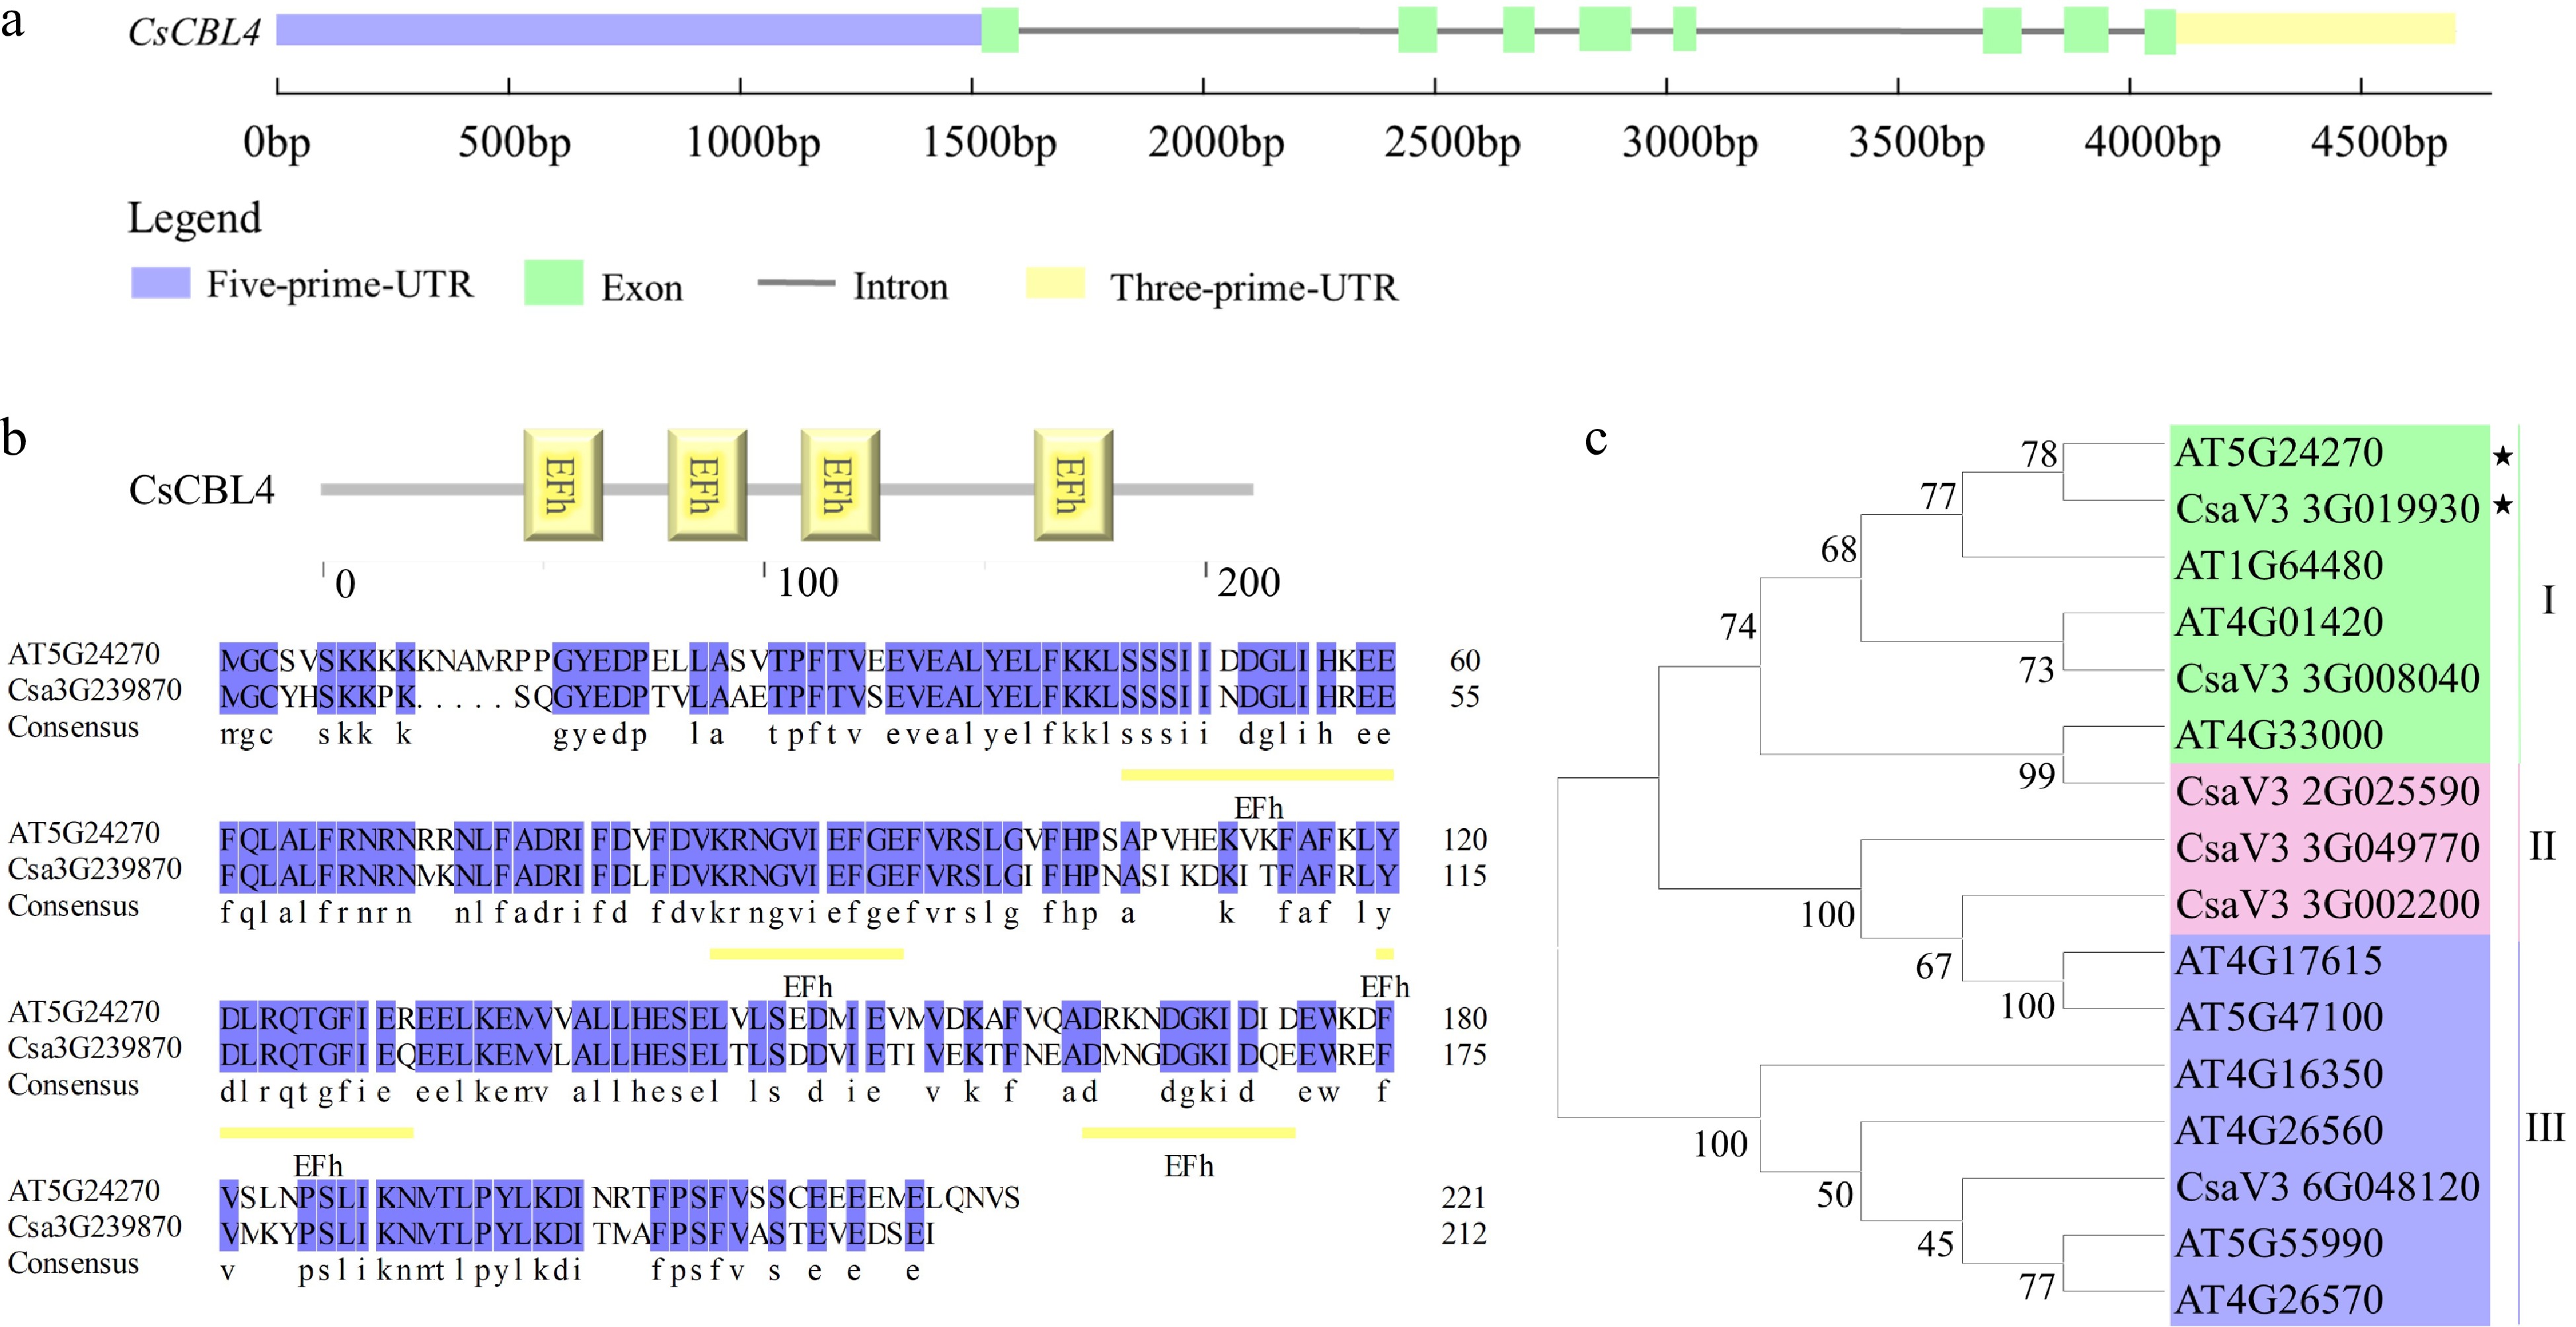
Figure 1.
Isolation and sequence analysis of CsCBL4. (a) The exon-intron structure of CsCBL4. (b) The EF-hand domains of CBL4 in Arabidopsis and cucumber. Yellow underlines indicated the position of domains. (c) The phylogenetic tree of CBLs in cucumber and Arabidopsis. * indicates CBL4 genes of Arabidopsis and cucumber respectively.
-
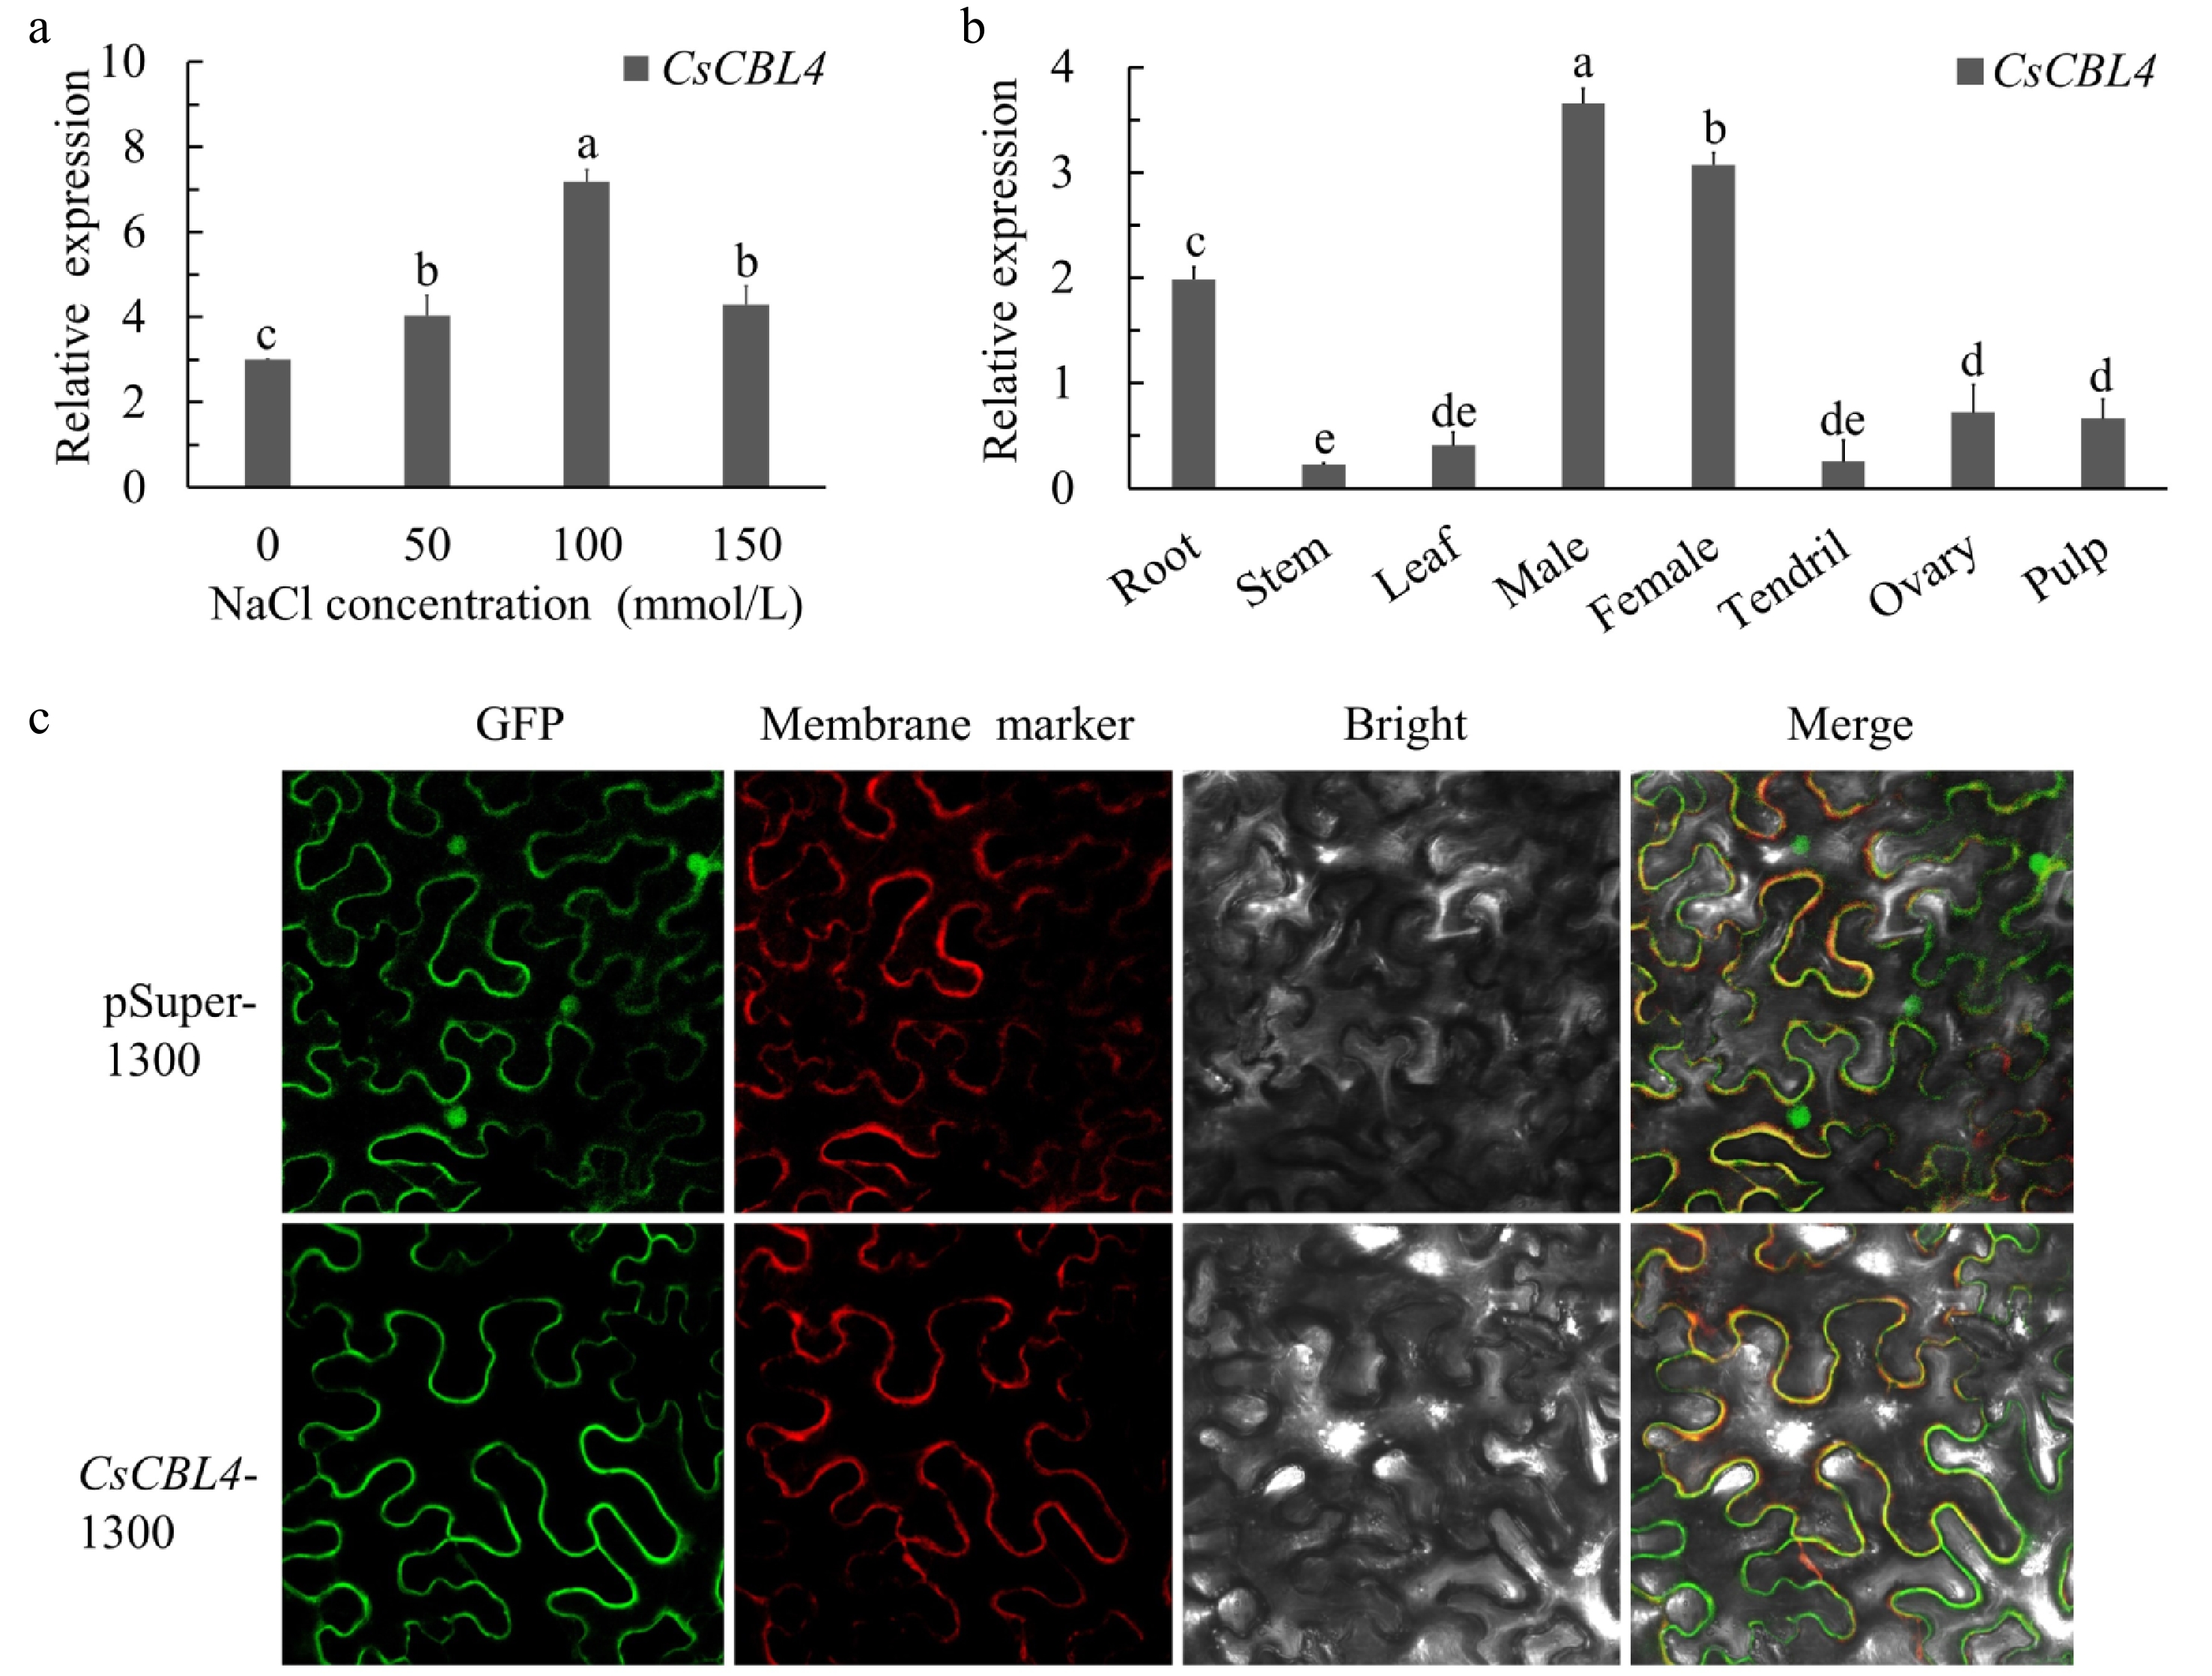
Figure 2.
The relative expression levels and subcellular localization of CsCBL4. (a) The expression levels of CsCBL4 under different salt treatments. (b) The relative expression levels of CsCBL4 in different tissues (root, stem, leaf, male bud, female bud, tendril, ovary at the first day of flowering and pulp at 7 days after flowering) of cucumber. (c) Subcellular localization of the CsCBL4-GFP fusion protein in N. benthamiana. Each value is the mean SE (n = 3). Different icons indicate significant differences between treatments (p < 0.05).
-
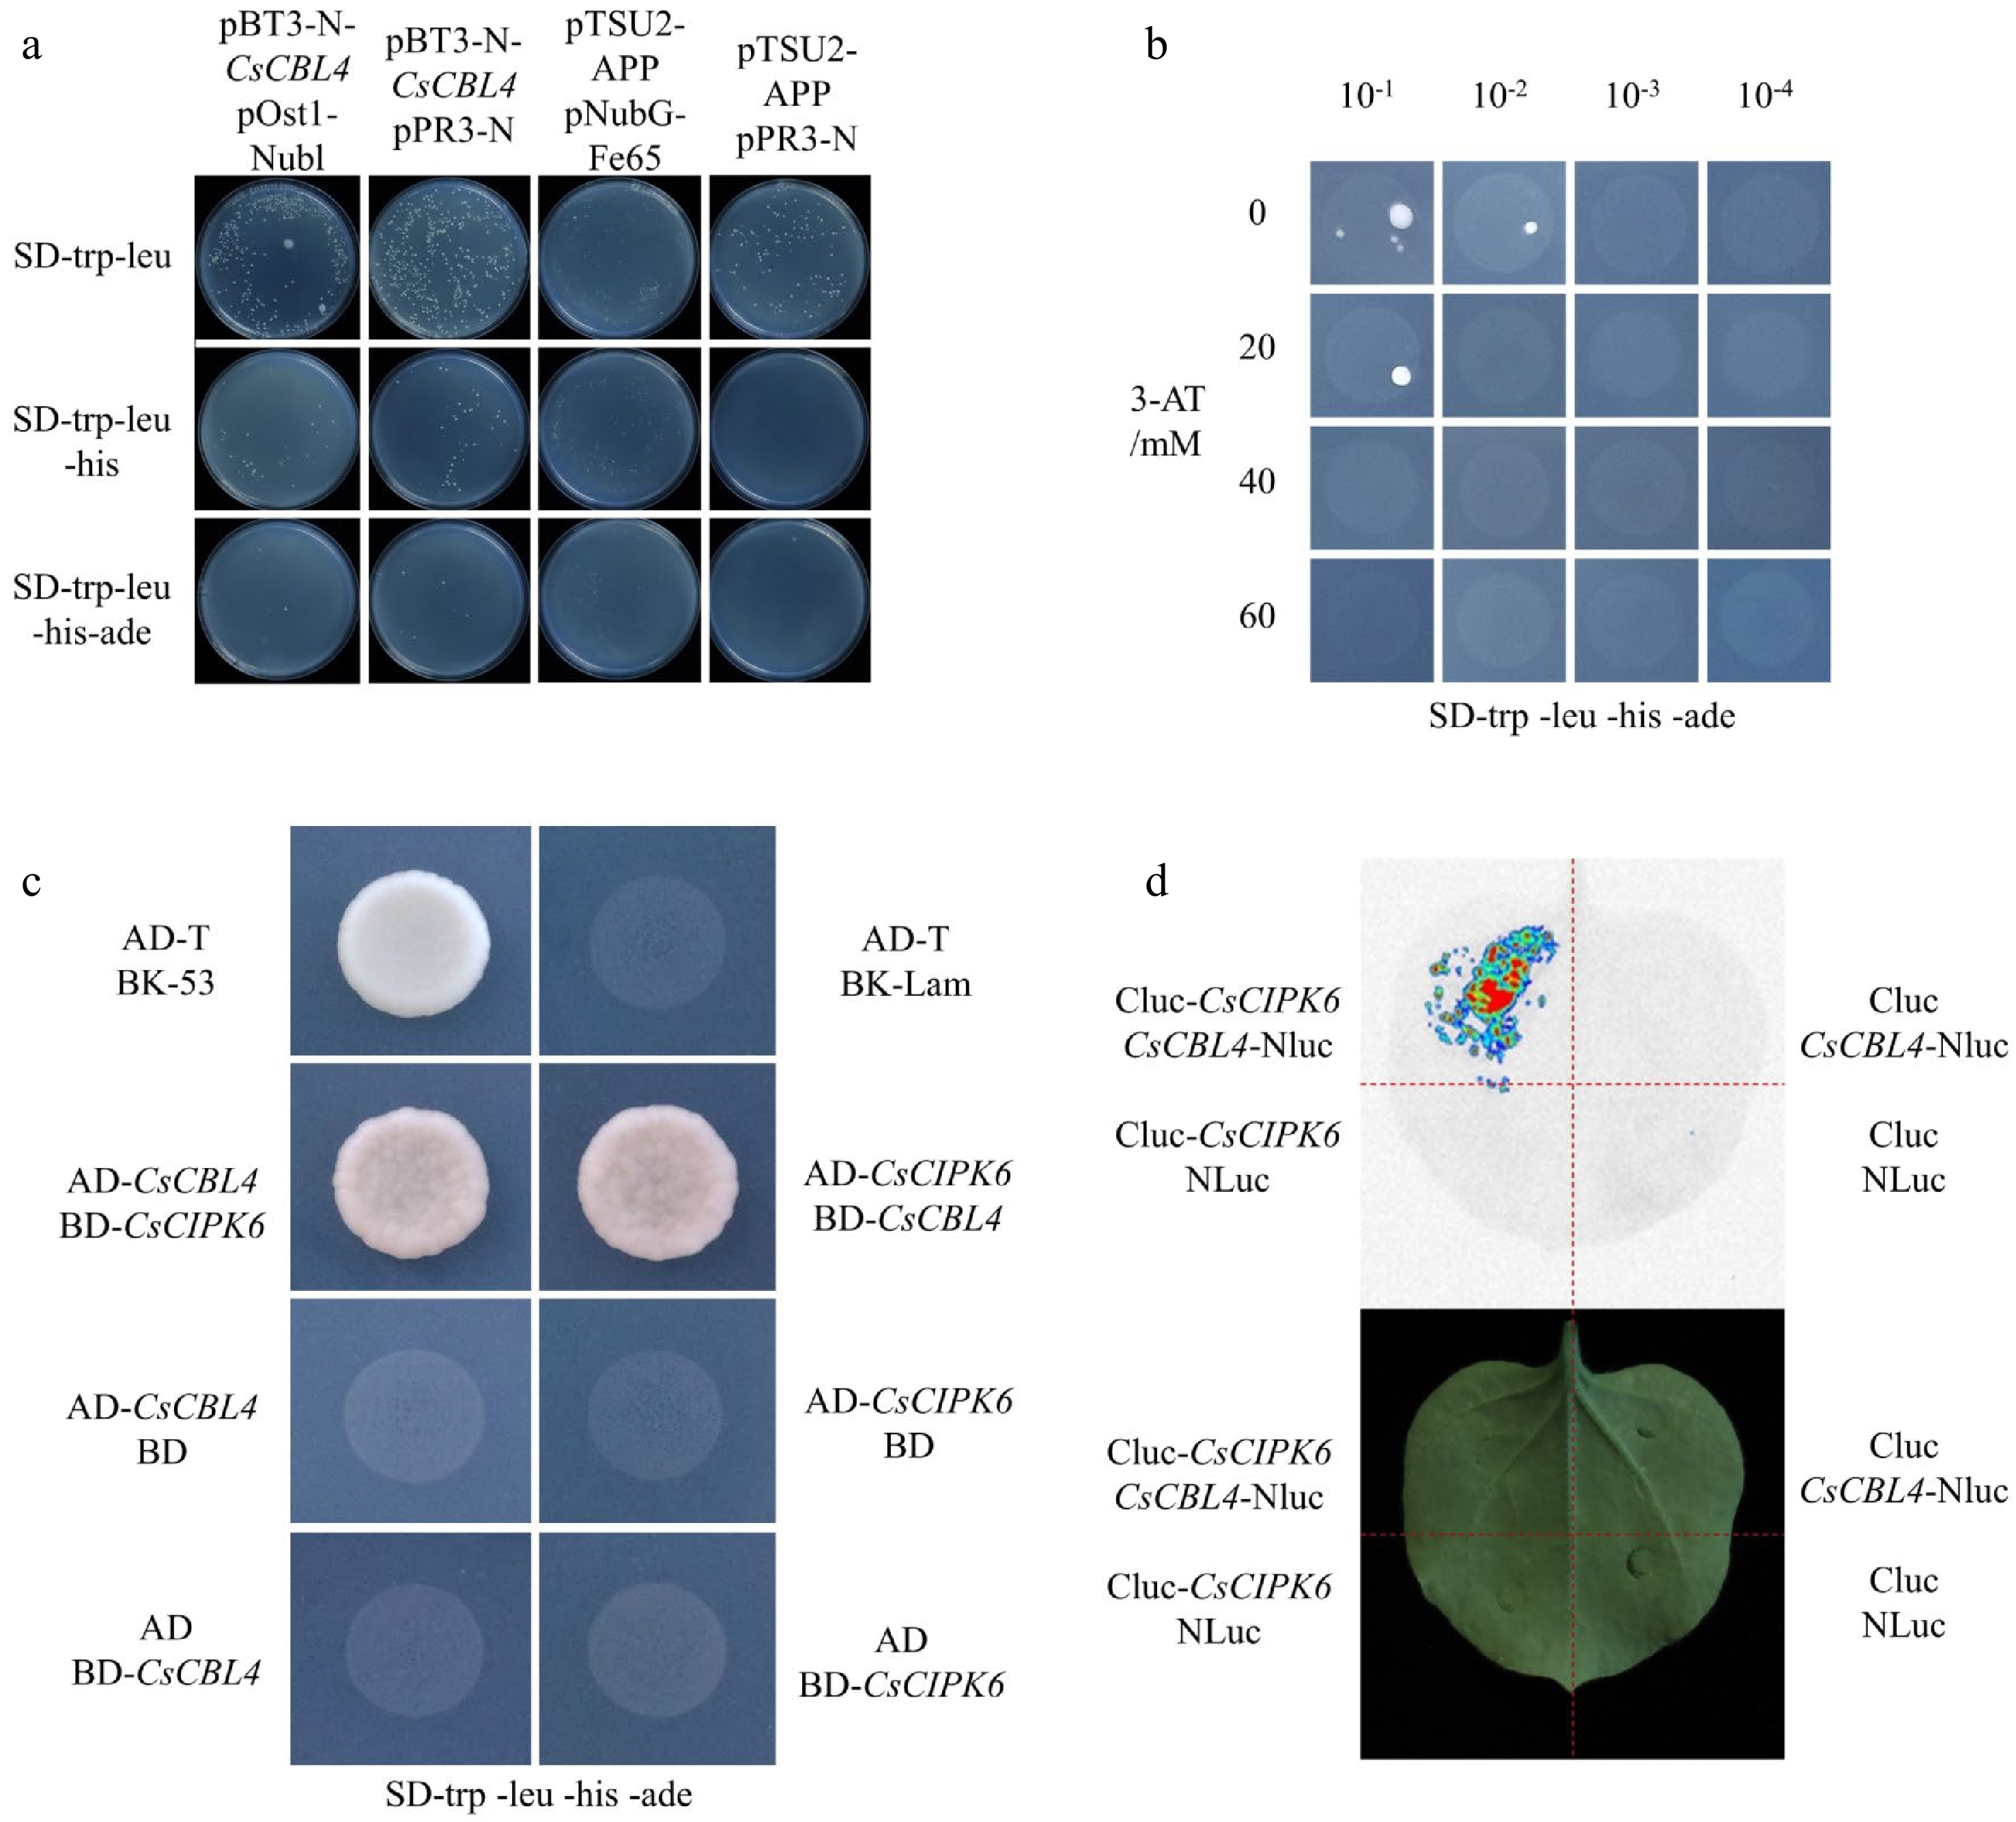
Figure 3.
CsCBL4 interacted with CsCIPK6. (a) The transformation efficiency of the DUAL membrane assay. (b) The background concentration of 3-AT to inhibit the self-activation of pBT3-N-CsCBL4. (c) The interaction between CsCBL4 and CsCIPK6 indicated by Y2H. (d) The interaction between CsCBL4 and CsCIPK6 in vivo showed by LCI assay.
-
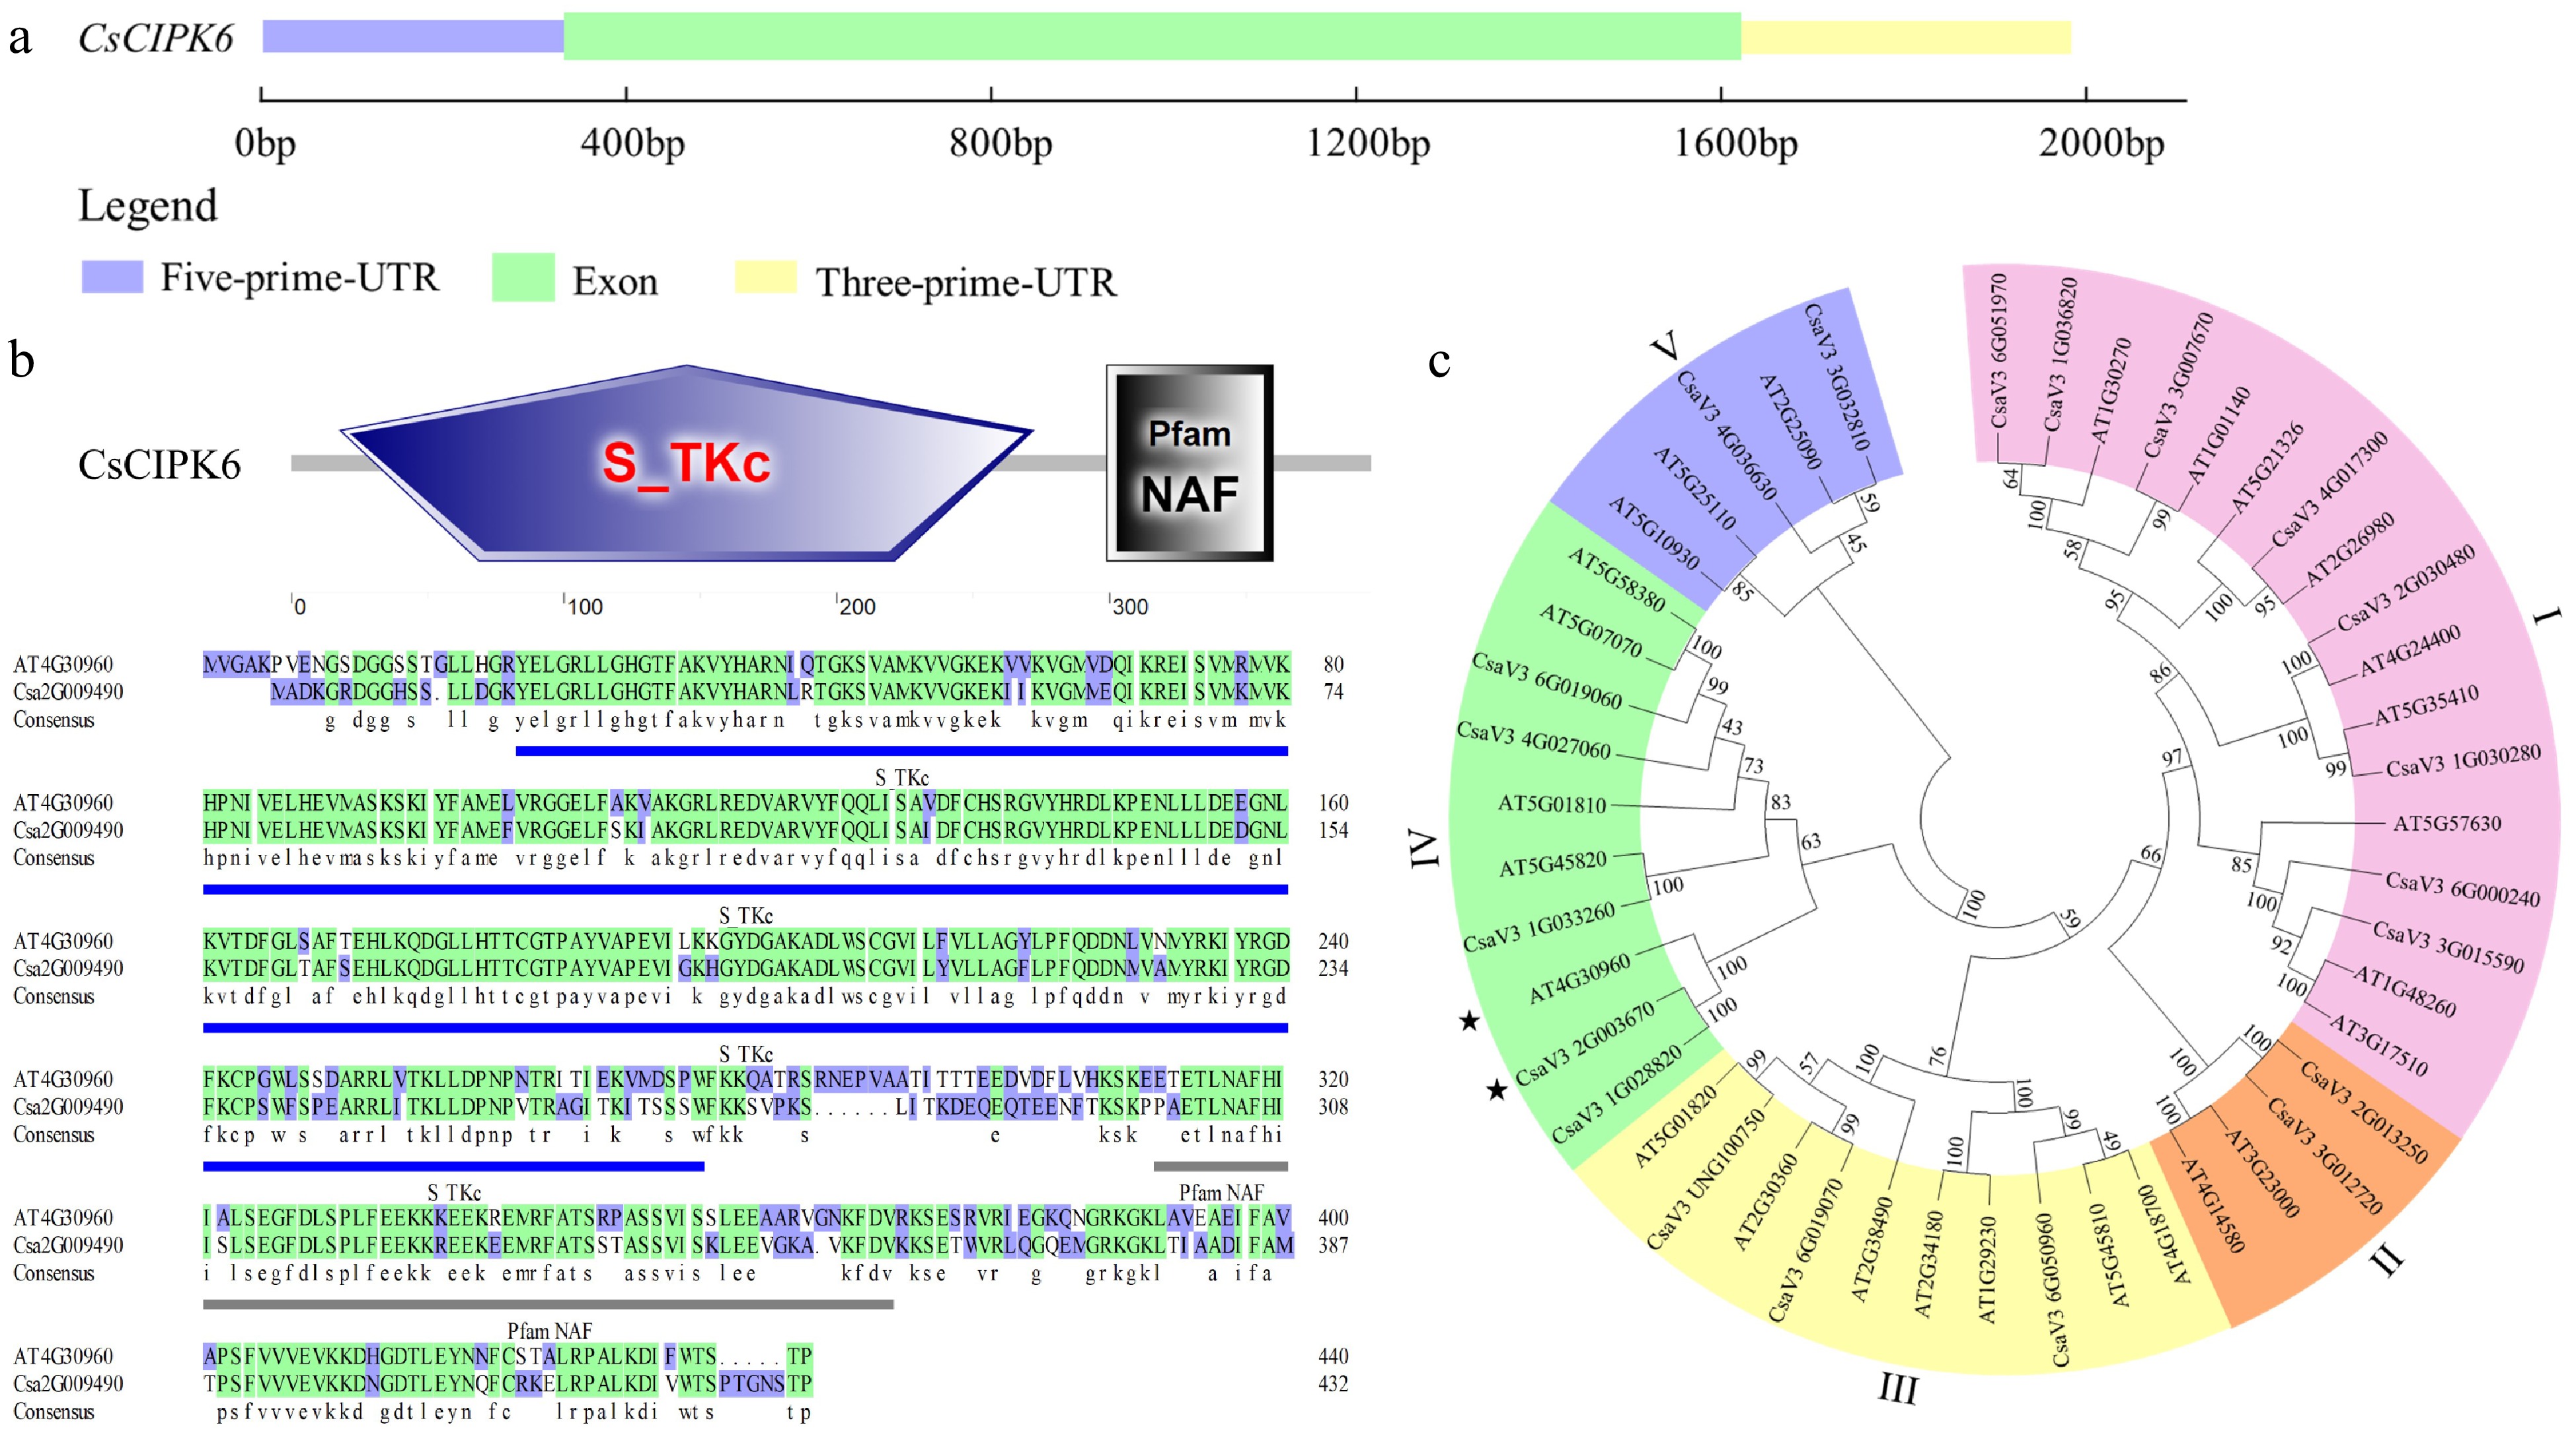
Figure 4.
Phylogenetic tree and conservative motifs analysis of CsCIPK6. (a) The exon-intron structure of CsCIPK6. (b) The domains of CsCIPK6 in Arabidopsis and cucumber. Blue underlines indicate the position of the Pfam NAF domain. (c) The phylogenetic tree of CIPKs in cucumber and Arabidopsis. * indicates the CIPK6 genes of Arabidopsis and cucumber respectively.
-
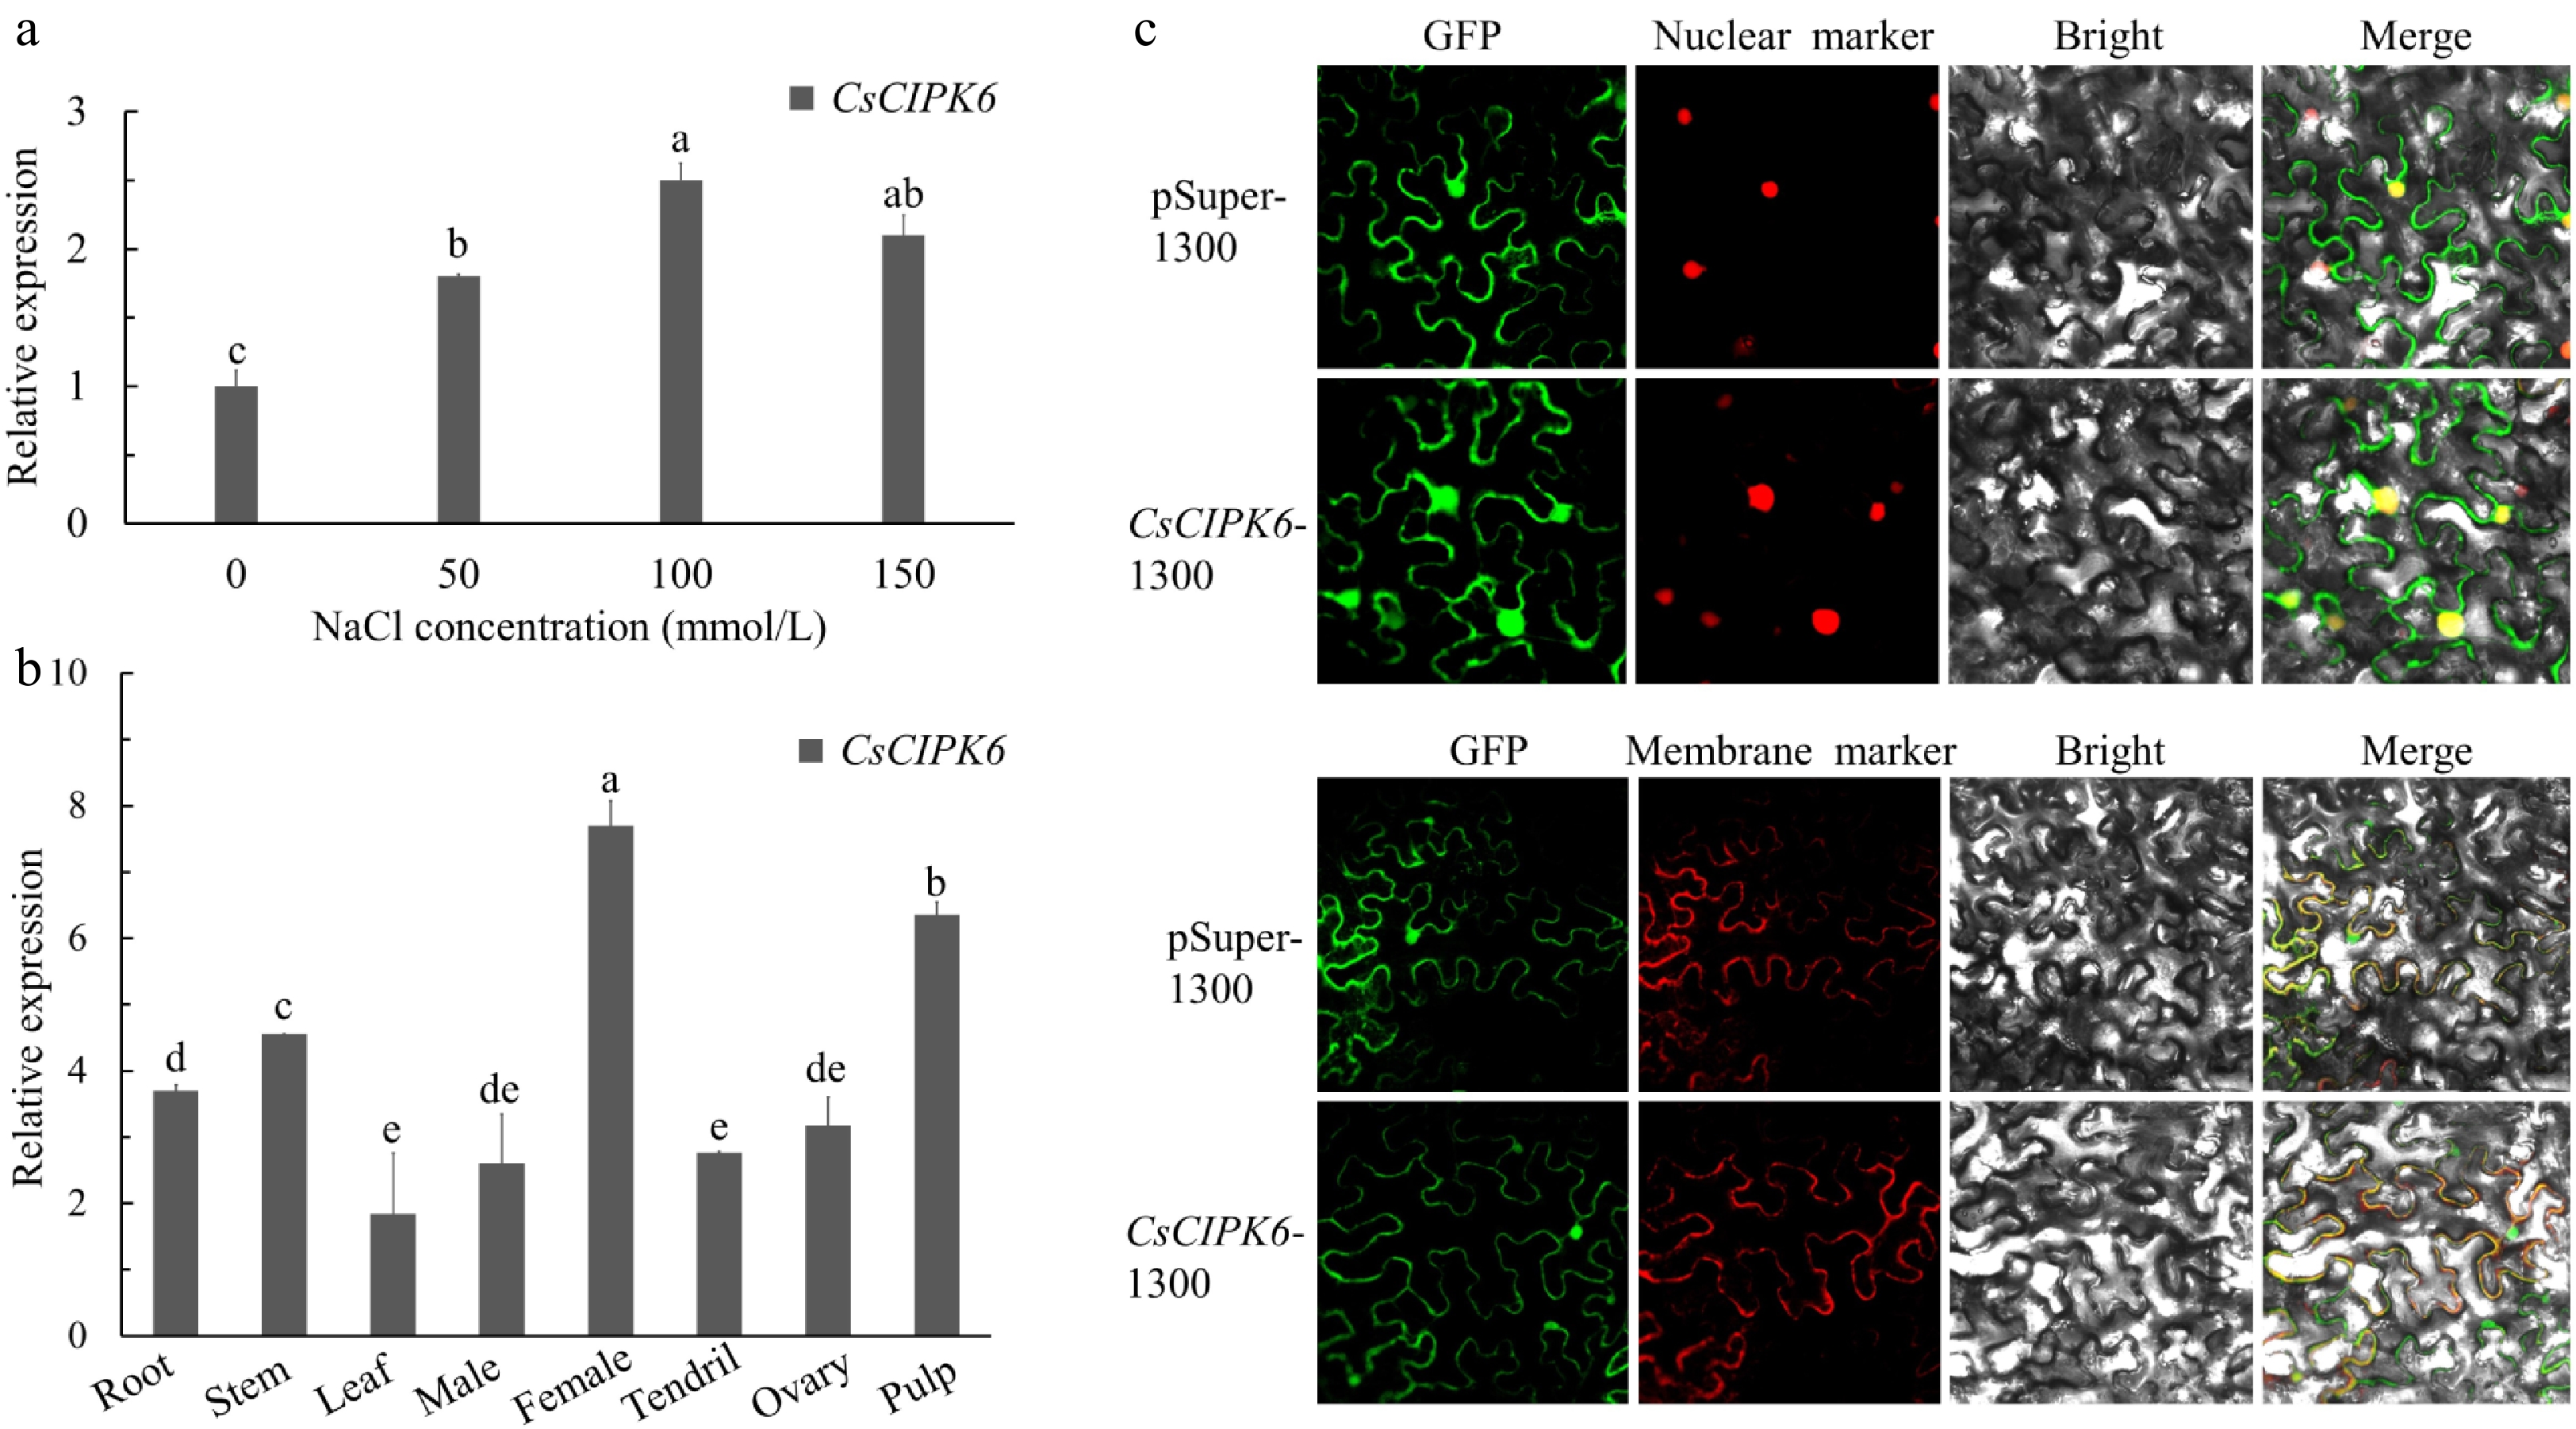
Figure 5.
Relative expression levels and subcellular localization of CsCIPK6. (a) The expression levels of CsCIPK6 under different salt treatments. (b) The relative expression levels of CsCIPK6 in different tissues (root, stem, leaf, male bud, female bud, tendril, ovary at the first day of flowering and pulp at 7 days after flowering) of cucumber. (c) Subcellular localization of the CsCIPK6 -GFP fusion protein in N.benthamiana. Each value is the mean SE (n = 3). Different icons indicate significant differences between treatments (p < 0.05).
-
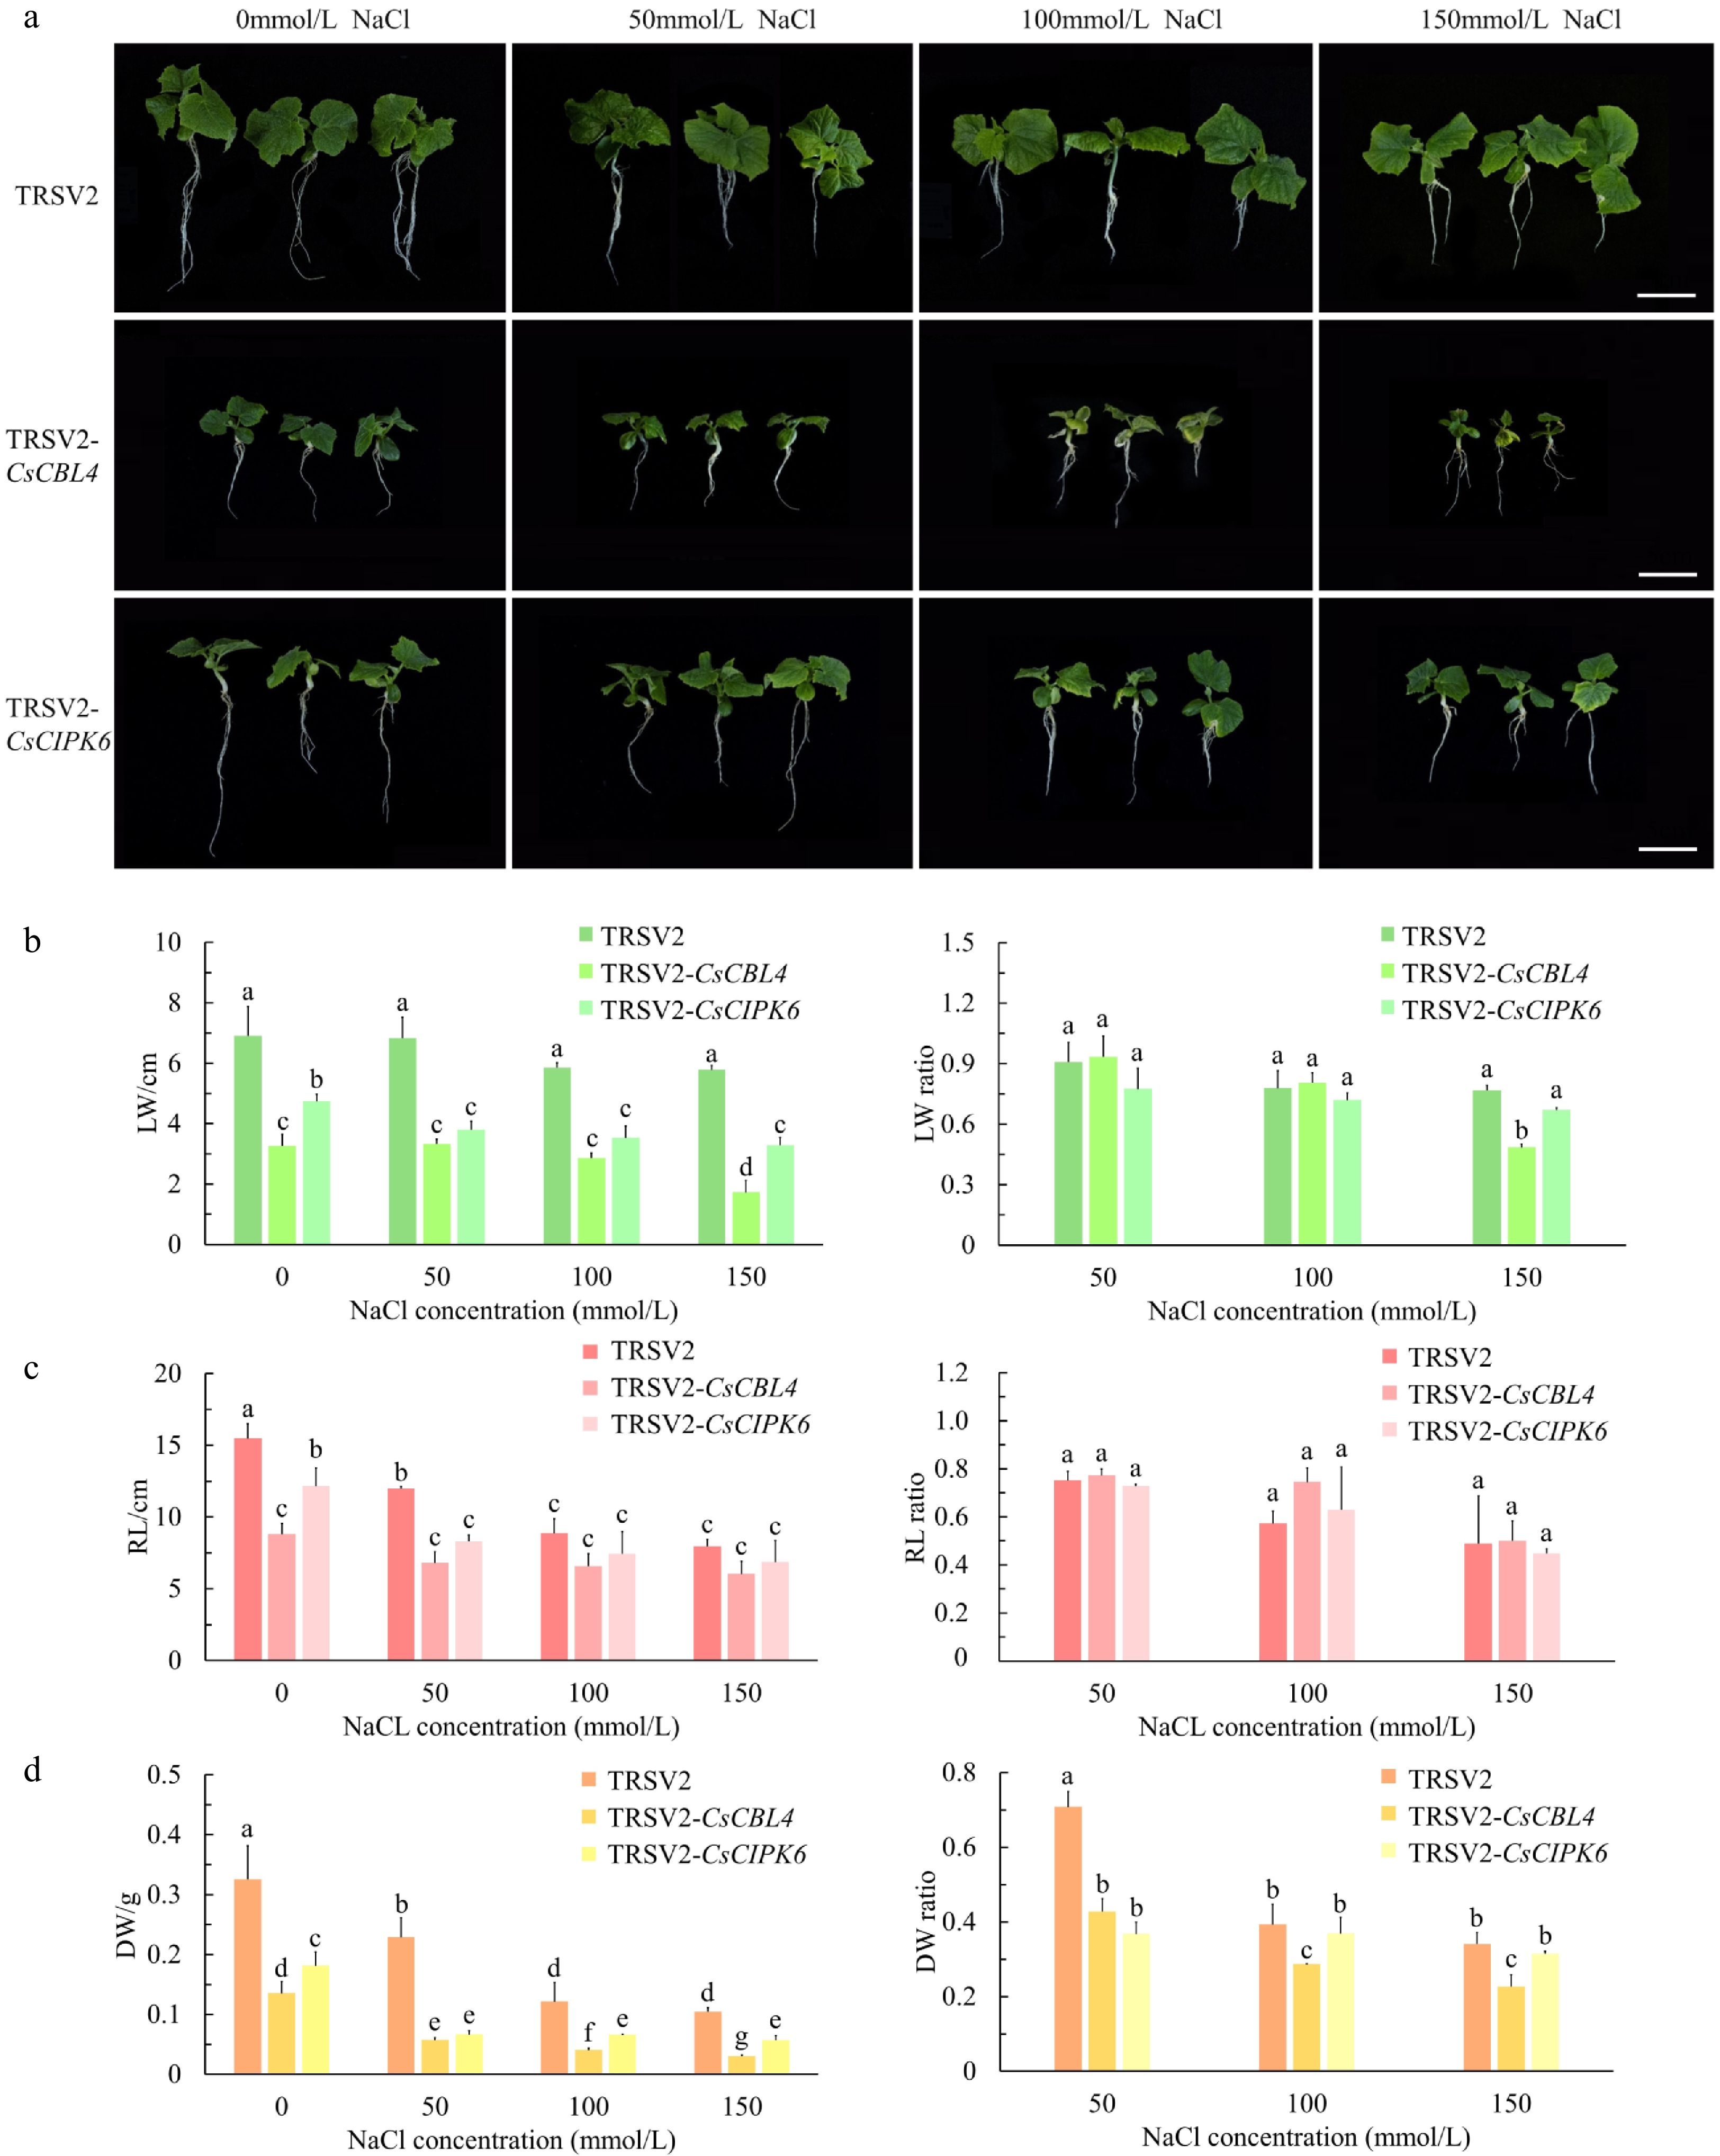
Figure 6.
Silencing of CsCBL4 or CsCIPK6 both reduced the salt tolerance in cucumber seedlings. (a) Phenotype of the silenced plants. Empty TRSV2 was used as a control. (Bar = 5 cm). (b) The leaf width (LW) of the control and the silenced plants in different treatments, and the ratios of plants with salt treatment to plants without salt treatment. (c) The root length (RL) of the control and the silenced plants in different treatments, and the ratios of plants with salt treatment to plants without salt treatment. (d) The dry weight (DW) of the control and the silenced plants in different treatments, and the ratios of plants with salt treatment to plants without salt treatment. Each value is the mean SE (n = 3). Different icons indicate significant differences between treatments (p < 0.05).
-
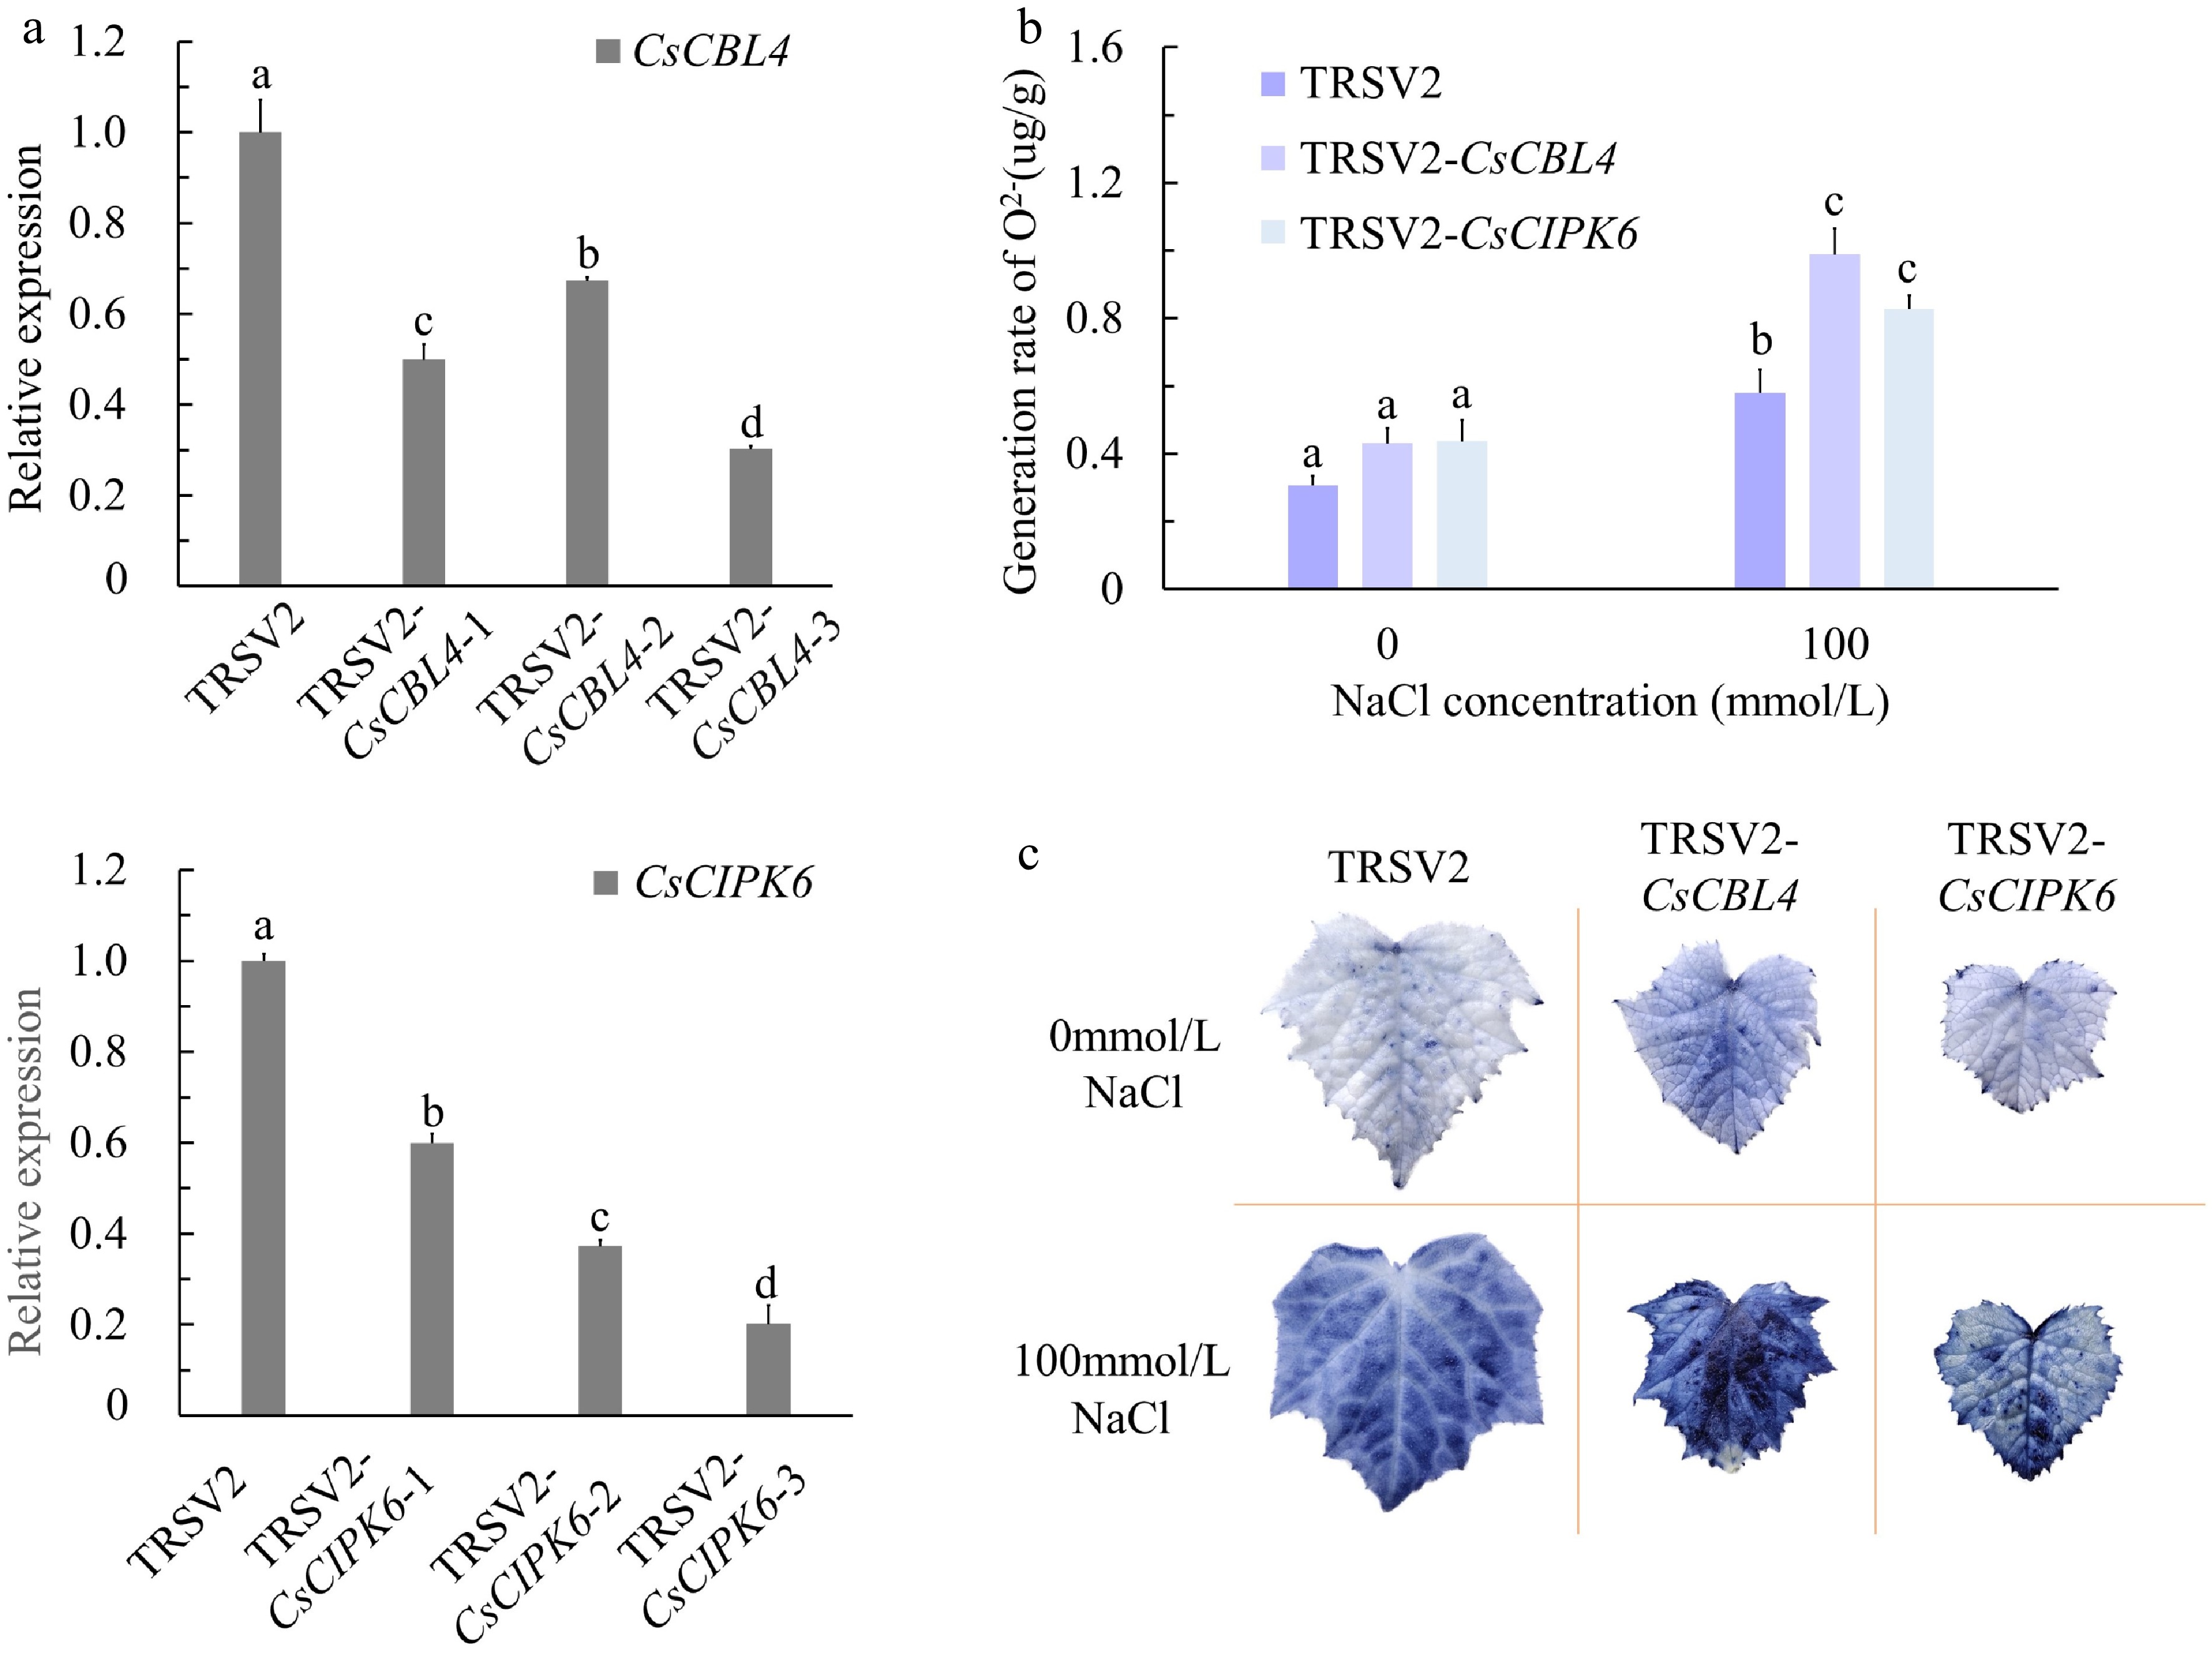
Figure 7.
The silenced degrees and oxygen damage of CsCBL4-silenced plants and CsCIPK6-silenced plants. (a) Relative expression levels of CsCBL4 and CsCIPK6 in roots of CsCBL4 and CsCIPK6 silenced plants. (b) The content of O2− of control and the silenced plants in different treatments. (c) The generation rate of O2− of the control and the silenced plants in different treatments. Each value is the mean SE (n = 3). Different icons indicate significant differences between treatments (p < 0.05).
-
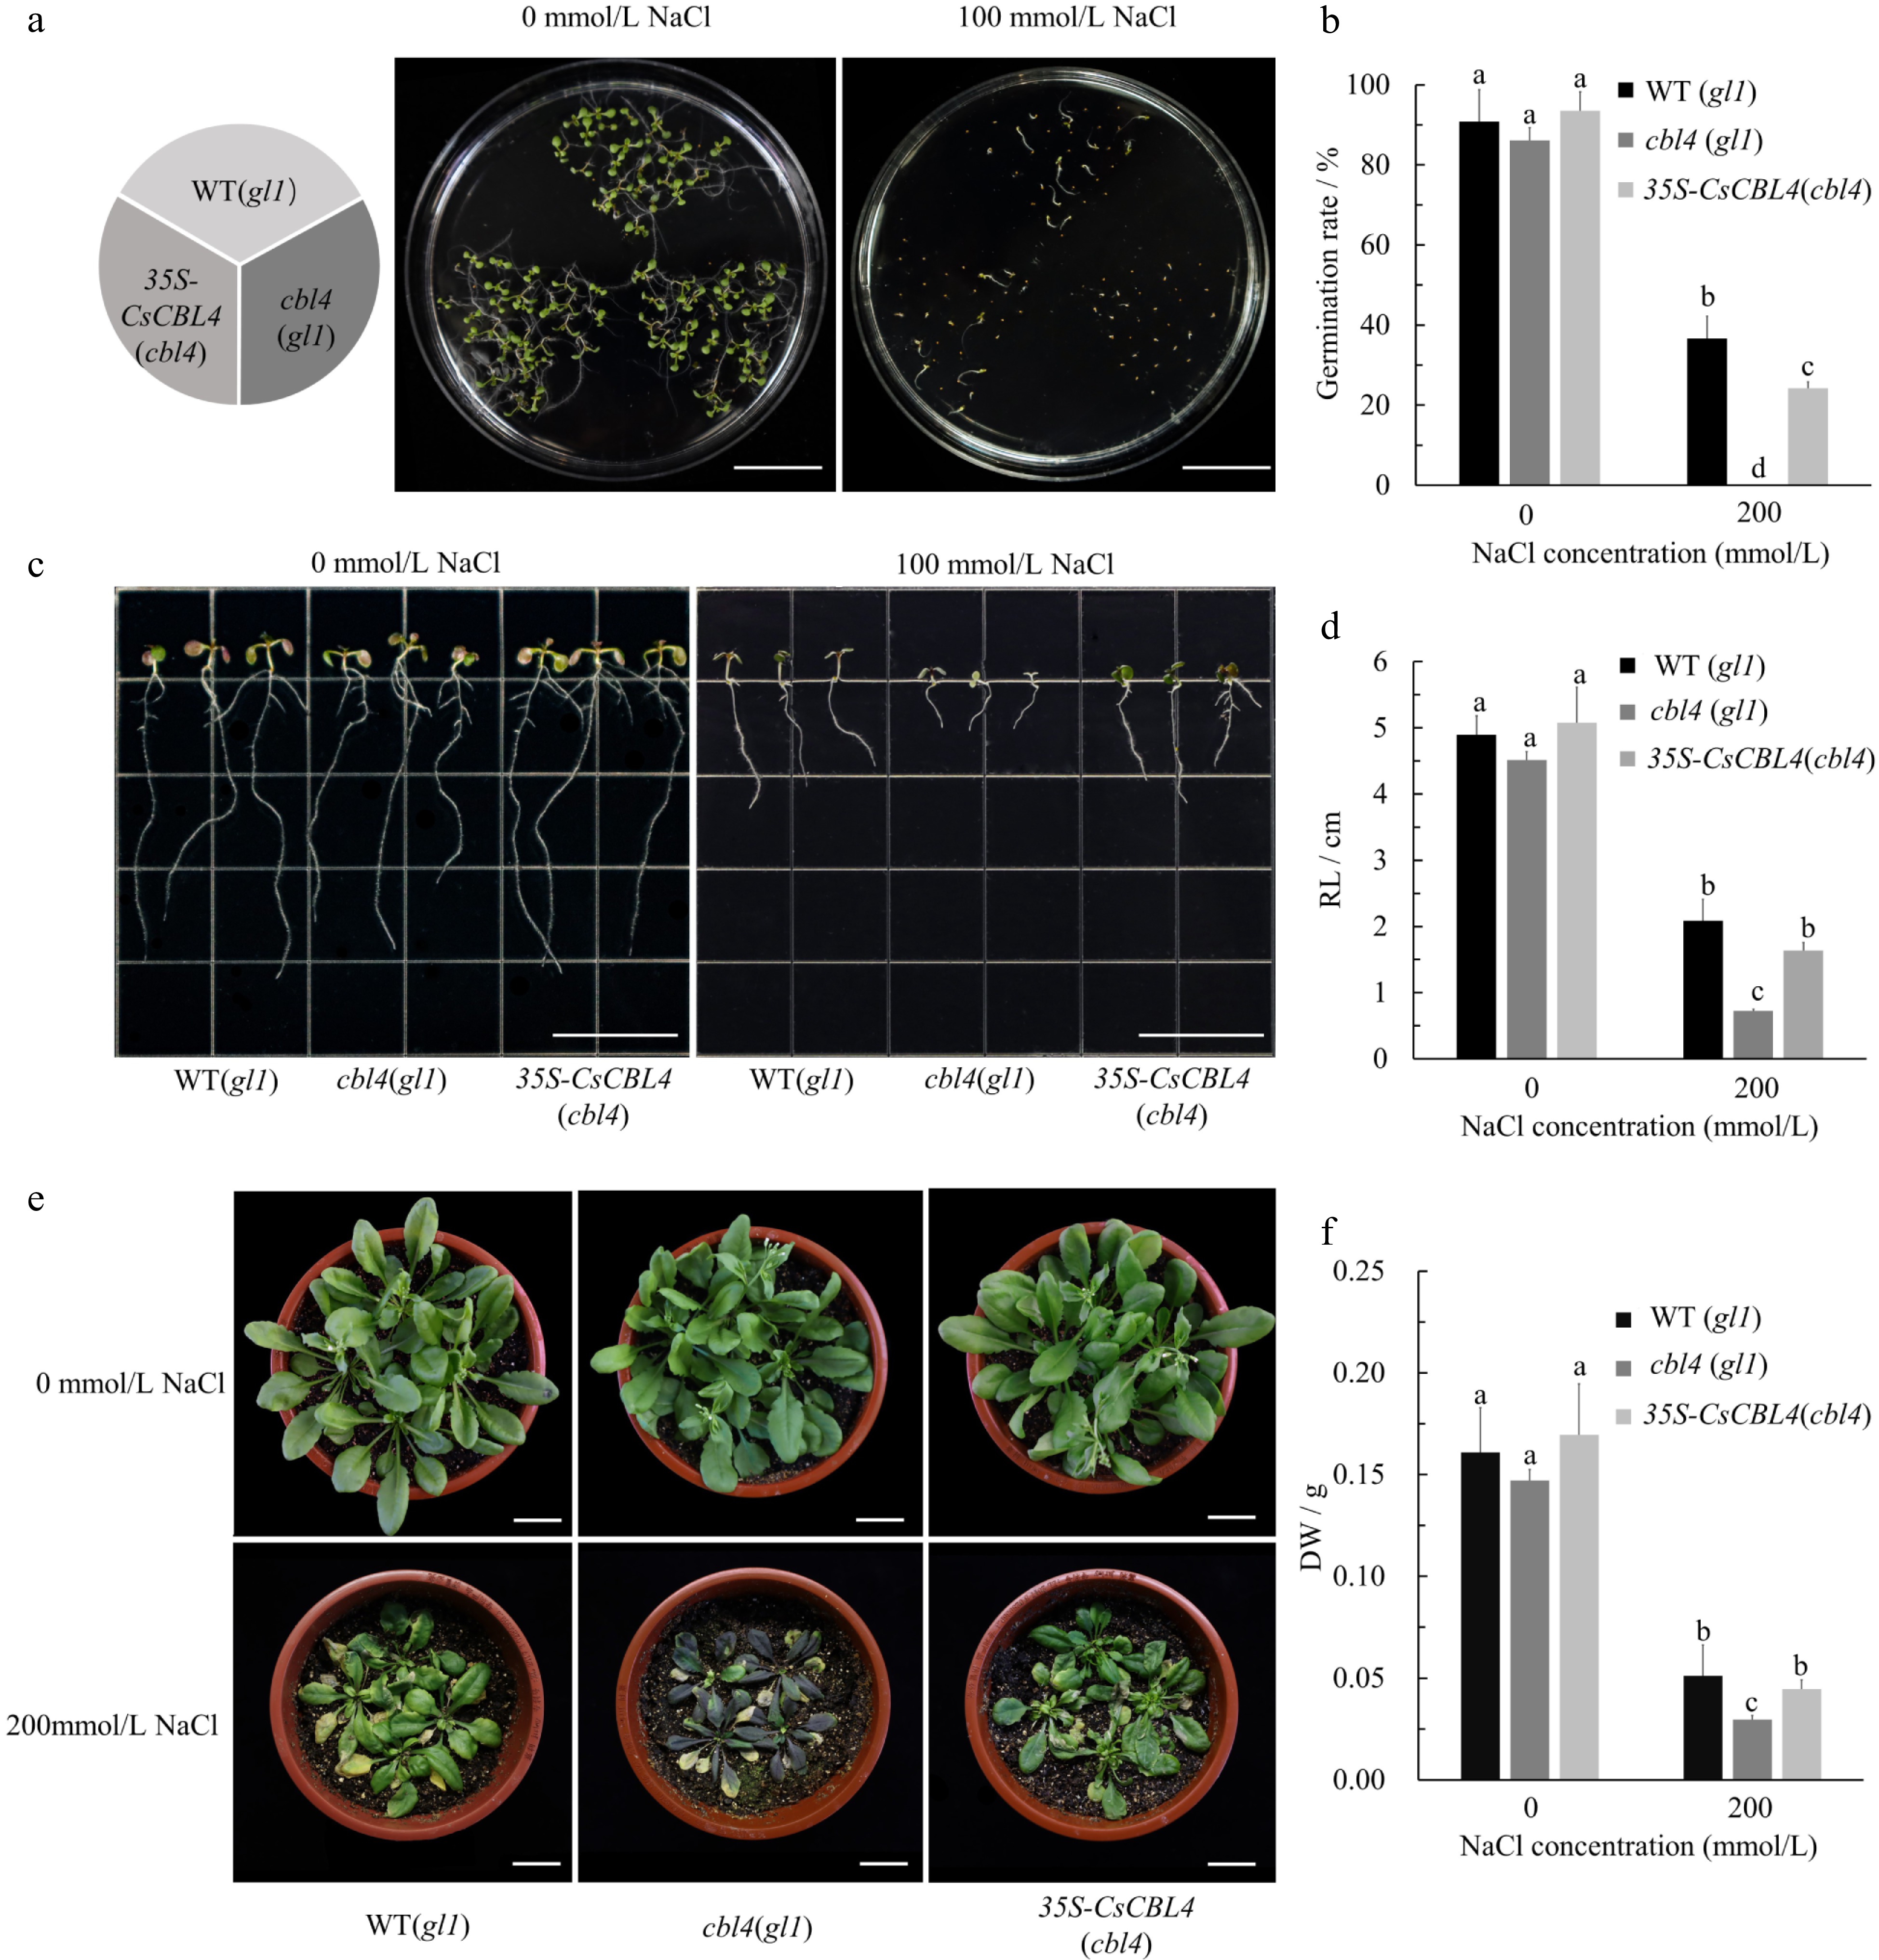
Figure 8.
Overexpression of CsCBL4 could improve the salt tolerance of cbl4(gl1) in Arabidopsis. (a) The germination conditions of WT (gl1), cbl4 (gl1) and 35S-CsCBL4 (cbl4) on the mediums with different NaCl concentrations (Bar = 2 cm). (b) Statistics of germination in different mediums. (c) The root elongation of WT (gl1), cbl4 (gl1) and 35S-CsCBL4 (cbl4) plants on the mediums with different NaCl concentrations (Bar = 2 cm). (d) Statistics of root length on different mediums. (e) Growth of WT (gl1), cbl4 (gl1) and 35S-CsCBL4 (cbl4) plants treated with different salt concentrations (Bar = 2 cm). (f) The dry weight of rosettes and roots in WT (gl1), cbl4 (gl1) and 35S-CsCBL4 (cbl4) under different salt treatments. Each value is the mean SE (n = 3). Different icons indicate significant differences between treatments (p < 0.05).05).
Figures
(8)
Tables
(0)