-
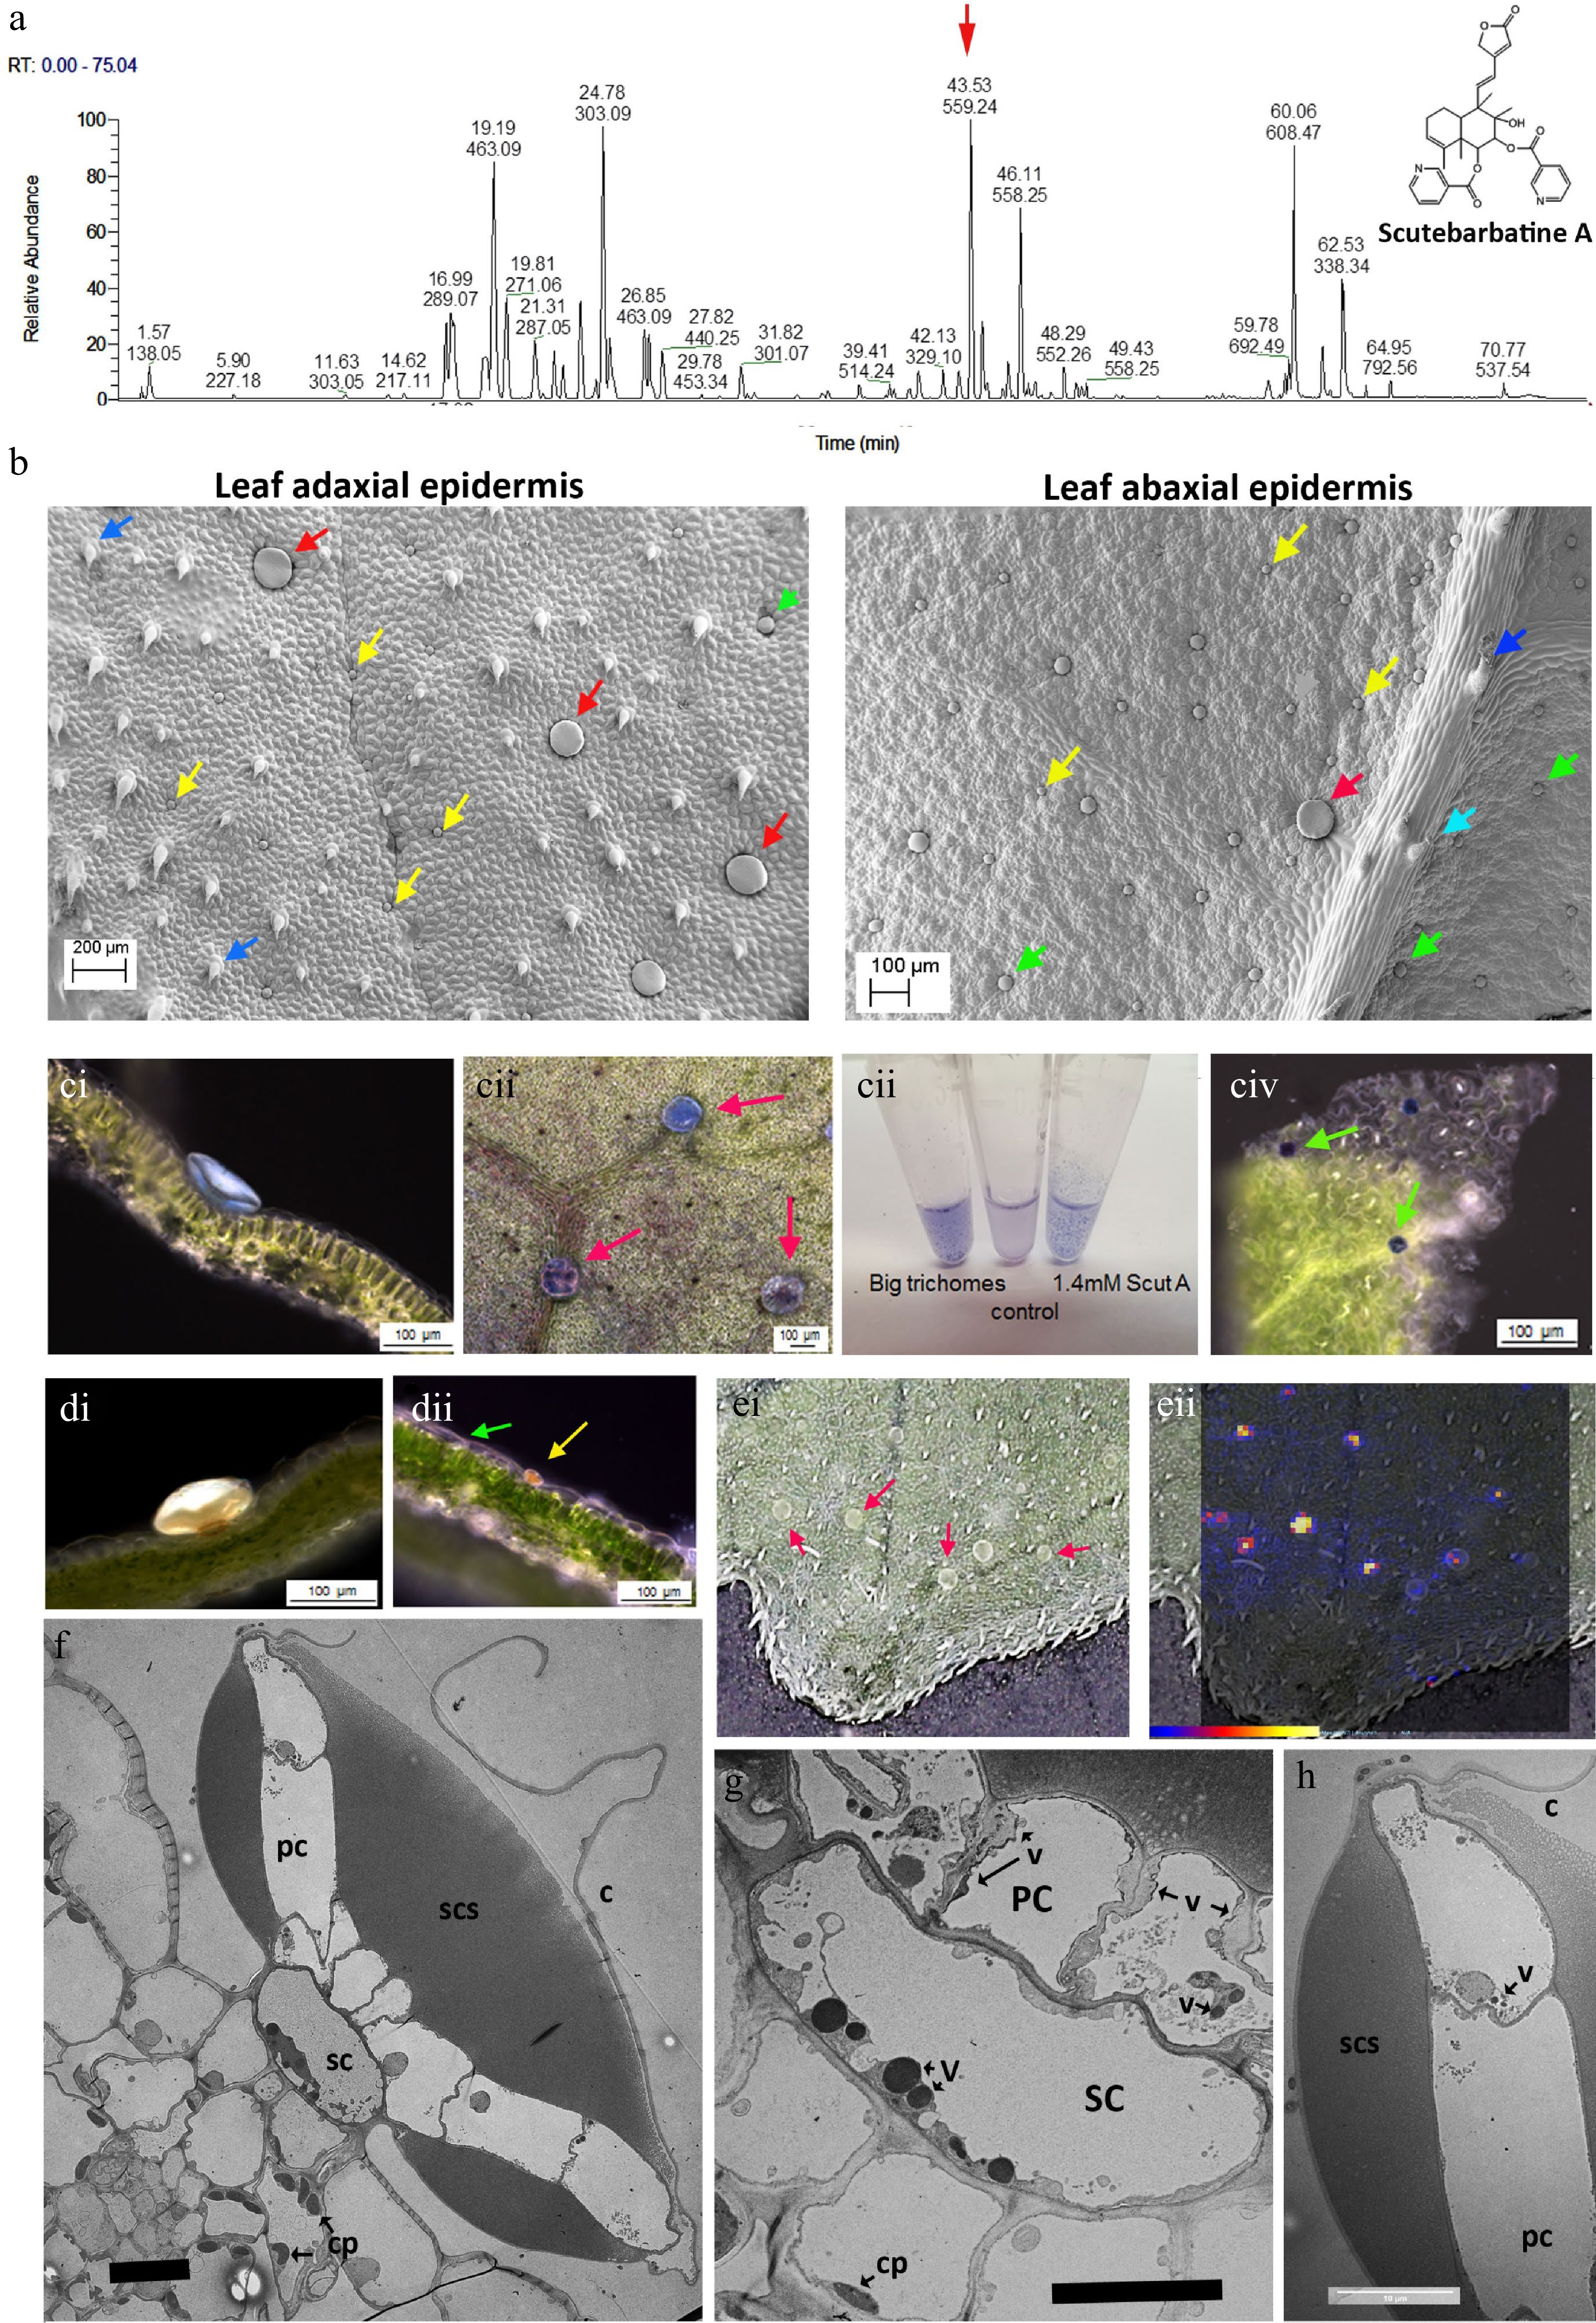
Figure 1.
Scutebarbatine A is the major clerodane diterpenoid and localises to a specialised type of peltate trichome on S. barbata leaves. (a) UV profile of methanolic extract of leaves from leaves of S. barbata. Each peak is labelled with its migration time and mass. The red arrow indicates the peak with mass 559.24, scutebarbatine A. Tentative identification of other peaks is provided in Supplemental Table S1, based on MS3 fragmentation profiles, accurate mass and in some cases NMR analysis. (b) Cryo-SEM micrographs showing the large (red arrows), medium (green arrows) and small (yellow arrows) peltate trichomes on the mature leaves of S. barbata. Images of the upper, adaxial leaf surface are shown on the left and on the lower abaxial leaf surface at 2x magnification on the right. Dark blue arrows indicate non-glandular trichomes and the pale blue arrow indicates a capitate glandular trichome. (c) NaDi staining of leaves of S. barbata for terpenoids, (c i) A large trichome on the adaxal leaf surface staining light blue. (c ii) Surface view of large trichomes stained with NaDi. The leaf has been decolorized in ethanol. (c iii) NaDi staining of large trichomes hand picked into methanol, methanol alone and purified scutebarbatine A. (c iv) Surface view of NaDi staining of medium trichomes. (d) Sudan IV staining of trichomes for lipids. (d i) A large trichome. (d ii) a small trichome. (e) MALDI-TOF images, showing location of mass 559. (e i) Shows a photograph of the leaf imaged with large trichomes indicated by red arrows. (e ii) shows scutebarbatine A (mass 559) localization indicated by red-yellow fluorescence on the leaf surface shown to be in the large trichome by overlaying the MALDI-image on the leaf surface photograph. Scale bar for signal intensity is shown on (e ii). (f−h) TEM micrographs showing a transverse sections of large peltate trichomes. (f) TEM of entire large trichome showing single stalk cell atop the adaxial leaf epidermis. The stalk cell (SC) supports a plate of cells (PC), one cell thick which exudes or secretes terpenoids into the sub-cuticular space (SCS) which lies on either side of the cell plate. This differs from the structure of the small and medium peltate trichomes which have sub-cuticular spaces above only the outer surface of the gland cells. C = cuticle of subcuticular space. (g) Detail of the stalk cell (SC) v = electron-dense vesicle, cp = chloroplast. (f) Displaying dense vacuolar material. (h) Detail of the outer cell of the plate of cells constituting the glandular head of a large peltate trichome. The contents of the subcuticular space adopt a honeycomb-like appearance in TEMs suggesting a solid or resinous structure rather than liquid contents, which does not diffuse after the cuticle has been ruptured. Scale bars for TEMs in (f), (g) and (h) represent 10 µm.
-
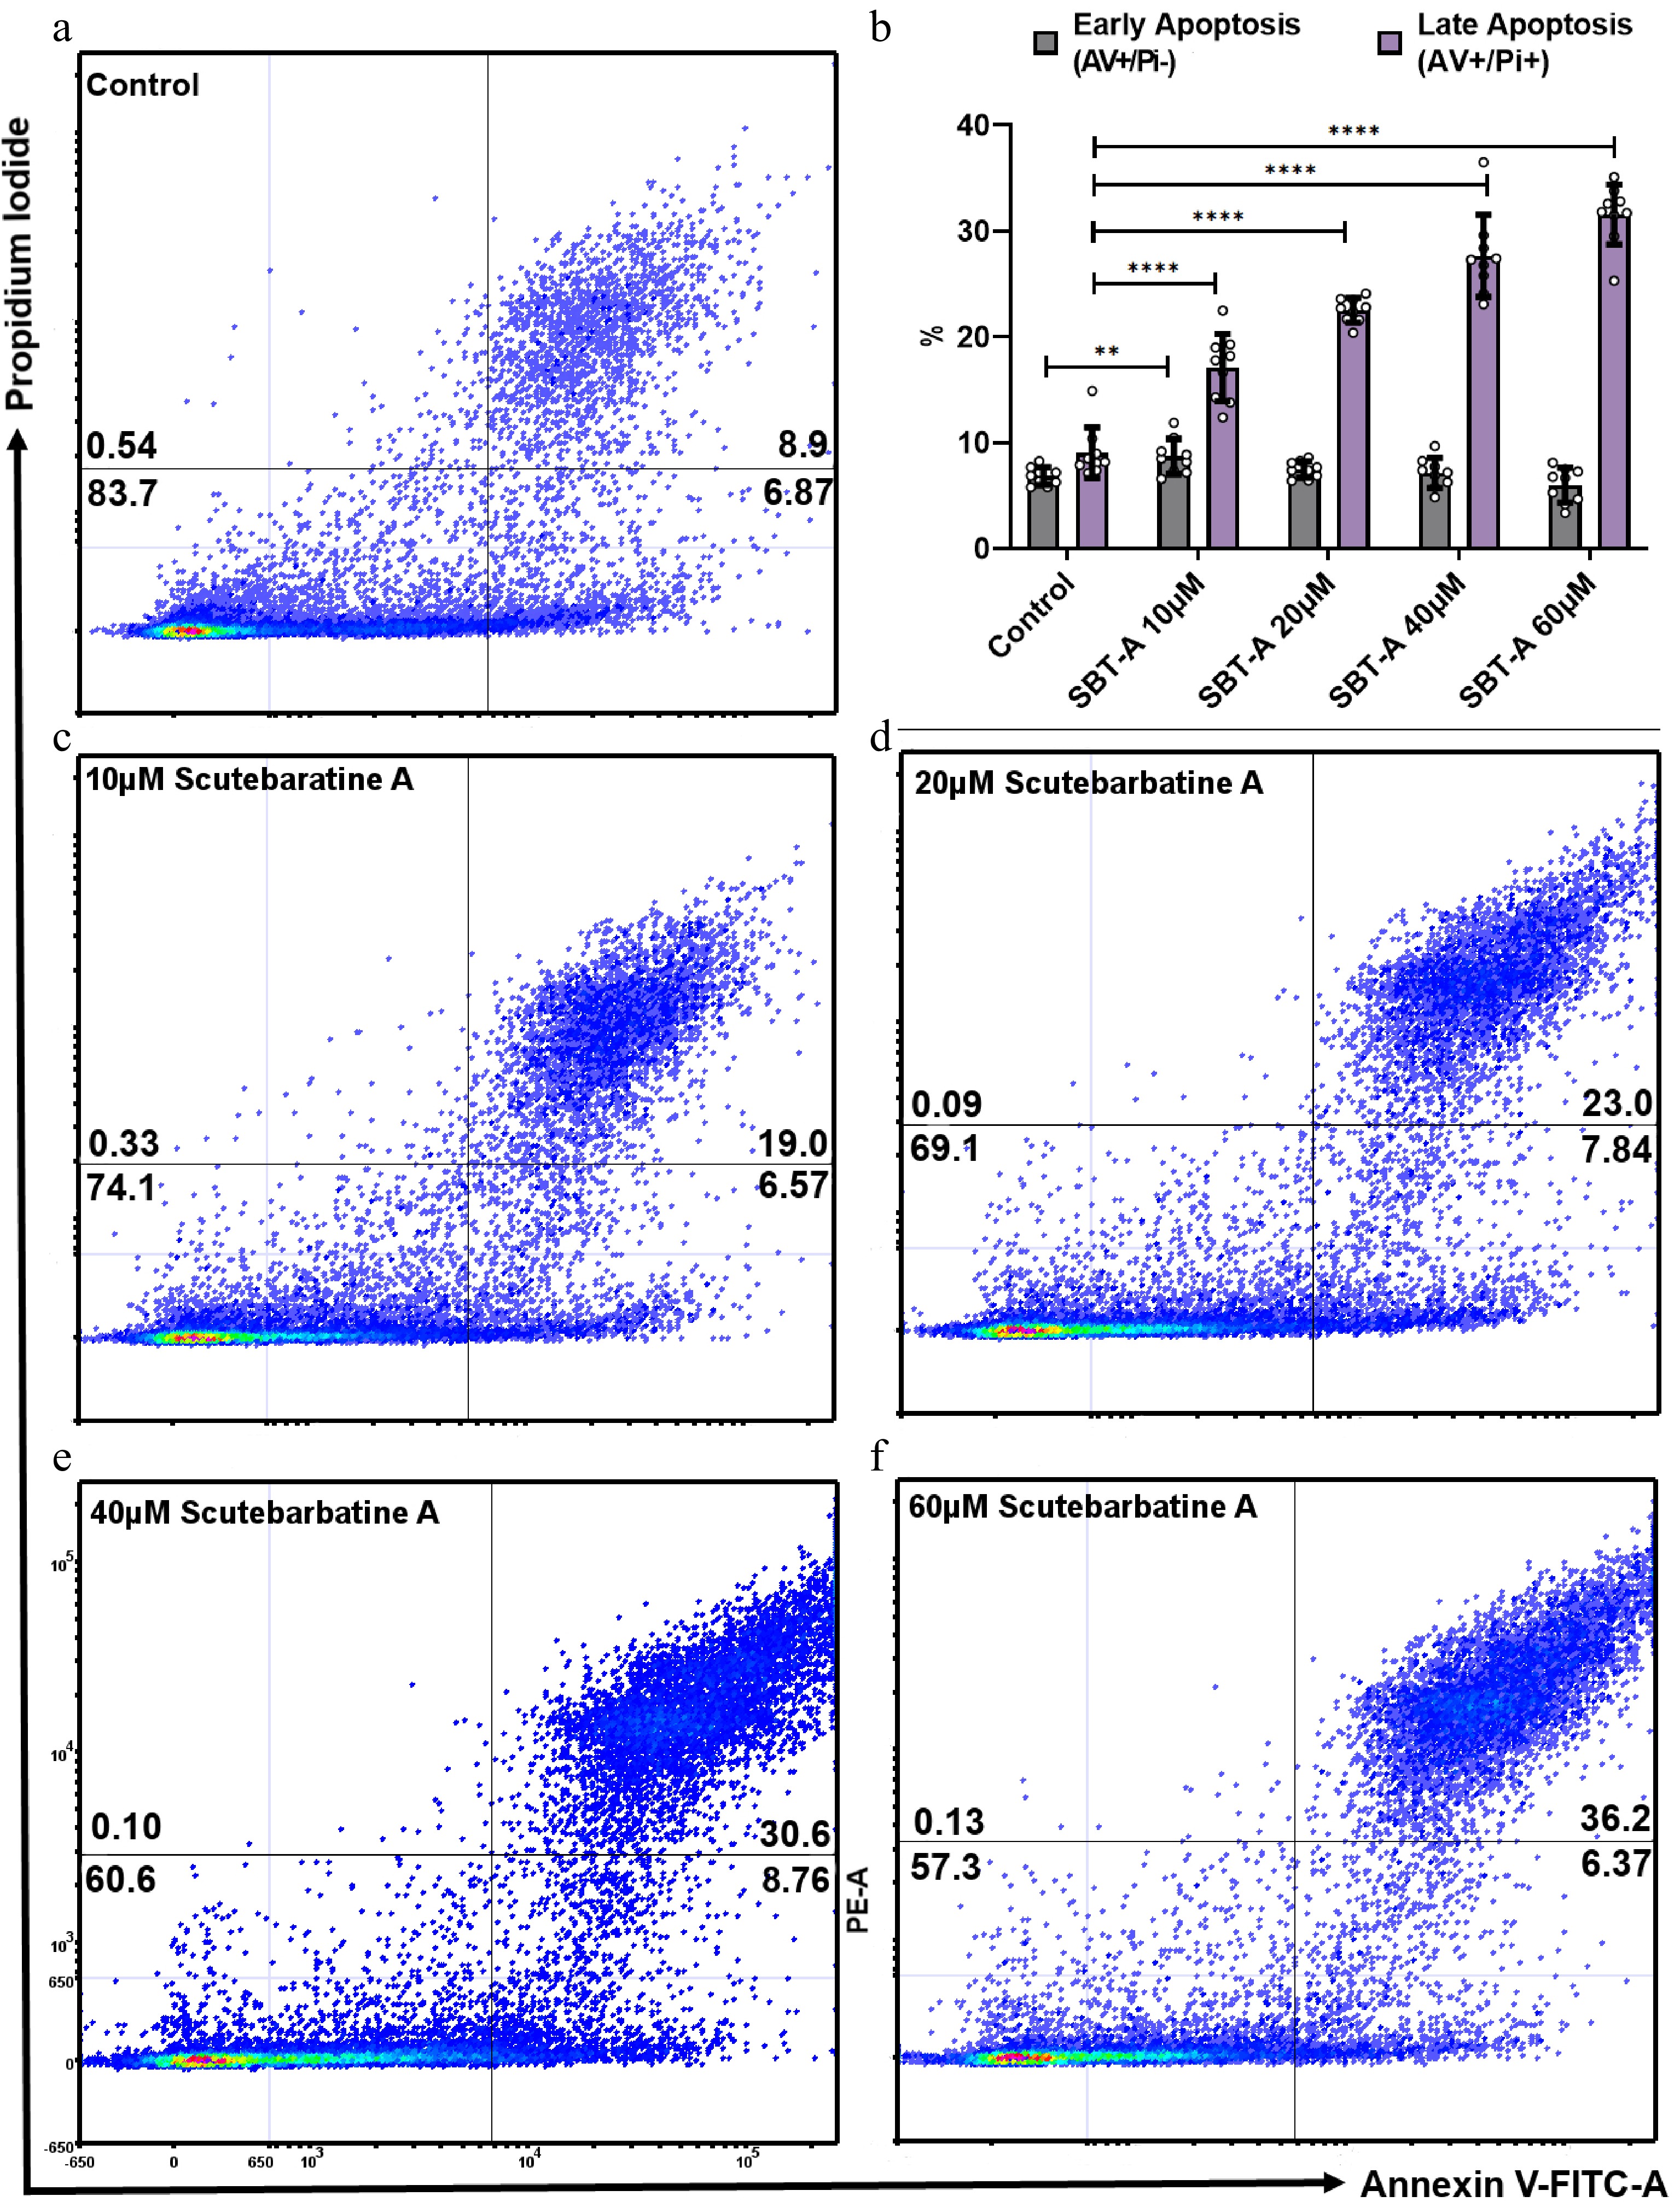
Figure 2.
Scutebarbatine A dose response effects on Caco-2 cancer cells. Cells were treated with low to high concentrations (10−60 µM). (a) & (c−e) show representative dot plots. (a) Control. (c−f) Increasing scutebarbatine A addition and a corresponding increase in late apoptosis. Annexin V positive cells are on the FITC-A (X axis) and Pi positive cells are on the PE-A (Y axis). Numbers in quadrats are %. Data are displayed as individual datapoints. (b) Shows the dose response as a bar chart. Horizontal bars represent the means and error bars SDev, (**** for P ≤ 0.0001, ** for P ≤ 0.01) n = 3 biologically independent experiments.
-
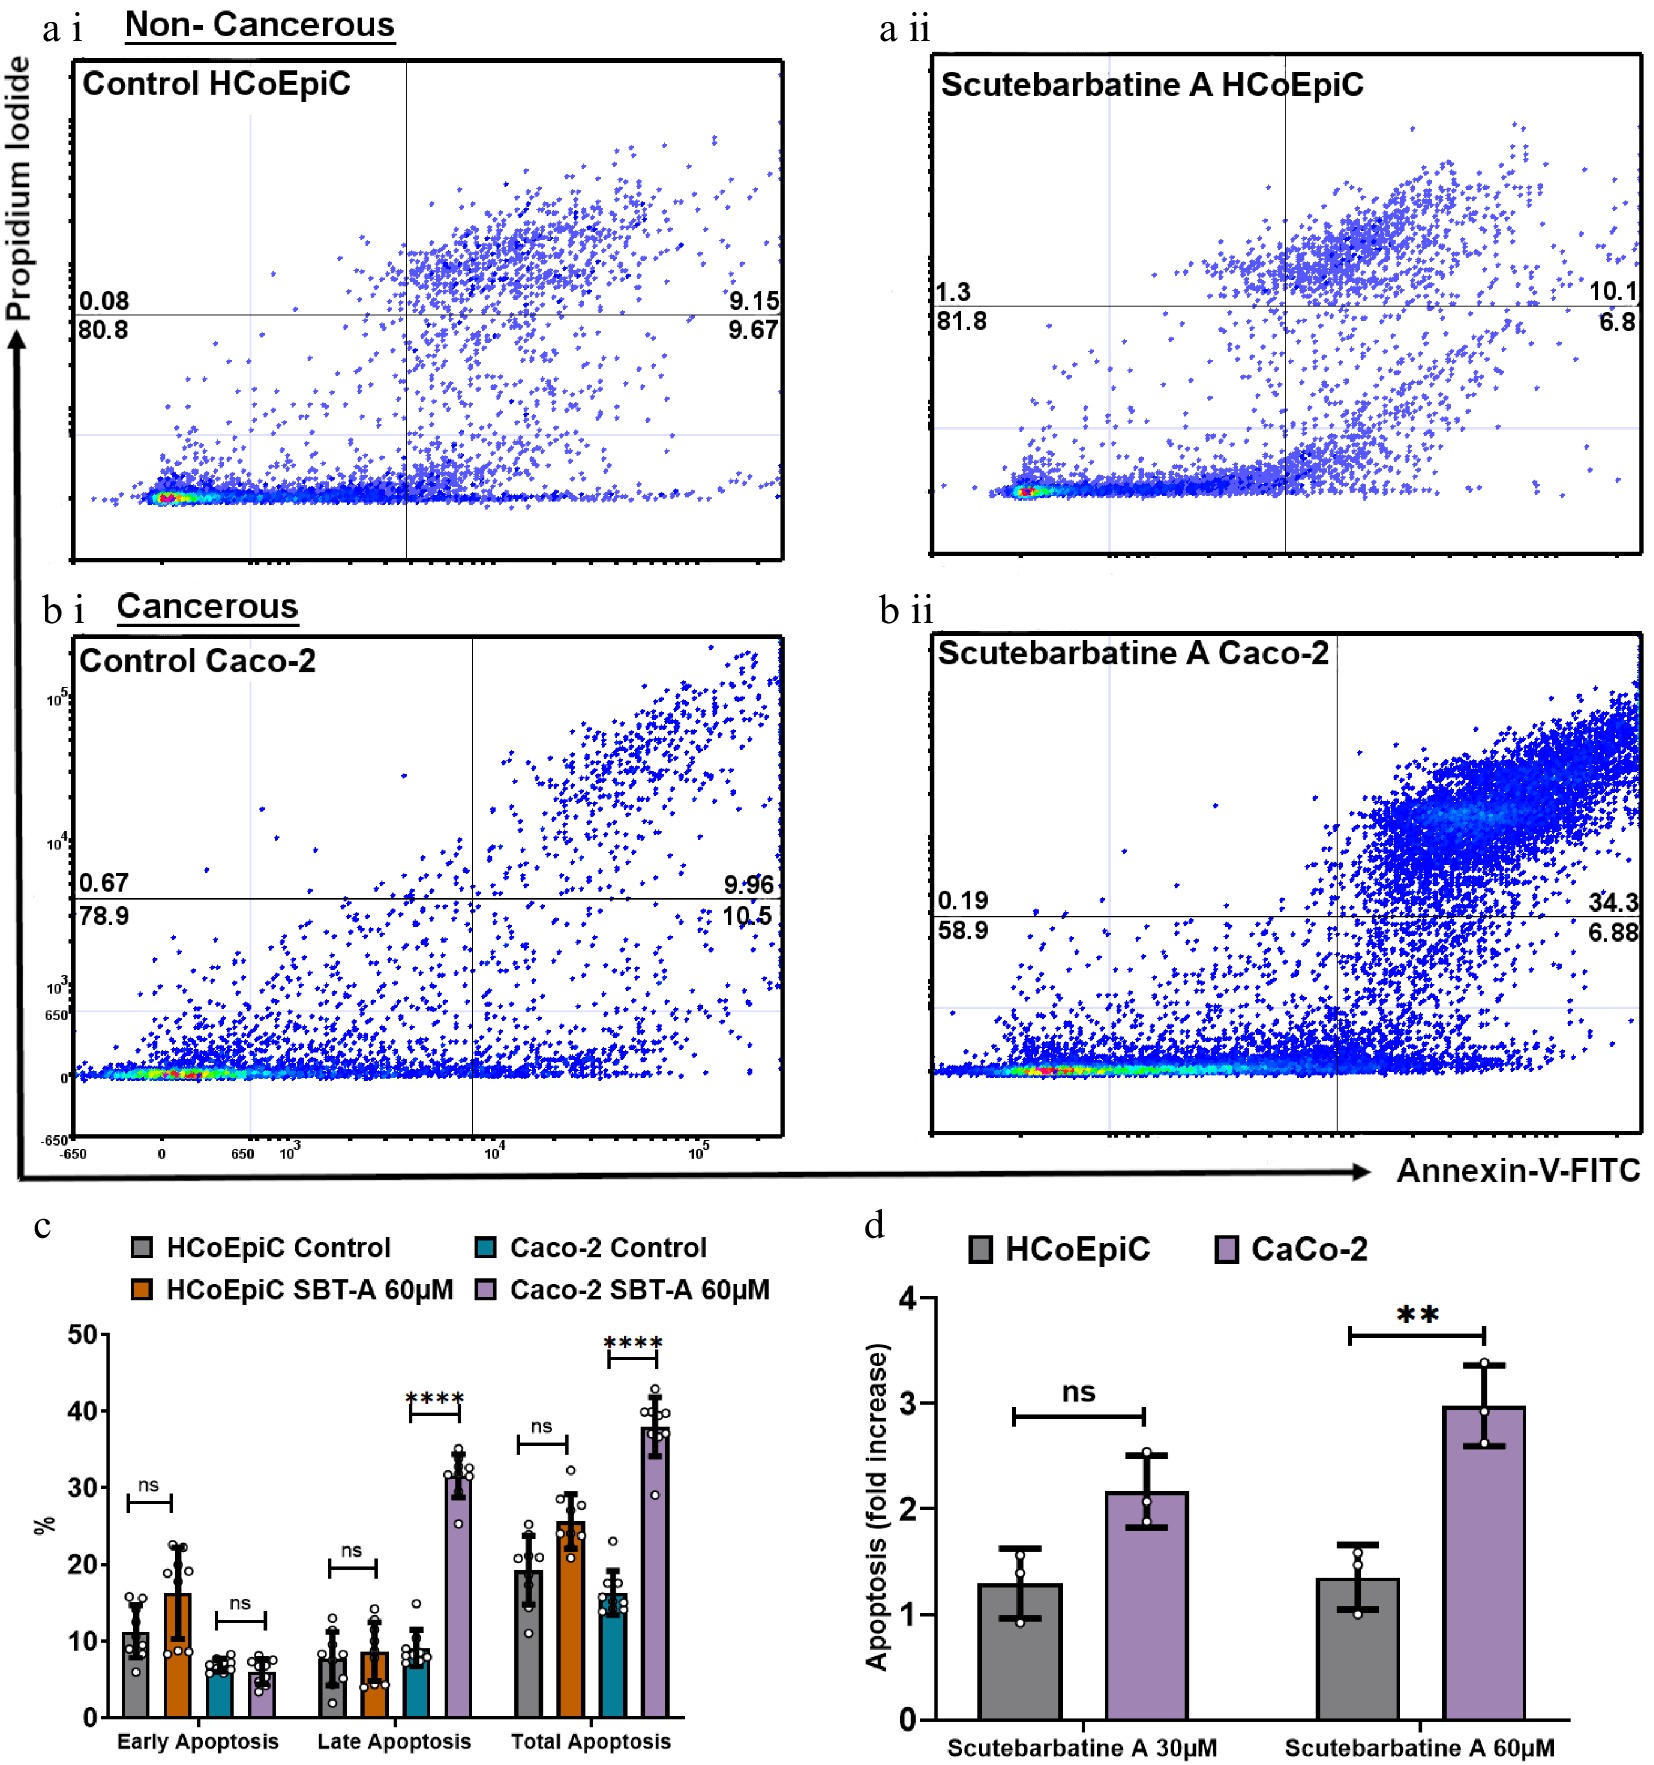
Figure 3.
Scutebarbatine A demonstrates selective cytotoxicity against cancer cells. (a1) Non-cancerous HCoEpiC cells with control. (a ii) HCoEpiC cells treated with Scutebarbatine A at 60 µM. (b i) Cancerous Caco-2 cells with control treatment. (b ii) Cancerous Caco-2 cells treated with Scutebarbatine A at 60 µM. Annexin V positive cells are on the FITC-A (X axis) and Pi positive cells are on the PE-A (Y axis). Numbers in quadrats are %. Data is displayed as individual dots. (c) Bar chart showing differences in the two different cell lines, statistical difference compared to respective controls (n = 3). (d) Fold difference in total apoptosis, annexin V+ cells and Annexin V/Pi+ cells. Data are displayed as individual datapoints. Horizontal bars represent the means and error bars SDev, (**** for P ≤ 0.0001, ** for P ≤ 0.01), n = 3 biologically independent experiments.
-
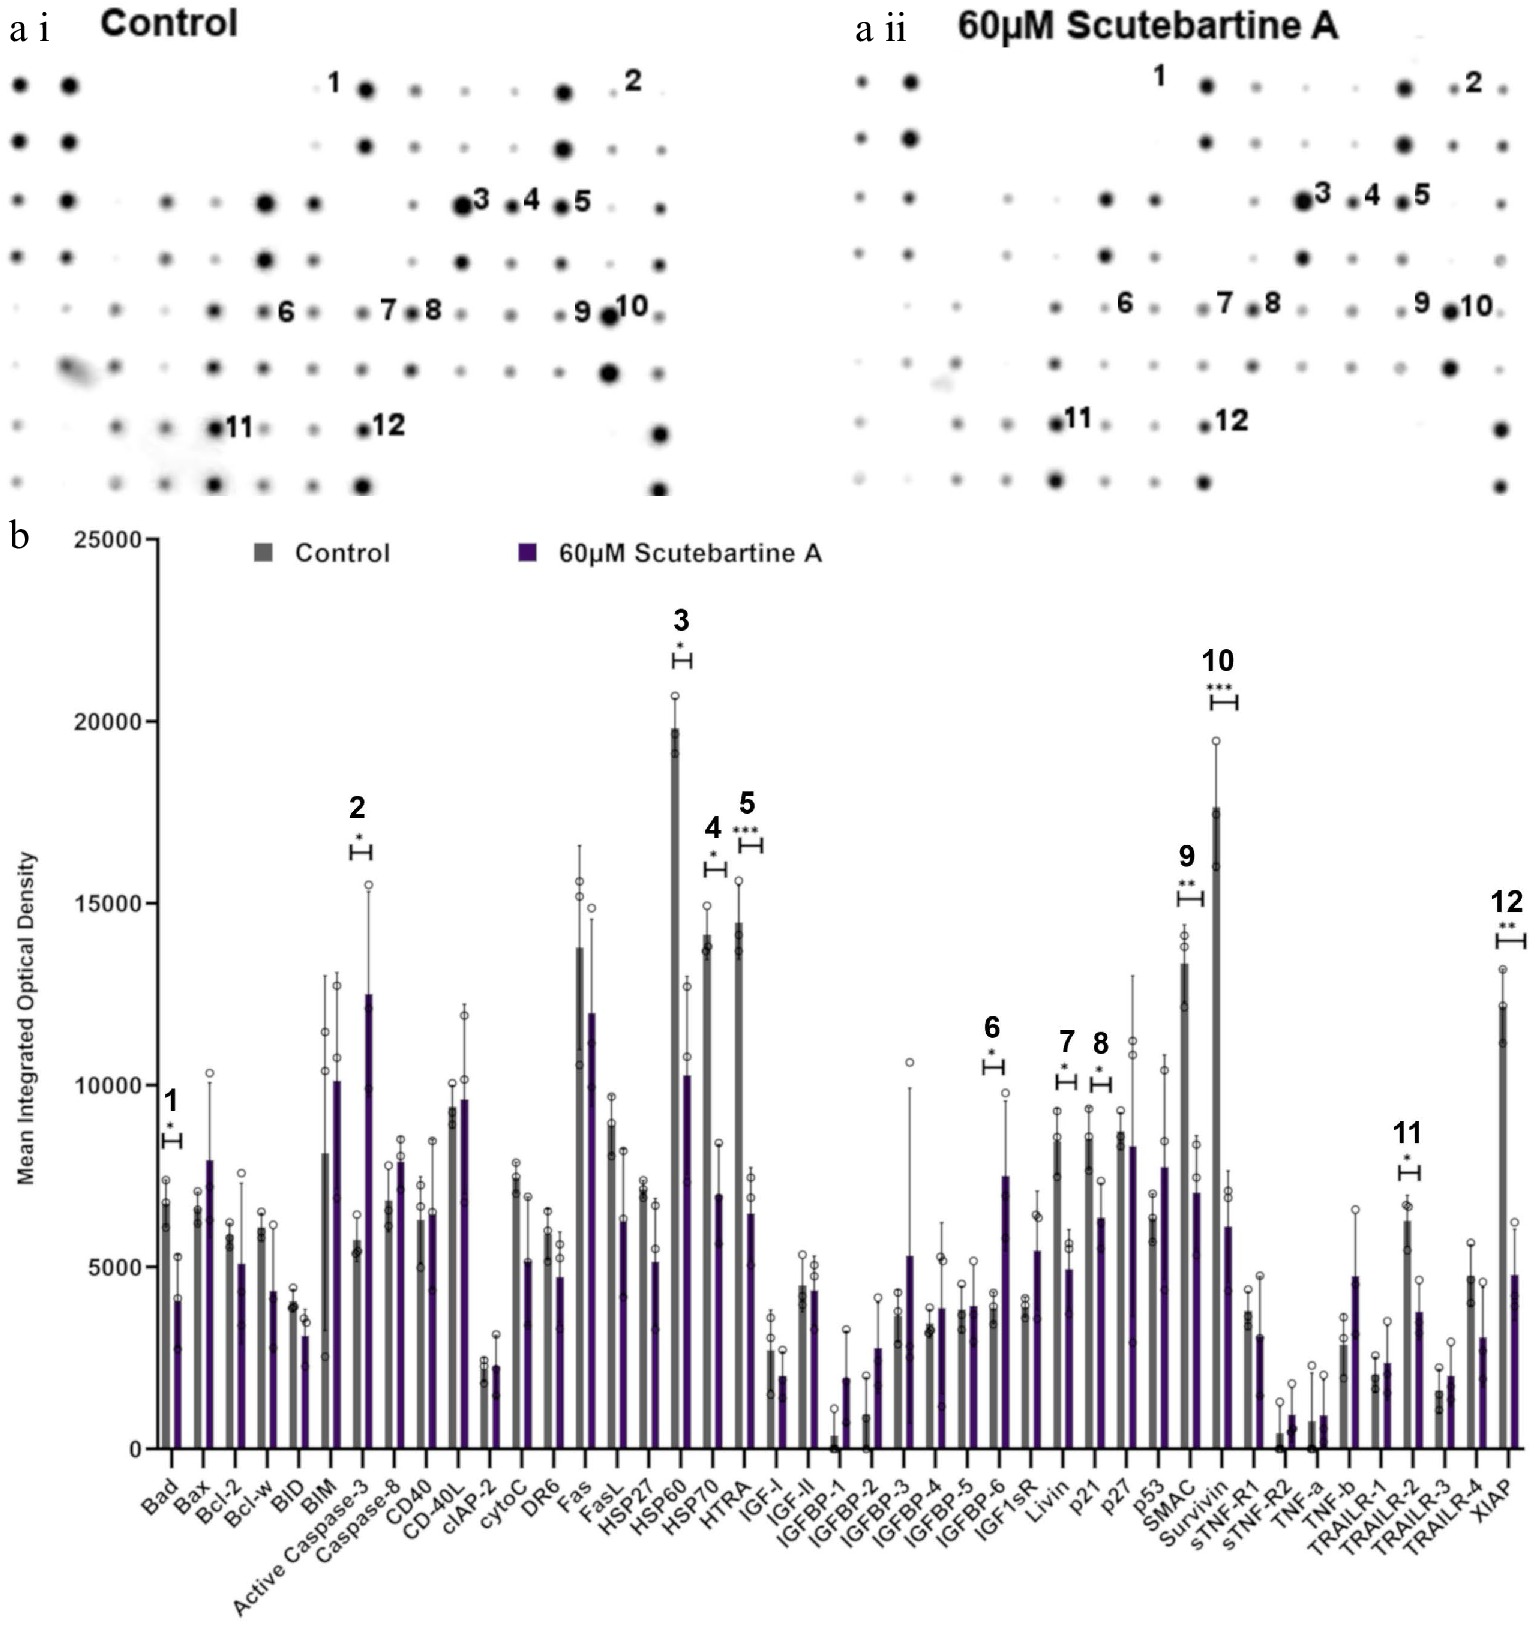
Figure 4.
Specific apoptotic protein changes in Caco-2 cancer cells, treated with 60 µM scutebartine A. (a i) and (a ii) show representative antibody array dot plots. (a i) shows the control treatment. (a ii) was treated scutebarbatine A (60 µM) array. Affected genes are labelled: 1-Bad, 2-Caspase 3, 3-HSP60, 4-HSP70, 5-HTRA2, 6-IGFBP-6, 7-Livin, 8-p21, 9-SMAC, 10-Survivin, 11-TRAILR-2, 12-XIAP. (b) Bar chart showing all 43 of the apoptotic genes assayed in the antibody array, * P ≤ 0.05, ** for P ≤ 0.01, *** P ≤ 0.001. Genes affected are: Bad, Caspase 3, HSP60, HSP70, HTRA2, IGFBP-6, Livin, p21, SMAC, Survivin, TRAILR-2, XIAP. Data are displayed as individual datapoints. Horizontal bars show significant changes and error bars show SDev, n = 3 biologically independent experiments.
-
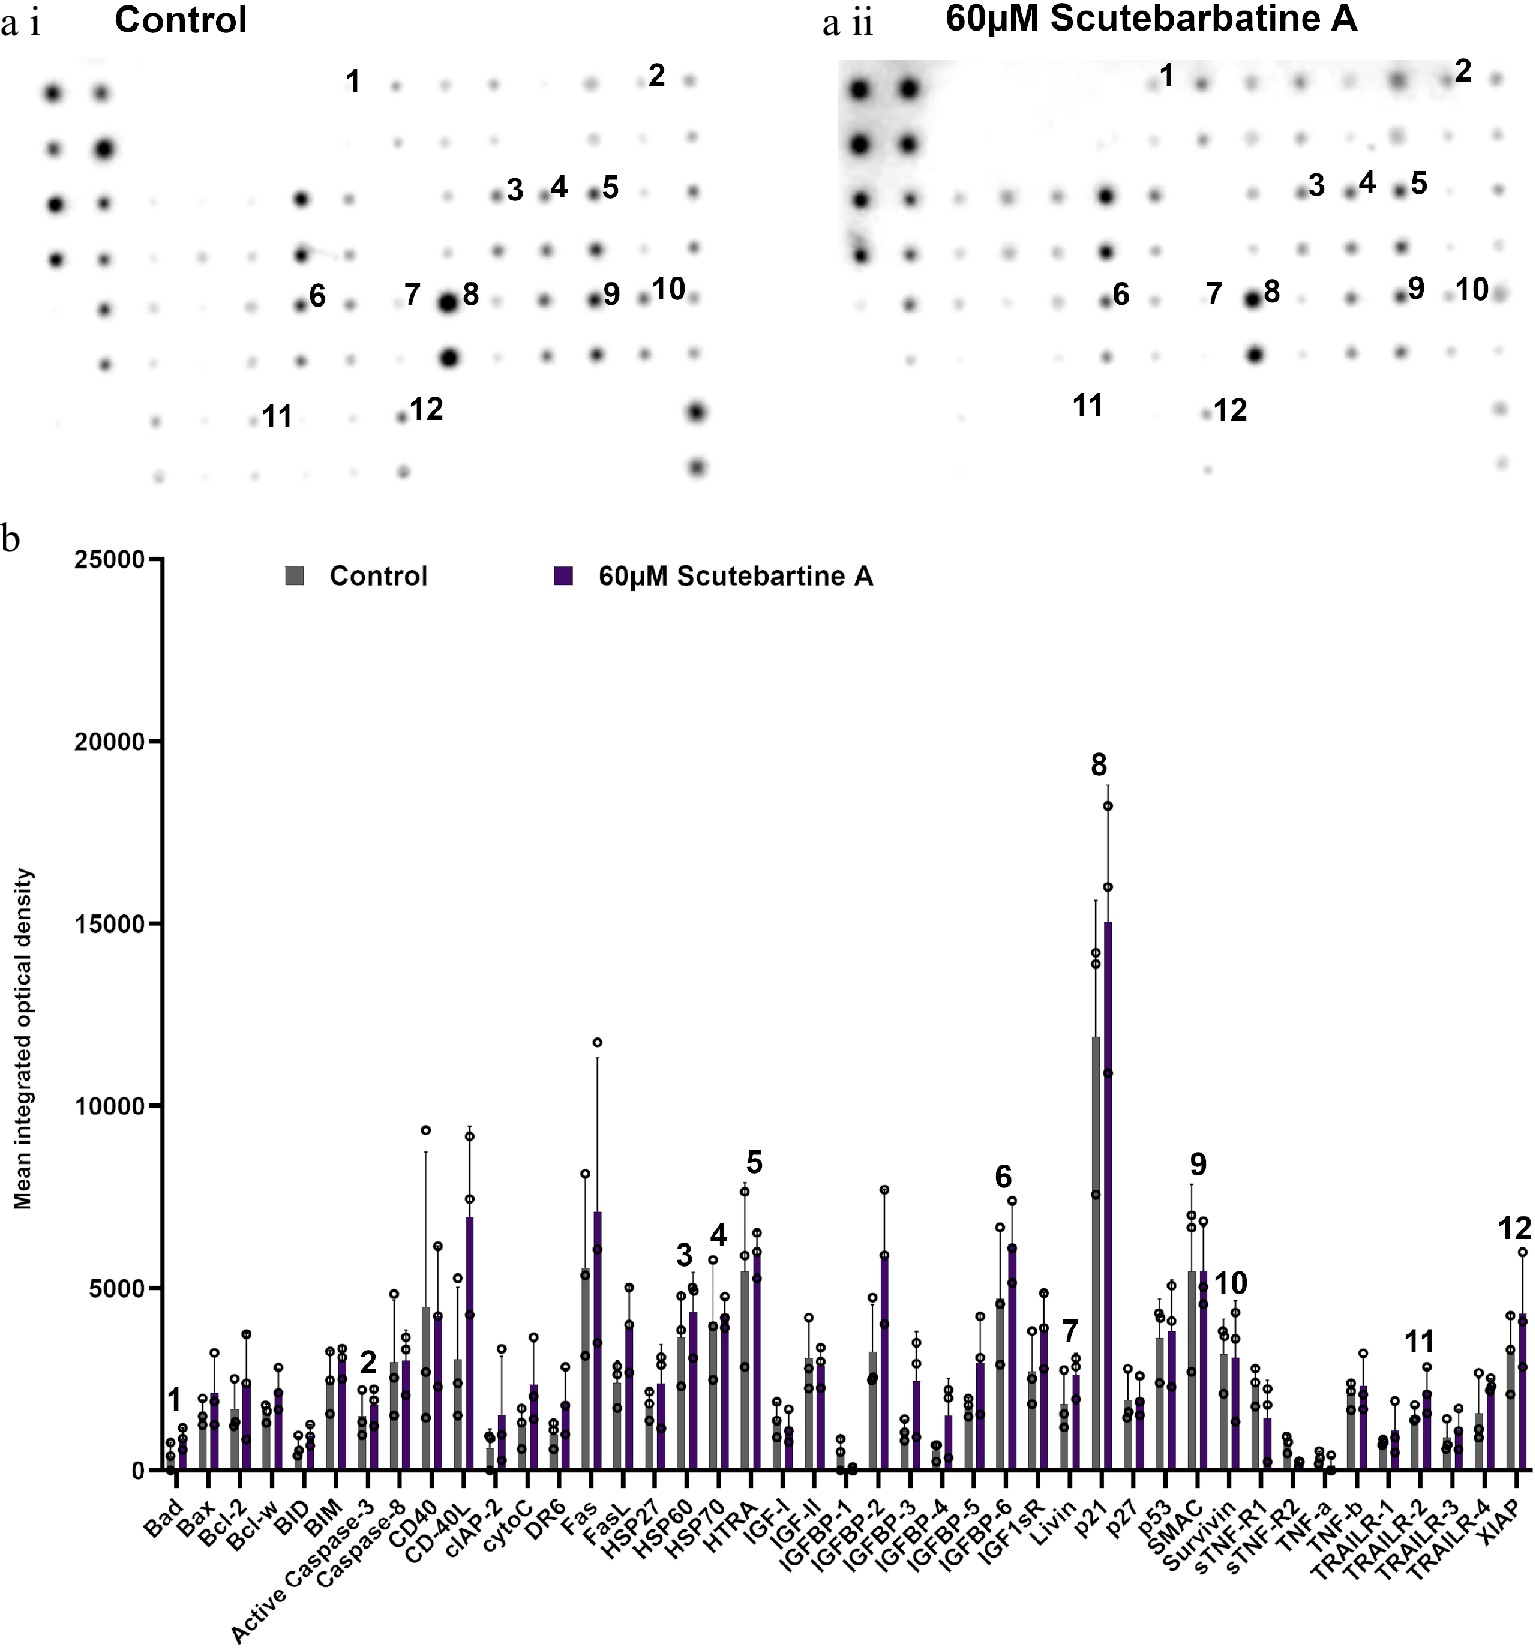
Figure 5.
Profile of changes in proteins associated with apoptosis in a non-cancerous cell line (HCoEpiC). (a i) & (a ii) representative antibody array dot plots. (a i) shows the control. (a ii) is the array from cells treated with scutebarbatine A (60 µM). Proteins affected in the Caco-2 cell lines are labelled for comparison: 1-Bad, 2-Caspase 3, 3-HSP60, 4-HSP70, 5-HTRA2, 6-IGFBP-6, 7-Livin, 8-p21, 9-SMAC, 10-Survivin, 11-TRAILR-2, 12-XIAP. (b) Bar chart showing all 43 of the apoptotic proteins assayed in the antibody array, mean ± S.D. 1-Bad, 2-Caspase 3, 3-HSP60, 4-HSP70, 5-HTRA2, 6-IGFBP-6, 7-Livin, 8-p21, 9-SMAC, 10-Survivin, 11-TRAILR-2, 12-XIAP. Protein levels remained unchanged with scutebarbatine A (60 µM) treatment. Mean ± S.D (n = 3). Data are displayed as individual datapoints. Horizontal bars show significant changes and error bars show SDev, n = 3 biologically independent experiments.
-
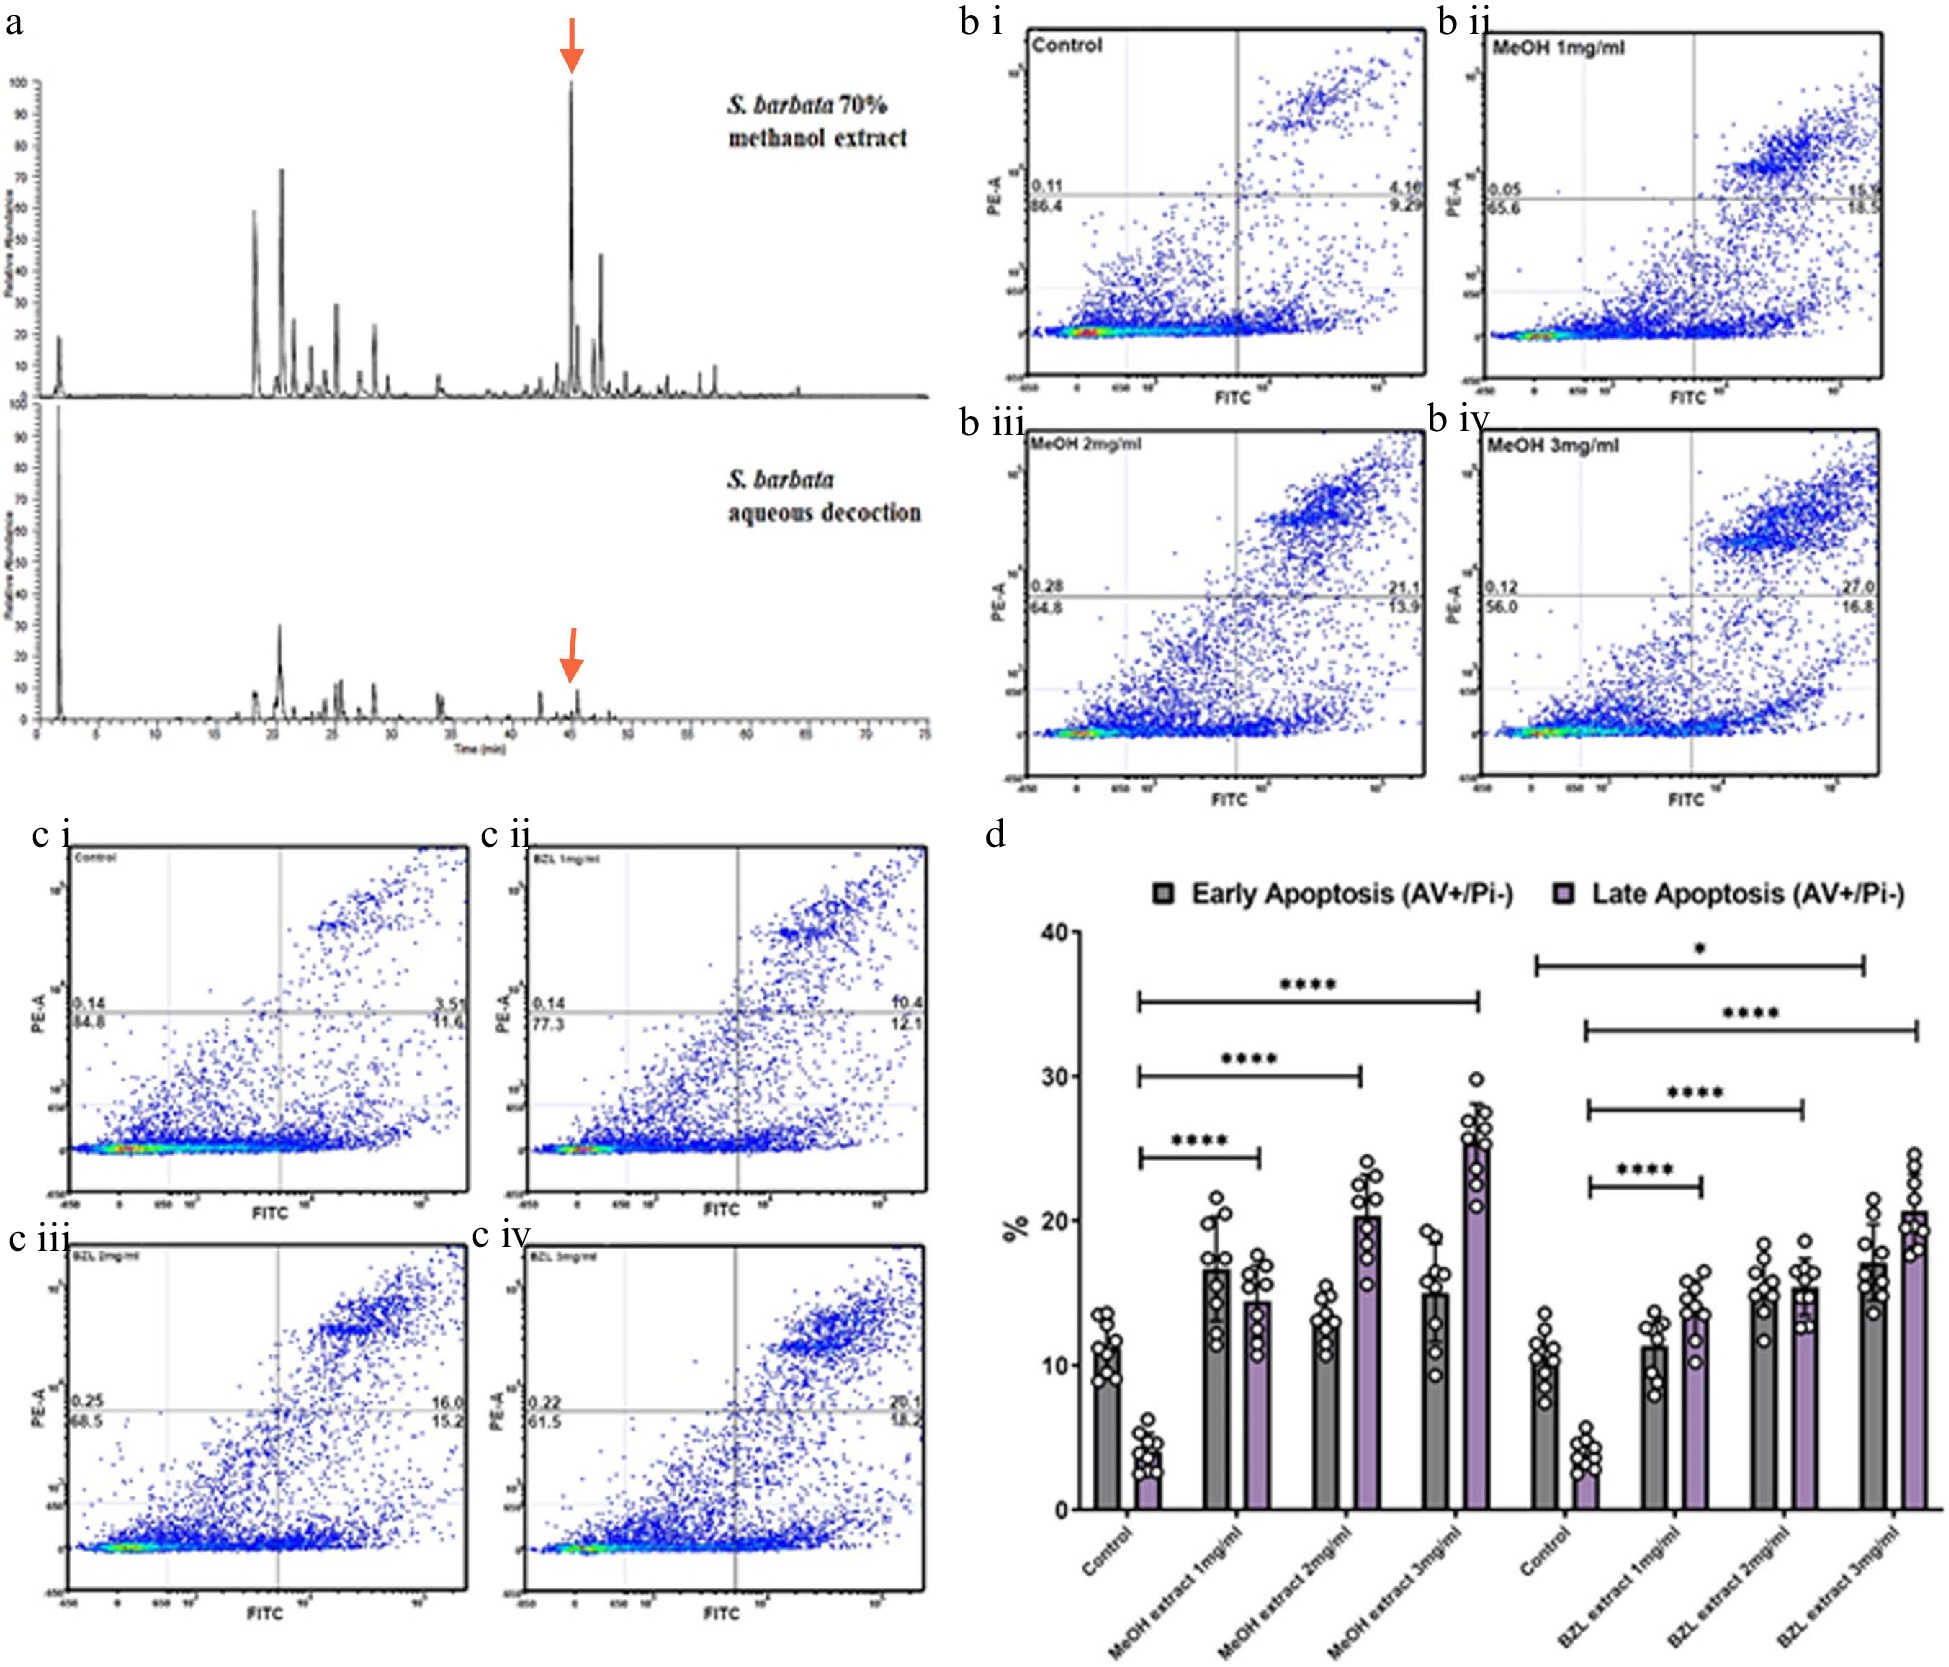
Figure 6.
Comparative analysis of hydrophilic and hydrophobic extractions of S. barbata on initiation of apoptosis in Caco-2 cancer cells. (a) Base ion chromatograms from LC-MSn (positive ESI) analysis of the S. barbata leaf 70% methanol extract and the BZL aqueous decoction. ↓ indicates m/z 559.24, scutebarbatine A. Compounds detected in both extracts have been assigned as detailed in Supplemental Table S2 and Supplemental Fig. S5. (b i)–(b iv) Caco 2 cells treated with MeOH S. barbata extract at 1, 2 and 3 mg/ml respectively. Annexin V positive cells are on the FITC-A (X axis) and Pi positive cells are on the PE-A (Y axis). Numbers in quadrats are %. (c i)–(c iv) .Caco 2 cells treated with BZL hydrophilic S. Barbata extract at 1, 2 and 3 mg/ml respectively. Annexin V positive cells are on the FITC-A (X axis) and Pi positive cells are on the PE-A (Y axis). Numbers in quadrats are %. (d) Bar chart showing differences in cells in early and late apoptosis following treatment with differing concentration of the hydrophobic methanolic extract and the hydrophilic BZL extract, (**** for P ≤ 0.0001, *** P ≤ 0.001, * for P ≤ 0.05), statistical difference compared to respective controls. Data are displayed as individual datapoints. Horizontal bars show significant changes and error bars show SDev, n = 3 biologically independent experiments.
-
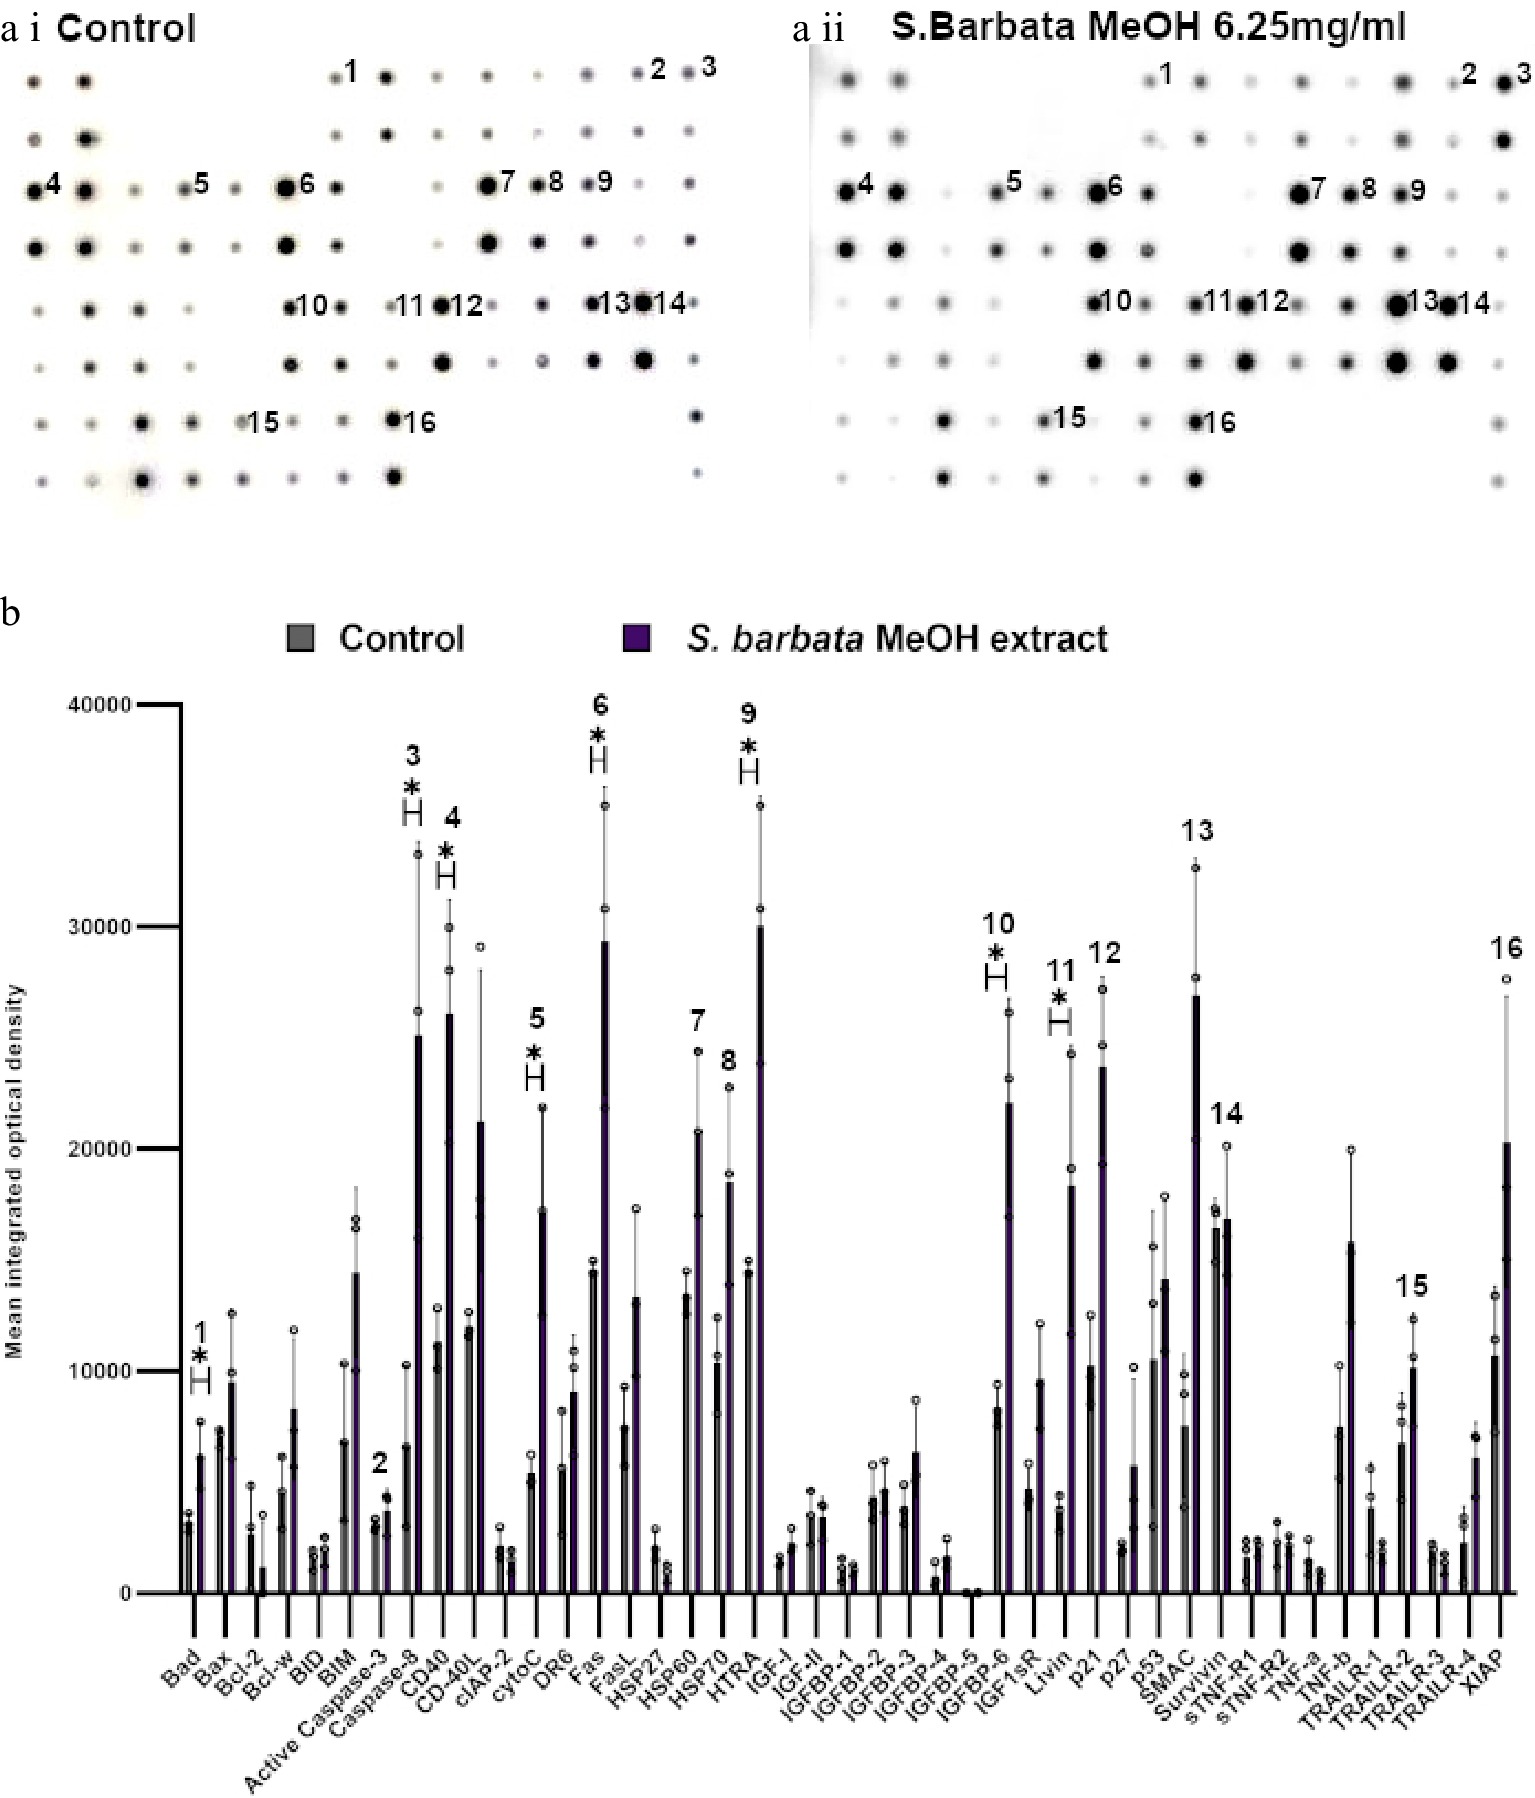
Figure 7.
Specific apoptotic proteins in Caco-2 cancer cells, treated with a methanolic extract from leaves of S. barbata. (a i) and (a ii) show representative antibody array dot plots. (a i) shows the control untreated cells. (a ii) shows the proteins of the apoptosis array treated the methanolic extract (3.0 mg/ml). (b) Bar chart showing all 43 of the apoptotic proteins assayed in the antibody array,, (* P < 0.05, n = 3). Genes affected are labelled: 1-Bad, 2-Caspase 3, 3-Caspase-8, 4-CD40, 5-CytoC, 6-Fas, 7-HSP60, 8-HSP70, 9-HTRA, 10-IGFB-6, 11-Livin, 12-p21, 13-SMAC, 14-Survivn, 15-TRAILR-2, 16-XIAP. Data are displayed as individual datapoints. Horizontal bars show significant changes and error bars show SDev, n = 3 biologically independent experiments * for P ≤ 0.05.
-
Tissue Content (ng/g fresh weight) Root 0.38 Flower 105.26 Young stem 1.75 Old stem 1 Leaf (< 0.5 cm) 922.76 Leaf (0.5−1 cm) 953.84 Leaf (1−2 cm) 551.42 Leaf (> 2 cm) 408.90 Table 1.
Contents of scutebarbatine A in different organs of S. barbata.
Figures
(7)
Tables
(1)